
CHAPTER 19
![]()
Packaging, Debugging and Testing F# Code
Successful programming must involve a healthy marriage of good code with good software engineering techniques and practice. Sometimes these overlap: functional programming is a good software-engineering technique: among other benefits, anecdotal evidence indicates that functional programming frequently leads to a substantially reduced bug rate for good programmers. This is primarily because programs built using functional techniques tend to be highly compositional, building correct programs out of correct building blocks. The functional-programming style avoids or substantially reduces the use of side effects in the program, one property that makes programs more compositional. Debugging and testing are still essential activities to ensure that a program is as close as possible to its specifications, however. Bugs and misbehaviors are facts of life, and F# programmers must learn techniques to find and remove them. Often, these techniques are not inherently “functional “or even particularly “code” related, but they are still critical to the process of writing robust, maintainable, and successful software components.
You also need to learn many pragmatics of building and packaging F# code. As a result, this chapter turns to the pragmatics of packaging, debugging, and testing F# code.
Packaging Your Code
To begin your exploration of ways to package F# code, let’s first talk about the sorts of things you may be building with F#.
Mixing Scripting and Compiled Code
Small programs are often used both as interactive scripts and as small compiled applications. Here are some useful facts to know about scripting with F# and F# Interactive:
- F# scripts use the extension
.fsx.- A script file can contain
#rdirectives. These reference a library or a type provider.- A script file can contain
#loaddirectives. This is as if the files had been compiled using the command-line compiler and included in the same assembly as the referencing script.- A script that is referenced via a
#loadcan itself contain further#loadand#rreferences. This means that a script can act like a “little library.” If the same root file transitively references the same script more than once via#load, the file acts as if it is logically only referenced once.- You can access command-line arguments from within scripts by using the expression
fsi.CommandLineArgs. Within compiled code, useSystem.Environment.GetCommandLineArgs. Within code used in both modes, use conditional compilation to switch between these, as shown in the next coding example.- You can run a script on startup by using the
--execcommand-line option forfsi.exeor by giving a single file name on the command line. You can find other command-line options by usingfsi.exe --help.
Conditional compilation is a particularly useful feature for scripts—especially the predefined conditional compilation symbols COMPILED and INTERACTIVE. The former is set whenever you compile code using the command-line compiler, fsc.exe, and the latter is set whenever you load code interactively using F# Interactive. A common use for these flags is to start the GUI event loop for a Windows Forms or other graphical application, such as using System.Windows.Forms.Application.Run. F# Interactive starts an event loop automatically, so you require a call to this function in the compiled code only:
open System.Windows.Forms


let form = new Form(Width = 400, Height = 300,

                    Visible = true, Text = "F# Forms Sample")

#if COMPILED

// Run the main code

System.Windows.Forms.Application.Run(form)

#endif
![]() Note: You can specify additional conditional compilation directives by using the
Note: You can specify additional conditional compilation directives by using the --define command-line compiler option.
Choosing Optimization Settings
The F# compiler comes with a simple choice of optimization levels. You nearly always want to compile your final code using --optimize, which applies maximum optimizations to your code. This is also the default optimization setting when using fsc.exe or fsi.exe directly, but it is not the default for compiled code using Visual Studio’s “Debug” mode.
The F# compiler is a cross-module, cross-assembly optimizing compiler, and it attaches optimization information to each assembly you create when using optimization. This information may contain some code fragments of your assembly, which may be inlined into later assemblies by the optimizing compiler. In some situations, you may not want this information included in your assembly. For example, you may expect to independently version assemblies, and in this case, you may want to ensure that code is never duplicated from one assembly to another during compilation. In this case, you can use the --nooptimizationdata switch to prevent optimization data being recorded with the assemblies that you create.
Generating Documentation
In Chapter 2, you saw that comments beginning with /// are XML documentation comments, which are used by interactive tools such as Visual Studio. They can also be collected to generate either HTML or XML documentation. You generate HTML documentation using an auxiliary tool, such as FsHtmlDoc, which is available in the F# Power Pack.
You can also generate a simple XML documentation file using the --doc command-line option. You must name the output file. For example, using fsc -a --doc:whales.xml whales.fs for the code in Listing 7-11 in Chapter 7 generates the file whales.xml containing:
<?xml version="1.0" encoding="utf-8"?>

<doc>

    <assembly><name>whales</name></assembly>

    <members>

      <member name="T:Whales.Fictional.WhaleKind">

        <summary> The three kinds of whales we cover in this release</summary>

      </member>

      <member name="P:Whales.Fictional.bluey">

      <summary> The backup whale</summary>

      </member>

      <member name="P:Whales.Fictional.moby">

       <summary>The main whale</summary>

      </member>


      <member name="P:Whales.Fictional.orca">

       <summary> This whale is for experimental use only</summary>

      </member>

      <member name="P:Whales.Fictional.whales">

       <summary> The collected whales</summary>

      </member>

      <member name="T:Whales.Fictional">

      </member>

    </members>

</doc>
Building Shared Libraries
You usually need to share libraries among multiple applications. You can do this by using any of these techniques:
- Including the same library source file in multiple projects and/or compilations
- Duplicating the DLL for the library into each application directory
- Creating a library and sharing it using a package-sharing tool such as NuGET
- Creating a strong name-shared library and installing it on the target machine
This section covers the last option in more detail. A strong name-shared library has the characteristics:
- It’s a DLL.
- You install it in the .NET global-assembly cache (GAC) on the target machine.
- You give it a strong name by using
--keyfile. This corresponds to project-signing options in the MonoDevelop and Visual Studio settings.- You package all of its supporting data files using
--linkresource. This corresponds to “EmbeddedResource” in the MonoDevelop and Visual Studio settings.- You (optionally) give it a version number using an
AssemblyVersionattribute in your code.- You ensure that all of its dependencies are shared libraries.
The usual place to install shared libraries is the .NET GAC. The GAC is a collection of assemblies installed on the machine and available for use by any application that has sufficient privileges. Most libraries used in this book, such as System.Windows.Forms.dll, are installed in the GAC when you install the .NET Framework on a machine.
The remaining requirements are easy to satisfy and are conditions that must hold before you install something in the GAC. For example, assemblies must have strong names. All assemblies have names; for example, the assembly whales.dll (which you compiled in the earlier “Compiling DLLs” section using fsc -a whales.fs) has the name whales. An assembly with a strong name includes a hash using a cryptographic public/private key pair. This means that only people who have access to the private key can create a strong-named assembly that matches the public key. Users of the DLL can verify that the contents of the DLL were generated by someone holding the private key. A strong name looks something like:
mscorlib, Version=2.0.0.0, Culture=neutral, PublicKeyToken=b77a5c561934e089
It’s easy to create a strong-named assembly: generate a public/private key pair using the sn.exe tool that comes with the .NET Framework SDK, and give that as your keyfile argument. You can install libraries into the GAC using the .NET Framework SDK utility gacutil.exe. This command-line session shows how to do this for the code shown in Listing 7-11, again in Chapter 7:
C:UsersdsymeDesktop> sn.exe -k whales.snk


Microsoft (R) .NET Framework Strong Name Utility  Version 4.0.30319.17929

Copyright (c) Microsoft Corporation.  All rights reserved.


Key pair written to whales.snk


C:UsersdsymeDesktop> fsc -a --keyfile:whales.snk whales.fs

Microsoft (R) F# Compiler version 11.0.50727.1

Copyright (c) Microsoft Corporation. All Rights Reserved.


C:UsersdsymeDesktop> gacutil /i whales.dll

Microsoft (R) .NET Global Assembly Cache Utility.  Version 4.0.30319.17929

Copyright (c) Microsoft Corporation.  All rights reserved.


Assembly successfully added to the cache
Installer generators, such as WiX, also include directives to install libraries into the GAC. Installer generators are discussed later in this chapter.
![]() Note: If you’re planning to write libraries for use by the rest of the world, we recommend that you take the time to read the .NET library design guidelines, document them using XML and HTML docs, and learn how to version your libraries. Chapter 20 takes a deeper look at guidelines for library design.
Note: If you’re planning to write libraries for use by the rest of the world, we recommend that you take the time to read the .NET library design guidelines, document them using XML and HTML docs, and learn how to version your libraries. Chapter 20 takes a deeper look at guidelines for library design.
Using Static Linking
Sometimes, applications use a DLL as a library, but when it comes to deploying the application on a Web site or as installed software, it may be easier to bundle that DLL as part of the application. You can do this in two ways: by placing the DLL alongside the EXE for the application or by statically linking the DLL when you create the EXE. You select the DLL by using the --staticlink compiler option with the assembly name of the DLL.
You can also bundle the F# libraries into your application to give a zero-dependency application. You statically link all DLLs that depend on the F# libraries by using the --standalone compiler option.
Static linking can cause problems in some situations and should be used only for a final EXE or a DLL used as an application plug-in.
Packaging Different Kinds of Code
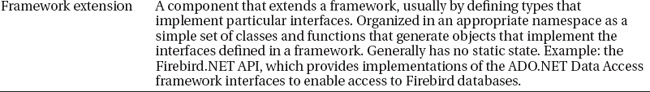
Table 19-1 lists some of the kinds of software implemented with F#. These tend to be organized in slightly different ways and tend to use encapsulation to varying degrees. For example, encapsulation is used heavily in frameworks but not when you’re writing 100-line scripts.
Using Data and Configuration Settings
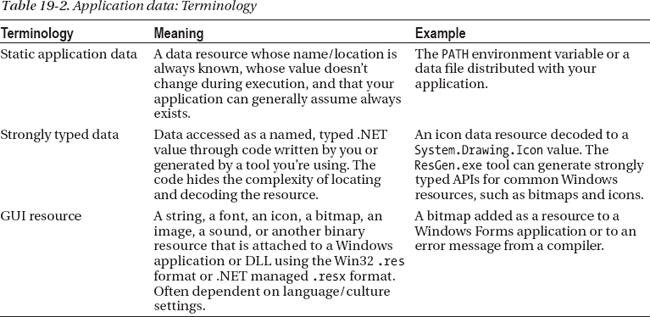
So far, this book has focused on code. In reality, almost every program comes with additional data resources that form an intrinsic part of the application. Common examples of the latter include the resource strings, sounds, fonts, and images for GUI applications. Applications typically select among different data resources based on language or culture settings. Often, programs also access additional parameters, such as environment variables derived from the execution context or registry settings recording user-configuration options. It can be useful to understand the idioms used by .NET to make managing data and configuration settings more uniform. Table 19-2 shows some terminology used for data resources.
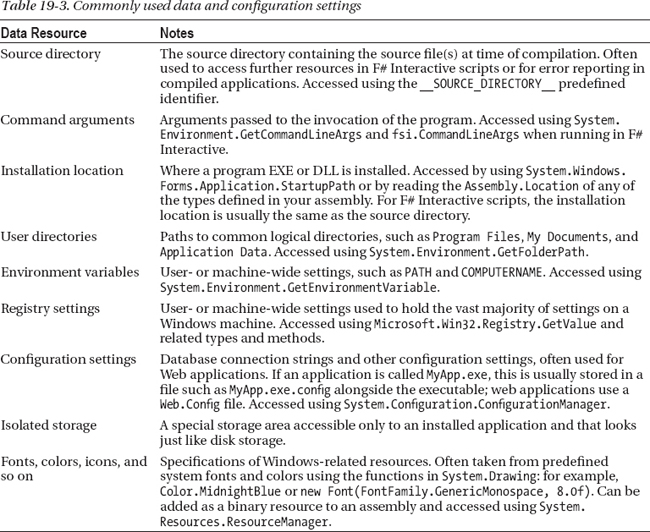
You may need to access many different kinds of data resources and application settings. Table 19-3 summarizes the most common ones.
You can author GUI data resources, such as fonts, images, strings, and colors, by creating a.resx file using a tool such as Visual Studio. You then compile them to binary resources by using the resgen.exe tool that is part of the .NET Framework SDK. Most development environments have tools for designing and creating these resources. Often, the .NET Framework contains a canonical type, such as System.Drawing.Color, for any particular kind of resource; avoid writing needless duplicate types to represent them.
Sometimes it’s a good idea to make sure a data resource is officially part of an assembly. For example, this is required if the assembly will be installed into the GAC. You can embed resources in applications (or associate them with a DLL) by using the --resource compiler option.
Debugging Your Code
Programming systems such as .NET support debugging as a primary activity through tools to help you inspect programs for possible errors. The debugger is one of the most important of these tools, and it allows you to inspect the program state during execution. You can execute the program stepwise and analyze its state during execution.
DEBUGGABLE PROGRAMS
Let’s start with the following simple function, which is in principle meant to return true if the input string is a palindrome and false otherwise:
let isPalindrome (str : string) =

    let rec check(s : int, e : int) =

        if s = e then true

        elif str.[s] <> str.[e] then false

        else check(s + 1, e - 1)


    check(0, str.Length - 1)
The function appears correct at first sight. It works only for strings with an odd number of characters and strings with an even length that aren’t palindromes, however. In particular, the program raises an exception with the "abba" string as input.
Let’s see how to use the Visual Studio debugger to figure out the problem with this simple function. The algorithm recursively tests the characters of the string pairwise at the beginning and at the end of the string, because a string is a palindrome if the first and last characters are equal and the substring obtained by removing them is a palindrome too. The s and e variables define the boundaries of the string to be tested and initially refer to the first and last characters of the input string. Recursion terminates when the outermost characters of the string to be tested differ or when you’ve tested the whole string and the indexes collide.
Figure 19-1 shows the debugging session of the simple program. You set a breakpoint at the instruction that prints the result of the isPalindrome function for the "abba" string by clicking where the red circle is shown, which indicates the location of the breakpoint. When you start the program in debug mode, its execution stops at the breakpoint, and you can step through the statements. The current instruction is indicated by the yellow arrow, and the current statement is highlighted, as shown in Figure 19-1.
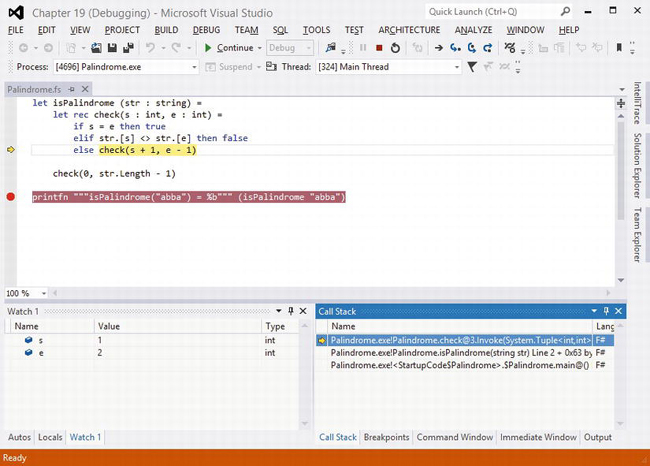
Figure 19-1. The Visual Studio debugger
You can access the state of the program through a number of windows that show different aspects of the running program and that are usually docked at the bottom of the debugging window. For instance, you can inspect the state of the local variables of the current method (the Locals window shows the local variables and arguments, e and s in this example) or the state of the call stack to see the sequence of method calls (the Call Stack window). The Watch view lets you write variable names and simple expressions and watch them change during execution. You can also evaluate expressions in the Immediate window and invoke methods, as shown in Figure 19-1, where the simple expressions e and s are used. More views are available through the Debug menu, including the state of executing threads and the memory.
This simple example examines why isPalindrome misbehaves for an input string of even length. As shown in Figure 19-1, the Watch window is used to monitor the s and e variables intended to define the bounds of the substring that has yet to be checked; in this case, the two indexes cross without ever becoming equal, which is the criterion used to successfully stop the recursion. This happens when s has value 2 and e has value 1 in the example. The symptom of the function misbehavior is that an exception is thrown; this is frequently where debugging starts. In this example, the exception is thrown a few steps forward, when e gets value -1, which is an invalid index for accessing a character in a string. If you used str[e] as the watch expression or in the Immediate window, the problem would be evident. In more complicated situations, the ability to inspect the application state when the exception is raised makes it possible to determine what conditions to break on and where to set breakpoints before a bug occurs. Now that you’ve found the bug, you can fix it by extending the test from s = e to s >= e to ensure that even if the end index becomes smaller than the starting index, you deal with the situation appropriately.
![]() Note: In Visual Studio and other Microsoft .NET debugging tools, debugger expressions follow the C# syntax, and arrays don’t require the dot before the square braces. The most noticeable difference between C# and F# expression syntax is that access to arrays uses
Note: In Visual Studio and other Microsoft .NET debugging tools, debugger expressions follow the C# syntax, and arrays don’t require the dot before the square braces. The most noticeable difference between C# and F# expression syntax is that access to arrays uses [] rather than .[] and the equality operator is == rather than =.
Using More Features of the Visual Studio Debugger
This section focuses on relevant aspects of the debugging facilities that the CLR provides to managed applications via tools such as the Visual Studio debugger.
Consider the notion of a breakpoint—an essential tool to mark a statement in a program where you want to suspend execution and inspect the program state. Often, a bug appears only under very specific conditions. Trivial bugs, such as the one discussed earlier, are the easiest to track and the first to be fixed in a program. It can be difficult or even impossible to selectively suspend program execution at a statement only when certain conditions are met. Many programmers introduce an if statement with a dummy statement for the body and set the breakpoint to the statement to suspend the program under the defined condition. This requires a recompilation of the program and a change to the source code, which may lead to further problems, particularly when several points of the program must be kept under control. A more effective strategy is to use conditional breakpoints, a powerful tool offered by the debugger. When you right-click a breakpoint in the editor window or in the Breakpoints window (accessible through the Debug menu), a number of additional options become available.
For each breakpoint you can indicate:
- A condition: An expression that must be satisfied by the program state in order to suspend program execution
- A hit count: The number of times the breakpoint should be hit before suspending execution
- A filter: A mechanism to filter the machine, process, and thread to select the set of threads that will be suspended when the breakpoint is hit
- An action: Something to be executed when the breakpoint is hit
Breakpoint conditions and hit counts are the most frequently used options. A hit count is useful when a bug appears only after a significant period of execution. For instance, when you’re debugging a search engine, a bug may occur only after indexing gigabytes of data; the number of hits of the breakpoint can be determined.1 Conditional expressions are more useful when it’s difficult to reproduce the exact circumstances that trigger a bug and when the number of times the breakpoint is hit is variable. For expressions entered in the Immediate window, conditional expressions are expressed as in C#; this is true for all languages, because the debugger infrastructure within the CLR is designed to deal with compiled programs and ignores the source language.
__________
1One of the authors became a fan of this approach when a program he was writing crashed only after crunching 2GB of input data. The ability to stop the program immediately before the crash made it possible to find a particular input sequence that was unexpected. It would have been very difficult to find this bug by printing the state of the application.
Sometimes you need to debug a running program that has been started without the debugger; a typical situation is one in which you’re debugging a service started through the Service snap-in of the Management Console or debugging a Web application live that is executed by IIS rather than by the Web server used for development by Visual Studio. In these situations, you can attach the debugger to a running process by selecting Tools ![]() Attach to Process and selecting the process to debug. There are standard processes that are generally known to programmers:
Attach to Process and selecting the process to debug. There are standard processes that are generally known to programmers: w3p.exe is used by IIS to run application pools where ASP.NET applications run, and the svchost.exe process generally hosts Windows services. Sometimes, however, it can be difficult to find out which process is running the code to debug, because several of these generic process hosts run applications.
Debugging a program significantly slows down its execution speed because the debugger infrastructure injects code to monitor program execution. Conditional breakpoints tend to worsen the situation, because every time the breakpoint is hit, the condition must be tested before standard execution resumes.
The CLR debugging infrastructure operates at the level of compiled assemblies. This has several implications. The objects and types that are visible to the debugger are those generated by the compiler and aren’t always explicitly defined by you in the source code. The program database information tends to preserve the mapping between the source and the compiled program, but sometimes, the underlying structure surfaces to the user. On the other hand, you can debug programs written in different programming languages, even when managed and unmanaged code must interoperate.
![]() Note: One tricky problem with F# programs is debugging tail calls. (Chapter 8 described tail calls.) In particular, when a tail call is executed, the calling stack frame is removed prior to the call. This means that the calls shown in the Visual Studio call stack window may not be complete. Entries may be missing that should, logically speaking, be present, according to the strict call sequence that caused a program to arrive at a particular point. Likewise, the debugger commands
Note: One tricky problem with F# programs is debugging tail calls. (Chapter 8 described tail calls.) In particular, when a tail call is executed, the calling stack frame is removed prior to the call. This means that the calls shown in the Visual Studio call stack window may not be complete. Entries may be missing that should, logically speaking, be present, according to the strict call sequence that caused a program to arrive at a particular point. Likewise, the debugger commands step-into and step-out can behave a little unusually when stepping into a tail call. This behavior may be absent for programs compiled for debugging because many optimizations are disabled, but it appears when you’re debugging a program compiled for release.
Figure 19-2 shows a debugging session for the program discussed in Chapter 18; you’ve stepped into the HelloWorld method, which is a C function accessed through the PInvoke interface as witnessed by the Call Stack window. To enable cross-language debugging, indicate in the project options’ Debug section that the debugging scope is the whole program rather than the current project.
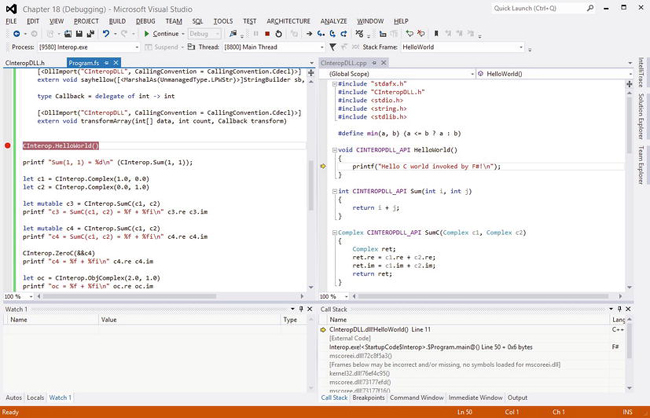
Figure 19-2. Cross-language debugging with the Visual Studio debugger
Instrumenting Your Program with the System.Diagnostics Namespace
A managed application can programmatically access the debugging services of the CLR through the types contained in the System.Diagnostics namespace. Several types in the namespace encompass aspects of the runtime, including stack tracing, communicating with the debugger, accessing performance counters to read statistics about the computer state (memory and CPU usage are typically available using them), and handling operating system processes.
This section focuses on the classes related to debugging and the debugger. You can interact with the debugging infrastructure in three primary ways:
- The
Debugclass programmatically asserts conditions in the program and outputs debugging and tracing information to debuggers and other listeners.- The
Debuggerclass interacts with the debugger, checks whether it’s attached, and triggers breaks explicitly from the program.- The debugging attributes are a set of custom attributes that you can use to annotate the program to control its behavior (see Chapters 9 and 10 for more information about custom attributes).
The Debug class provides a way to output diagnostic messages without assuming that the program has been compiled as a console application; the debug output is collected by one or more listeners that receive the output notifications and do something with them. Each listener is an instance of a class inherited from the TraceListener class and typically sends the output to the console or to a file, or notifies the user with a dialog box (you can find more information about how to write a listener in the class library documentation). The following example instruments the isPalindrome function with tracing statements:
open System.Diagnostics


let isPalindrome (str : string) =

    let rec check(s : int, e : int) =

        Debug.WriteLine("check call")

        Debug.WriteLineIf((s = 0), "check: First call")

        Debug.Assert((s >= 0 || s < str.Length), sprintf "s is out of bounds: %d" s)

        Debug.Assert((e >= 0 || e < str.Length), sprintf "e is out of bounds: %d" e)

        if s = e || s = e + 1 then true

        else if str.[s] <> str.[e] then false

        else check(s + 1, e - 1)

    check(0, str.Length - 1)
The WriteXXX methods of the Debug class output data of a running program are a sophisticated version of the printf debugging approach, where the program is enriched with print statements that output useful information about its current state. In this case, however, you can redirect all the messages to different media rather than just print them to the console. You can also conditionally output messages to reduce the number of messages sent to the debug output. The example outputs a message each time the check method is invoked and uses the conditional output to mark the first invocation.
![]() Note: By default, the diagnostic output isn’t sent to the console on Windows. When a program is executed in debugging mode in Visual Studio, the output is sent to the Output window. Otherwise, you need a tool such as DebugView, available on Microsoft TechNet. F# Interactive doesn’t output any debug assertions being compiled for release.
Note: By default, the diagnostic output isn’t sent to the console on Windows. When a program is executed in debugging mode in Visual Studio, the output is sent to the Output window. Otherwise, you need a tool such as DebugView, available on Microsoft TechNet. F# Interactive doesn’t output any debug assertions being compiled for release.
Assertions are a well-known mechanism to assert conditions about the state of a running program, ensuring that at a given point in the program, certain preconditions must hold. For instance, assertions are often used to ensure that the content of an option-valued variable isn’t None at some point in the program. During testing, ensure that if this precondition isn’t satisfied, program execution is suspended as soon as possible. This avoids tracing back from the point where the undefined value of the variable would lead to an exception. The Assert method lets you specify a Boolean condition that must hold; otherwise, the given message is displayed, prompting the user with the failed assertion.
Both debug output and assertions are statements that typically are useful during program development, but when a release is made, these calls introduce unnecessary overhead. Often, the program compiled with these extra checks is called the checked version of the program. The .NET Framework designers devised a general mechanism to strip out the calls to methods under a particular condition with the help of the compiler. The ConditionalAttribute custom attribute is used to label methods whose calls are included in the program only if a given compilation symbol is defined; for the methods in the Debug type, it’s the DEBUG symbol. The F# compiler supports this mechanism, making it possible to use these tools to instrument the F# program in a way that is supported by the .NET infrastructure.
The Debugger type lets you check whether the program is attached to a debugger and to trigger a break if required. You can also programmatically launch the debugger using this type and send log messages to it. This type is used less often than the Debug type, but it may be useful if a bug arises only when there is no attached debugger. In this case, you can programmatically start the debugging process when needed.
Another mechanism that lets you control the interaction between a program and the debugger is based on a set of custom attributes in the System.Diagnostics namespace. Table 19-4 shows the attributes that control in part the behavior of the debugger.
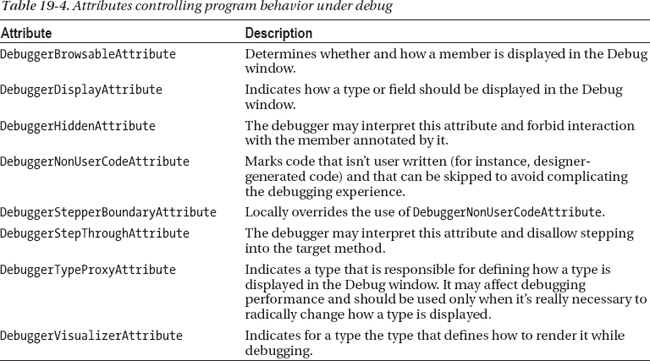
These attributes allow you to control two aspects of debugging: how data are visualized by the debugger and how the debugger should behave with respect to the visibility of members.
The ability to control how types are displayed by the debugger can help you produce customized views of data that may significantly help you inspect the program state in an aggregate view. The easiest way is to use DebuggerDisplayAttribute, which supports customizing the text associated with a value in the Debug window; an object of that type can still be inspected in every field. Consider the simple example:
open System


[<DebuggerDisplay("{re}+{im}i")>]

type MyComplex= {re : double; im : double}


let c = {re = 0.0; im = 0.0}

Console.WriteLine("{0}+{1}i", c.re, c.im)
Here, you introduce a record named MyComplex with the classic definition of a complex number. The DebuggerDisplayAttribute attribute is used to annotate the type so that the debugger displays its instances using the mathematical notation rather than just displaying the type name. The syntax allowed assumes that curly braces are used to indicate the name of a property whose value should be inserted in the format string. Figure 19-3 shows the result in the Visual Studio debugger: on the left is how the debugger window appears when MyComplex is without the DebuggerDisplay annotation; on the right, the custom string appears, with the properties in the string in curly braces. As you can see, the difference is in the value field, and the structure can still be inspected. You can use a custom visualizer to fully customize the appearance of the data in the debugger, but it may affect debugging performance.
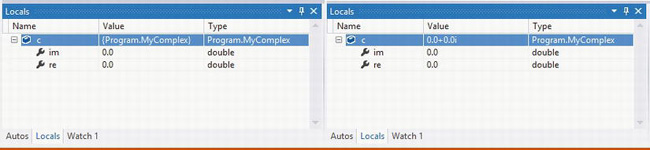
Figure 19-3. The MyComplex type shown by the debugger without and with DebuggerDisplay
Figure 19-3 is also interesting because it shows how the debugger displays information from the compiled program. In this case, the association between the name c and the runtime local variable has been lost, and the record appears because it has been compiled by the compiler as a pair of fields and public properties.
The rest of the namespace contains classes to interact with the runtime: the event-logging infrastructure, process, and thread management; and the representation of a thread’s stack. Stack manipulation can be useful if you need to know the call sequence that leads to executing a particular method. The StackTrace type exposes a list of StackFrame objects that provide information about each method call on the stack.
Debugging Concurrent and Graphical Applications
Although a debugger is a fundamental tool for inspecting applications, it isn’t the Holy Grail, and it must be used carefully: the process interferes with an application’s normal execution. The most relevant impact of the debugging process on a running program is the influence on execution timing, and graphical and concurrent programs are much more prevalent these days. Sometimes, a bug disappears while the debugger is being used, because of these changes in execution timing.
Debugging and testing concurrent applications can be particularly difficult, because using a debugger is guaranteed to alter execution timing. There is no general rule for debugging concurrent applications, but this section briefly discusses how you can use the debugger in these cases. Consider this simple example of a multithreaded application:
open System

open System.Threading


let t1 = Thread(fun () -> while true do printf "Thread 1
")

let t2 = Thread(fun () -> while true do printf "Thread 2
")


t1.Start(); t2.Start()
![]() Note: If you run this example in F# Interactive, you must abort the thread explicitly by calling the
Note: If you run this example in F# Interactive, you must abort the thread explicitly by calling the Abort method, right-clicking the F# Interactive window, and choosing Cancel Evaluation. If it doesn’t resume, you may have to kill the fsi.exe process that is using the CPU most. This is a common solution when a computation gets out of control during interactive sessions.
Threads t1 and t2 access the console, which is a shared resource; when you run the program without a debugger attached, the string printed by the two threads appears interleaved on the console. If you set a breakpoint on the two printf statements and start a debugging session, stepping automatically moves from one thread to the other; the output of the program is completely different from that obtained without debugging. This is true also if you disable the breakpoints. The output is even more unbalanced if you set the breakpoint in only one of the two threads.
Chapter 11 discussed shared-memory multithreaded applications. In such applications, shared objects accessed by different threads are critical resources that may be viewed in the debugger. If the debug of a single thread fails, setting breakpoints in different threads may help you study the dynamic of the application, even if the full interaction of the threads can’t be fully simulated. If this approach fails, it may be useful to introduce tests inside the application and use the Debugger type only when a given condition occurs. Channel-based message-passing applications are generally easier to debug than those that rely on shared memory, because you can monitor the communication end points using breakpoints or logging messages. Although careful use of the debugger may help when you’re debugging concurrent applications, sometimes, external observation is enough to influence a running program. In these cases, tracing through debug output becomes a viable alternative; large systems have different levels of traces to monitor program execution.
Graphical applications also present issues when you’re debugging. As discussed in Chapter 16, a GUI application’s event loop is handled by a single thread; if this is blocked, the application’s GUI ceases working while it’s suspended in the debugger. Consider the simple application:
open System

open System.Windows.Forms


let f = new Form(Text = "Hello world")

let b = new Button(Text = "Click me!", Dock = DockStyle.Fill)


b.Click.Add(fun _ ->

    b.Text <- "Click me again"

    MessageBox.Show("Hello world") |> ignore)


f.Controls.Add(b)

f.Show()

Application.Run(f)
If you set a breakpoint at the MessageBox statement and debug the application, when the button is clicked, the debugger suspends execution, and the form stops responding. The text of the button doesn’t change until execution resumes, because the thread suspended by the debugger is responsible for handling GUI events, including the paint event that refreshes the button’s content and updates the button label.
More specifically, event handlers can affect the appearance of a form in two ways: by setting properties of graphical controls and by explicitly drawing using a Graphics object. In the first case, the change isn’t noticed until execution resumes; the property change usually asks for a refresh of the control’s appearance, which eventually results in a paint event that must be processed by the thread that is suspended in the debugger. In the second case, updates are immediately visible when a statement involving drawing primitives is executed (unless double buffering has been enabled on the window).
For example, consider this program, which displays a window with a number of vertical lines:
open System

open System.Windows.Forms

open System.Drawing
let f = new Form(Text = "Hello world")


f.Paint.Add(fun args ->

    let g = args.Graphics


    for i = 0 to f.Width / 10 do

        g.DrawLine(Pens.Black, i * 10, 0, i * 10, f.Height))


f.Show()

Application.Run(f)
Set a breakpoint at the DrawLine statement and start debugging the application, moving the debugger window in order to make the application form visible. If you continue the execution one statement at a time, you can see the lines appear on the form. In this case, the interaction with the graphical system doesn’t trigger an event but interacts directly with the Graphics object by emitting graphic primitives that are rendered immediately.
This discussion of debugging graphical applications uses examples based on Windows Forms. The same considerations apply to all event systems in which a thread is responsible for event notification. For graphical systems such as WPF, based on the retention of graphic primitives, things work slightly differently, but there are analogous considerations.
Debugging and Testing with F# Interactive
Functional programming languages have traditionally addressed many debugging and testing issues through their ability to interactively evaluate program statements and print the values of variables, inspecting the program state interactively. F# Interactive allows you to execute code fragments and quickly test them; you can also inspect the state of the fsi script by querying values from the top level.
Development and testing using F# Interactive can effectively reduce development time, because you can evaluate code fragments more than once without having to recompile the entire system. The Visual Studio project system for F# makes this process even more productive, because code is edited in the development environment with type checking and IntelliSense; you can send code to F# Interactive by selecting it and pressing the Alt+Enter shortcut. In this scenario, the isPalindrome function from the previous section could have been developed incrementally and tested by invoking it with a test-input argument. After you found and fixed the issue, you could evaluate the function definition again and test it for further bugs.
During software development, it’s common practice to write simple programs to test specific features (the “Unit Testing” section discusses this topic more extensively). With F# Interactive, you can define tests as functions stored in a file and selectively evaluate them in Visual Studio. This approach can be useful in developing and defining new tests, but you can use more specific tools to run tests in a more systematic way.
Controlling F# Interactive
As you saw in Chapter 9, programs run in F# Interactive have access to an object called fsi that lets you control some aspects of the interactive execution. It’s contained in the assembly FSharp.Interactive.Settings.dll, which is automatically referenced in files ending with .fsx and in F# Interactive sessions.
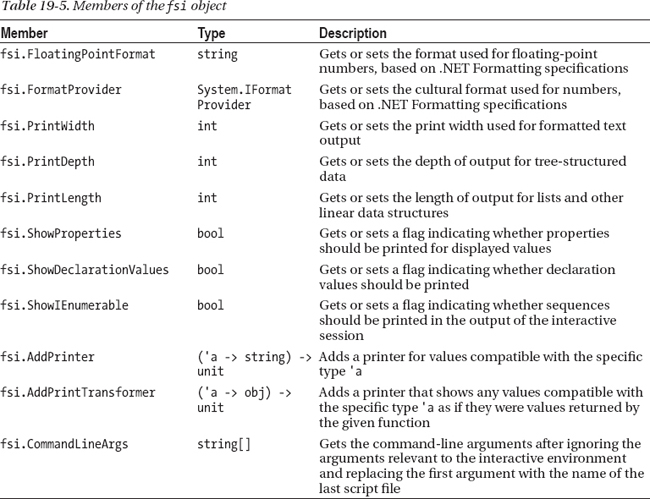
Table 19-5 shows some of the methods supported by this object.
Some Common F# Interactive Directives
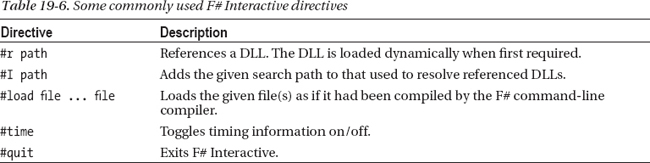
Table 19-6 shows several common directives accepted by F# Interactive, some of which correspond to options for the F# command-line compiler.
Understanding How F# Interactive Compiles Code
Although F# Interactive is reminiscent of the read-eval-print loops of interpreted languages, it’s substantially different, because it compiles code rather than interprets it. Whenever a code fragment is typed at the top level, it’s compiled on the fly as part of a dynamic assembly and evaluated for side effects. This is particularly important for types, because you can create new ones at the top level, and their dependencies may be tricky to understand fully.
Let’s start with an example of a nontrivial use of F# Interactive that shows these intricacies. You define the class APoint, which represents points using an angle and a radius:
type APoint(angle, radius) =

    member x.Angle = angle

    member x.Radius = radius

    new() = APoint(angle = 0.0, radius = 0.0)
If you create an instance of the class using F# Interactive, you can inspect the actual type by using the GetType method. The output is:
> let p = APoint();;

val p : APoint


> p.GetType();;

val it : System.Type =

  FSI_0004+APoint

    {Assembly = FSI-ASSEMBLY, Version=0.0.0.0, Culture=neutral, PublicKeyToken=null;

     AssemblyQualifiedName = "FSI_0004+APoint, FSI-ASSEMBLY, Version=0.0.0.0, ...}
Now, suppose you want to extend the APoint class with an additional member that stretches the point radius a given amount; it’s natural to type the new definition of the class into the top level and evaluate it. F# Interactive doesn’t complain about the redefinition of the type:
type APoint(angle, radius) =

    member x.Angle = angle

    member x.Radius = radius

    member x.Stretch (k : double) = APoint(angle = x.Angle, radius = x.Radius + k)

    new() = APoint(angle = 0.0, radius = 0.0)
Because you’ve redefined the structure of APoint, you may be tempted to invoke the stretch method on it, but doing so results in an error:
> p.Stretch(22.0);;

error FS0039: The field, constructor or member 'Stretch' is not defined
To understand what’s happening, create a new instance p2 of the class APoint and ask for the type:
> let p2 = APoint();;

val p2 : APoint


> p2.GetType();;

val it : System.Type =

  FSI_0007+APoint
    {Assembly = FSI-ASSEMBLY, Version=0.0.0.0, Culture=neutral, PublicKeyToken=null;

     AssemblyQualifiedName = "FSI_0007+APoint, FSI-ASSEMBLY, Version=0.0.0.0, ...}
As you can see, the name of p2’s type is FSI_0005+APoint, whereas p’s type is FSI_0002+APoint. Under the hood, F# Interactive compiles types into different modules to ensure that types can be redefined; it also ensures that the most recent definition of a type is used. The older definitions are still available, and their instances aren’t affected by the type redefinition.
Understanding the inner mechanisms of F# Interactive is useful when you use it to test F# programs, because interactive evaluation isn’t always equivalent to running code compiled using the command-line compiler. On the other hand, the compiled nature of the system guarantees that the code executed by F# Interactive performs as well as compiled code.
F# Interactive and Visual Studio
The relation between Visual Studio and F# Interactive is different from typical Visual Studio add-ins. It’s useful to understand, because the state of an F# Interactive session is separate from the Visual Studio state and can affect the process of testing and debugging in many subtle ways. You can also manage external resources through .NET and COM interfaces, including automating Visual Studio tasks, but accessing its interfaces is less easy than it may appear at first.
F# Interactive is a Visual Studio tool window2 that lets you interact with an fsi.exe process like a standard console. You communicate with the fsi.exe process using standard streams. This design choice ensures that a code mistake that causes the F# Interactive to hang doesn’t affect the Visual Studio editor that contains the data. You can restart F# Interactive from the tool window and obtain a fresh new instance without having to restart Visual Studio.
Restarting F# Interactive during testing and debugging ensures a clean environment. Consider, for example, a class whose instances open the same file. During a test, the file may be locked by an instance and become inaccessible due to variable redefinition; at some point, the garbage collector runs the finalizer and may close the file, slowing the iterative process of testing with F# Interactive. Sometimes, redefinition causes problems too: a class definition may be evaluated before you make additional changes, and the interface may then behave differently than the one in the program editor; you may continue to evaluate code that refers to the older version. In these cases, restarting F# Interactive is an option, and it returns you to a clean state.
Using Visual Studio automation, you can use F# Interactive to access objects exposing functionalities of the programming environment. The DTE and the DTE2 interfaces are the entry points to the entire Visual Studio object model. For instance, you can print the full path of the active document window:
#r @"EnvDTE.dll"

#r @"EnvDTE80.dll"

open System.Runtime.InteropServices

let appObj = Marshal.GetActiveObject("VisualStudio.DTE") :?> EnvDTE80.DTE2

printfn "%s" (appObj.ActiveDocument.FullName)
You use the GetActiveObject method to obtain a reference to the Visual Studio object model, and then you use the .NET assembly containing the interface generated from the COM types to access the object model. In this example, you connect to a running instance of Visual Studio (usually the first one started), not necessarily the same one associated with the F# Interactive executing the code. To attach to a specific instance of Visual Studio, you need to access the COM Running Object Table and associate it with the desired instance.
__________
2Tool windows in Visual Studio are dockable, like the Solution Explorer window.
Using Visual Studio automation, you can automate several tasks during testing and debugging, including building temporary configurations within Visual Studio for testing purposes. Manipulation of Visual Studio elements isn’t restricted to F# projects, but it can affect any area also affected by the macro system.
Testing Your Code
Anecdotal evidence indicates that functional programming frequently leads to a substantially reduced bug rate for good programmers. This is primarily because programs built using functional techniques tend to be highly compositional, building correct programs out of correct building blocks. The functional programming style avoids or substantially reduces the use of side effects in the program, one property that makes programs more compositional. Debugging and testing, however, are still essential activities to ensure that a program is as close as possible to its specifications. Bugs and misbehaviors are facts of life, and F# programmers must learn techniques to find and remove them.
As a result, software testing is important when you’re developing large systems. Tests are initially carried out by writing small programs and interactively running them, but a larger infrastructure quickly becomes necessary as a system grows and as new functionalities must preserve the existing ones. This chapter discusses how you can perform testing with F# using F# Interactive, using the debugging facilities provided by Visual Studio and the .NET infrastructure, and using the NUnit framework for unit testing.
A widely adopted debugging technique is the “do-it-yourself-by-augmenting-your-program-with-printf” approach. This technique suffers from several problems, however; although it’s useful, it shouldn’t be the only technique you’re prepared to apply to the complexities associated with program testing and debugging.
You can use several strategies to test programs and ensure that they behave as expected. The testing theory developed by software engineering has introduced several techniques used every day in software development. This chapter focuses on three aspects of program debugging and testing with F#:
- Using the Visual Studio debugger and the .NET debugging framework
- Using F# Interactive for testing and debugging
- Doing unit testing using NUnit, a freely available framework for unit testing
Alternative tools for debugging and unit testing are available; these include the .NET debugger that ships with the .NET Framework and the testing framework included in some Visual Studio flavors. The concepts behind these tools are similar to those presented here, and the techniques discussed in this chapter can be easily adapted when using them. All these techniques and tools are very helpful, but remember that these are just tools, and you must use them in the appropriate way.
Software testing is an important task in software development; its goal is to ensure that a program or a library behaves according to the system specifications. It’s a significant area of software-engineering research, and tools have been developed to support increasing efforts in software verification. Among a large number of testing strategies, unit testing has rapidly become popular because of the software tools used to support this strategy. The core idea behind this approach involves writing small programs to test single features of a system during development. When bugs are found, new unit tests are added to ensure that a particular bug doesn’t occur again. Recently, it’s been proposed that testing should drive software development, because tests can be used to check new code and later to conduct regression tests, ensuring that new features don’t affect existing ones.
This section discusses how you can develop unit tests in F# using the freely available NUnit tool (www.nunit.com). The tool was inspired by JUnit, a unit-testing suite for the Java programming language, but the programming interface has been redesigned to take advantage of the extensible metadata that the CLR provides by means of custom attributes.
Let’s start with an example and develop a very simple test suite for the isPalindrome function. The first choice you face is whether tests should be embedded in the application. If you create tests as a separated application, you can invoke only the public interface of your software; features internal to the software can’t be tested directly. On the other hand, if you embed unit tests in the program, you introduce a dependency from the nunit.framework.dll assembly, and the unit tests are available at runtime even where they aren’t needed. Because the NUnit approach is based on custom attributes, performance isn’t affected in either case. If you use tests during program development, it’s more convenient to define them inside the program; in this case, conditional compilation may help to include them only in checked builds.
Listing 19-1 shows a test fixture for the isPalindrome function—that is, a set of unit tests. Test fixtures are represented by a class annotated with the TestFixture custom attribute; tests are instance methods with the signature unit -> unit and annotated with the Test custom attribute. Inside a test case, you use methods of the Assert class to test conditions that must be satisfied during the test. If one of these fails, the entire test is considered a failure, and it’s reported to the user by the tool that coordinates test execution.
Listing 19-1. A test fixture for the isPalindrome function
open System

open NUnit.Framework

open IsPalindrome
[<TestFixture>]

type Test() =


    let posTests(strings) =

        for s in strings do

            Assert.That(isPalindrome s, Is.True,

                          sprintf "isPalindrome("%s") must return true" s)


    let negTests(strings) =

        for s in strings do

            Assert.That(isPalindrome s, Is.False,

                           sprintf "isPalindrome("%s") must return false" s)


    [<Test>]

    member x.EmptyString () =

        Assert.That(isPalindrome(""), Is.True,

                      "isPalindrome must return true on an empty string")


    [<Test>]

    member x.SingleChar () = posTests ["a"]


    [<Test>]

    member x.EvenPalindrome () = posTests ["aa"; "abba"; "abaaba"]


    [<Test>]

    member x.OddPalindrome () = posTests ["aba"; "abbba"; "abababa"]


    [<Test>]

    member x.WrongString () = negTests ["as"; "F# is wonderful"; "Nice"]
Test units are methods that invoke objects of the program and test return values to be sure their behavior conforms to the specification. This example also introduces the posTests and negTests functions used in several tests.
Developing unit tests is a matter of defining types containing the tests. Although you can write a single test for a program, it’s a good idea to have many small tests that check various features and different inputs. In this case, you introduce five tests: one for each significant input to the function. You could develop a single test containing all the code used for the individual tests, but, as you see shortly, doing so would reduce the test suite’s ability to spot problems in the program. In general, the choice of the test suite’s granularity for a program is up to you; it’s a matter of finding a reasonable tradeoff between having a large number of unit tests checking very specific conditions and having a small number of unit tests checking broader areas of the program.
To compile the project, you must reference the nunit.framework.dll assembly. After the program has been compiled, you can start NUnit and open the executable.
As shown in Figure 19-4, the assembly containing the unit tests is inspected using the CLR’s reflection capabilities, classes annotated with the TestFixture attribute are identified by NUnit, and searched-for methods are annotated with the Test attribute. Initially, all the fixtures and the tests are marked with gray dots. When you run tests, the dot is colored green or red depending on the outcome of the particular test.
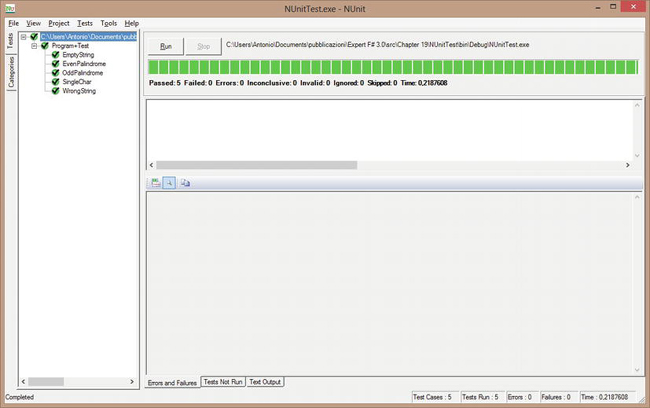
Figure 19-4. Test unit of isPalindrome executed in NUnit
If you reintroduce the original bug in the isPalindrome function and run NUnit again, EmptyString and EvenPalindrome fail, the corresponding dots are marked red, and the Errors and Failures tabs contain details about the test failure. This is the main benefit of having a large number of small unit tests: tools can run them automatically to identify problems in a program as well as the area potentially involved in the problem. Even in this simple example, a single test for the entire function would indicate the problem with the function, although it would fail to spot the kind of input responsible for the issue.
Like every other piece of software, unit tests must be maintained, documented, and updated to follow the evolution of the software for which they’re designed. The number of test cases, organized in fixtures, tends to grow with the system during development, and a large system may have thousands of these tests. Tools such as NUnit have features to control tests, and they allow you to run subsets of the entire set of test cases for a system. Test fixtures are a form of grouping: a test suite may contain different test fixtures that may group test cases for different aspects to be tested.
NUnit features a number of additional attributes to support the documentation and classification of test cases and test fixtures. The Description attribute lets you associate a description with annotated test fixtures and test cases. You can use the Category and Culture attributes to associate a category and a culture string with test fixtures and test cases; in addition, to provide more information about tests, NUnit lets you filter tests to be run using the content of the attributes. The ability to select the tests that must be run is important, because running all tests for a system may require a significant amount of time. Other mechanisms to control the execution of tests are offered by the Ignore and Explicit attributes; you can use the former to disable a test fixture for a period without having to remove all the annotations, and the latter indicates that a test case or a fixture should only be run explicitly.
Another important aspect of testing nontrivial software is the test fixture’s life cycle. Test cases are instance methods of a class; and with a simple experiment, you can easily find that NUnit creates an instance of the class and runs all the tests it contains. To verify this, it’s enough to define a counter field in the class annotated as a fixture and update its value every time a test is run; the value of the counter is incremented for each test in the suite. Although you may rely on the standard life cycle of the class, NUnit provides additional annotations to indicate the code that must be run to set up a fixture and the corresponding code to free the resources at the end of the test. You can also define a pair of methods that are run before and after each test case. The TestFixtureSetUp and TestFixtureTearDown attributes annotate methods to set up and free a fixture; SetUp and TearDown are the attributes for the corresponding test cases.
Listing 19-2 shows a test fixture for the isPalindrome function that includes most of the attributes discussed and one test case.3 You mark the category of this test case as a “special case.” You also include a description for each test case and the methods invoked before and after the fixture and single-test cases are run. NUnit’s graphical interface includes a tab that reports the output sent to the console; when tests run, the output shows the invocation sequence of the setup and teardown methods.
Listing 19-2. A Refined Test Fixture for the isPalindrome Function
open System

open NUnit.Framework


[<TestFixture;

  Description("Test fixture for the isPalindrome function")>]

type Test() =

    [<TestFixtureSetUp>]

    member x.InitTestFixture () =

        printfn "Before running Fixture"


    [<TestFixtureTearDown>]

    member x.DoneTestFixture () =

        printfn "After running Fixture"


    [<SetUp>]

    member x.InitTest () =

        printfn "Before running test"


    [<TearDown>]

    member x.DoneTest () =

        Console.WriteLine("After running test")


    [<Test;

      Category("Special case");

      Description("An empty string is palindrome")>]

    member x.EmptyString () =

        Assert.That(isPalindrome(""), Is.True,

                      "isPalindrome must return true on an empty string")
The ability to set up resources for test cases may introduce problems during unit testing. In particular, you must treat the setup and teardown methods of test fixtures carefully, because the state shared by different test cases may affect the way they execute. Suppose, for instance, that a file is open during the setup of a fixture. This may save time, because the file is opened only once and not for each test case. If a test case fails and the file is closed, subsequent tests may fail, because they assume that the file has been opened during the fixture’s setup. Nevertheless, in some situations, preloading resources only once for a fixture may save significant time.
__________
3To run the example, you must include the definition of the isPalindrome function.
NUnit comes with two versions of the tool: one displaying the graphical interface shown in Figure 19-4, and a console version that prints results to the console. Both versions are useful: the windowed application is handy to produce reports about tests and interactively control test processing, and the console version can be used to include the test process in a chain of commands invoked via scripts. Also, other programs can read the tool’s output to automate tasks after unit tests. Many command-line arguments are available in the console version to specify all the options available, including test filtering based on categories.
When a unit test fails, you must set up a debugging session to check the application state and the reason for the failure. You can debug tests with the Visual Studio debugger by configuring the Debug tab in the project properties in a similar way, as shown in Figure 19-5. After it’s configured, you can set breakpoints in the code and start the debugging session, attach the debugger to nunit-agent.exe process, and start the tests. This is important when code development is driven by tests, because new features can be implemented alongside test cases. It’s a good way to capitalize on the small test programs that developers frequently write: these small programs become test cases and can be collected without having to develop a new test program each time.
The example shown in Figure 19-5 passes a single argument to nunit-console.exe, the assembly containing the tests to be executed. You can also specify an additional argument to filter the tests that must be run. In this example, if you set a breakpoint in one of the test cases annotated explicitly, the debugger doesn’t stop, because by default, these tests are skipped.
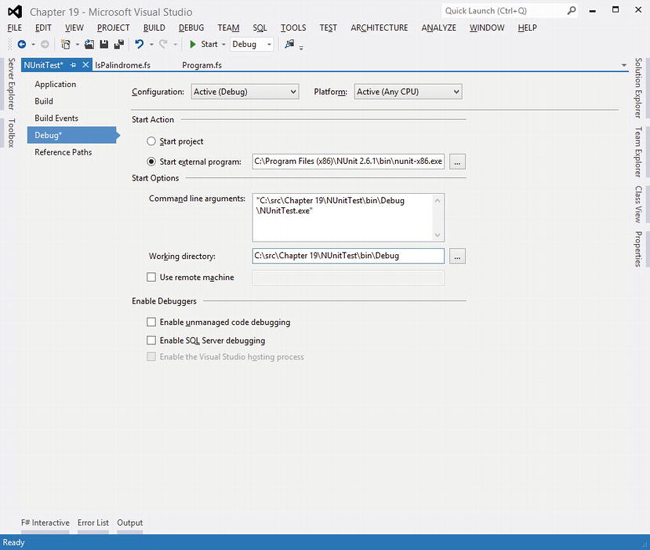
Figure 19-5. Configuring an F# project for debugging NUnit test fixtures
![]() Note: This section shows how you can use NUnit to define test cases using F#. NUnit isn’t the only tool for unit testing that’s available for .NET, however. For example, Visual Studio includes powerful unit-testing tools.
Note: This section shows how you can use NUnit to define test cases using F#. NUnit isn’t the only tool for unit testing that’s available for .NET, however. For example, Visual Studio includes powerful unit-testing tools.
Summary
This chapter introduced techniques and tools you can use to package, debug, and test F# programs, and it also gave an overview of some of the libraries available for use with F# code. Many, many other libraries are available for .NET, and we couldn’t possibly cover them in a single book. Many design patterns that you’ve seen here recur in those libraries; after you get to know the libraries discussed here, you’ll find that other libraries are easy to use.
The final chapter covers another set of software engineering issues for F# code: library design in the context of F# and .NET.