20
Stock Returns Information from the Stock Options Market
By Swastik Tiwari
In finance, an option is a financial derivative that represents a contract sold by one party (option writer) to another party (option holder), which gives the buyer the right, but not the obligation, to buy or sell an underlying asset or instrument at a specified strike price, on or before a specified date. The seller has the corresponding obligation to fulfill the transaction – that is to sell or buy – if the option holder “exercises” the option. The buyer pays a premium to the seller for this right. Call options give the option to buy at a certain price, so the buyer would want the underlying asset to go up in price. Put options give the option to sell at a certain price, so the buyer would want the underlying asset or instrument to go down in price. Speculators use options to take leveraged speculative bets on the underlying, while hedgers use options to reduce the risk of holding an asset.
There are currently 12 options markets in the United States, run by Nasdaq OMX Group, BATS Global Markets, Deutsche Boerse’s ISE unit, TMX Group’s BOX Options Exchange, Miami International Holdings Inc., Intercontinental Exchange Inc.’s NYSE unit, and CBOE Holdings Inc. Equity options are becoming increasingly popular with both retail and institutional investors.
The Options Clearing Corporation (OCC) in its 2013 annual report presents the following statistics and charts (Figures 20.1–20.3)1:
- OPTIONS VOLUME
- OCC TOTAL OPTIONS CONTRACTS 4,111,275,659
- Equity 3,725,864,134 90.63%
- Index/Other 385,411,525 9.37%

Figure 20.1 Options cleared and daily contract volumes 2009–2013
Source: The Options Clearing Corporation 2013 Annual Report, OCC Chicago, Illinois. Page 14. Licensed from the Options Clearing Corporation. All Rights Reserved. The OCC or it's affiliates shall not be responsible for content contained in this book, or other materials not provided by the OCC. The OCC does not guarantee the accuracy, adequacy, completeness or availability of information and is not responsible for errors or omissions or for the results obtained from the use of such information.

Figure 20.2 Options daily call and put volumes 2009–2013
Source: The Options Clearing Corporation 2013 Annual Report, 86 OCC Chicago, Illinois. Page 14. Licensed from the Options Clearing Corporation. All Rights Reserved. The OCC or it's affiliates shall not be responsible for content contained in this book, or other materials not provided by the OCC. The OCC does not guarantee the accuracy, adequacy, completeness or availability of information and is not responsible for errors or omissions or for the results obtained from the use of such information.

Figure 20.3 Options open interest and contracts exercised 2009–2013
Source: The Options Clearing Corporation 2013 Annual Report, OCC Chicago, Illinois. Page 15. Licensed from the Options Clearing Corporation. All Rights Reserved. The OCC or it's affiliates shall not be responsible for content contained in this book, or other materials not provided by the OCC. The OCC does not guarantee the accuracy, adequacy, completeness or availability of information and is not responsible for errors or omissions or for the results obtained from the use of such information.
The NASDAQ website2 in its February 2015 update presents Figure 20.4 on Options Market Share in the US.

Figure 20.4 Options Market Share in the US February 2015
Source: Chart taken from NasdaqTrader.com, http://www.nasdaqtrader.com/trader.aspx?id=marketsharenom.
The equity options market carries a lot of useful information for predicting stock returns. Equity options contribute to price discovery because they allow traders to better align their strategies with the sign and magnitude of their information. The leverage in equity options, combined with this alignment, creates additional incentives to generate private information. In this way, trades in equity options may provide more refined and precise signals of the underlying asset’s value than trades of the asset itself. Understanding how and why equity options affect price discovery is therefore vital to understanding how information comes to be in asset prices.
VOLATILITY SKEW
A useful source of such information is the implied volatility of stock options. Implied volatility of an option contract is that value of the volatility of the underlying instrument, which, when input in an option pricing model (such as Black-Scholes), will return a theoretical value equal to the current market price of the option. In case of equity options, a plot of implied volatility against the strike price gives a skewed surface. Volatility skew is the difference in implied volatility between out-of-the-money, at-the-money, and in-the-money options. Volatility skew is affected by sentiment and the supply/demand relationship, and provides information on whether fund managers prefer to write calls or puts. In equity options markets, a skew occurs because money managers usually prefer to write call options over put options, as can be seen in Figure 20.5.
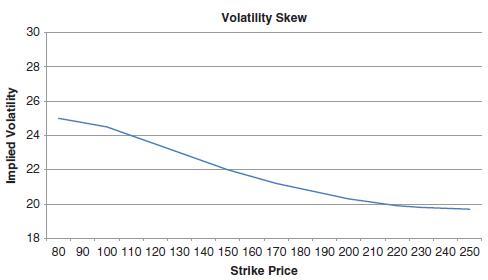
Figure 20.5 Sample volatility skew in equity options markets
In their paper “Option Prices Leading Equity Prices: Do Option Traders Have an Information Advantage,” Jin et al. (2012) mention the various past researches in this direction, like Bollen and Whaley (2004), Garleanu et al. (2009), Van Buskirk (2011), Xing et al. (2010), and Bradshaw et al. (2010). Bollen and Whaley (2004) and Garleanu et al. (2009) attribute the “shape of observed volatility skew and its predictive ability to the buying pressure due to the information possessed by option traders.” Bollen and Whaley (2004) find that “contemporaneous changes in daily implied volatilities are driven by changes in net buying pressure.” The option traders with knowledge of positive news create an excess of “buy call” trades and/or “sell put” trades, which causes the prices and implied volatilities of call options, relative to put options, to rise. Similarly, the option traders with knowledge of negative news create an excess of “sell call” trades and/or “buy put” trades, which causes the prices and implied volatilities of put options, relative to call options, to rise. Thus, when option traders obtain information about the possibility of an occurrence of a negative event, the demand for out-of-the-money put options increases relative to the demand for at-the-money call options, thereby increasing the volatility skew. It has been shown by researchers that there is a negative association between volatility skews and returns in the stock market at the firm level. This finding is consistent with the volatility skews reflecting negative information. Xing et al. (2010) state that “greater the volatility skew in the traded options of the stock, higher the underperformance.” They document the underperformance of underlying stocks of options with higher skews vis-à-vis those of underlying stocks of options with least skews at 10.9% per year on a risk-adjusted basis. There are a few recent studies focused on the predictive ability of volatility skews for extreme negative events. Van Buskirk (2011) finds that high-volatility skews predict negative jumps in short windows containing earnings announcements, and in longer windows containing no earnings announcements, but do not predict negative jumps around management earnings forecasts or dividend declarations. Bradshaw et al. (2010) show that the “predictive abilities of volatility skews and accounting opacity for crash risks are incremental to each other.” According to the authors, while the information advantage as reflected in the predictive ability of volatility skews is greater for negative news than for positive news, the predictive ability of the option market actually applies to news of different potential impactfullness.
VOLATILITY SPREAD
The call–put parity relation states that, in perfect markets, the following equality holds for European options on non-dividend paying stocks:
C – P = S – D.K
where C and P are the current call and put prices, respectively, D is the discount factor, K the strike price, and S the spot price. For American options, which allow early exercise, the equation takes the form of an inequality, S ≥ D.K + C – P. From these relations it can be shown that European call and put options, with the same strike price and maturity date, should have the same implied volatilities, while the American call and put options should have a spread in the implied volatilities (“volatility spread”) attributable to the early exercise premium (see Hull, 2008).
However, Ofek et al. (2004) document that the “volatility spread” can’t entirely be explained by the early exercise premium. Ofek et al. (2004) and Cremers and Weinbaum (2010) show that this volatility spread predicts future stock returns. For example, Cremers and Weinbaum (2010) find the outperformance of stocks with high-volatility spreads over those with low-volatility spreads by 50 basis points per week. Bollen and Whaley (2004) and Garleanu et al. (2009) attribute the “predictive ability of volatility spreads to the demand-based option models.” Higher volatility spreads suggest greater excess demands for call options than for put options, which is indicative of option traders obtaining information about positive news. Thus, volatility spread can be considered as indicative of the nature (positive or negative) and potential impactfullness of the news in possession of the options traders, by capturing the overall net buying pressure in the options market.
OPTIONS TRADING VOLUME
The trading volumes of the options on stocks can also carry useful information about the future stock returns. In their paper, “The Option to Stock Volume Ratio and Future Returns,” the authors Johnson and So (2011) focus on the inferences that can be made from trading volumes of options and underlying stocks. The authors provide theoretical and empirical evidence that O/S, the ratio of total option market volume (aggregated across calls and puts) to total equity market volume, is indicative of the private information with the informed traders. The O/S measure was first coined and studied by Roll et al. (2009), whose findings suggest that “cross-sectional and time-series variation in O/S may be driven by the trades of informed traders in possession of private information.” As an extension of these findings, the authors Johnson and So (2011), in “The Option to Stock Volume Ratio and Future Returns,” examine the relationship between O/S and future returns, and find outperformance of low O/S firms over high O/S firms. Their methodology involves sorting firms every month end by O/S and computing the average return of a portfolio consisting of a short position in high O/S stocks and a long position low O/S stocks. They then hold this portfolio for one month. This portfolio provides an average risk-adjusted monthly hedge return of 1.47%. The authors attribute the negative relationship between O/S and future equity returns to short-sale costs in equity markets – due to capital constraints and equity short-sale costs, informed traders prefer to trade options more frequently when in possession of negative news than positive news.
According to the authors, “O/S predicts earnings surprises, standardized unexplained earnings, and abnormal returns at quarterly earnings announcements in the following month.” The same O/S measure-based portfolio construction methodology also contains information about future earnings announcements that occur in the month subsequent to the “holding month.” They claim that this is consistent with O/S reflecting private information that is incorporated into equity prices when the news became public.
Furthermore, they state that their “model also predicts that O/S is a stronger signal when short-sale costs are high or option leverage is low,” all of which they confirm in the data.
OPTIONS OPEN INTEREST
Open interest represents the number of outstanding contracts for an option. In their paper, “Do Option Open-Interest Changes Foreshadow Future Equity Returns?”, Fodor et al. (2010) examine the relationship between option open-interest changes and future returns. They show that option traders buy relatively more (fewer) call (put) options when they are near term bullish on the underlying asset. Similarly, option traders buy relatively more (fewer) put (call) options when they are near term bearish on the underlying asset. This behavior leads to changes in aggregate open interest having information content about future equity returns. They claim that the informed investors leverage their bullish (bearish) views through increased long call (put) positions.
In their empirical investigation, the authors demonstrate a strong negative relationship between recent changes in aggregate put open-interest levels and the future underlying equity returns. Firms with increases in recent put open interest greatly underperform firms with decrease in put open interest. The authors find that the opposite but much weaker relationship exists in cases of call open-interest changes. They then go on to find the ratio of the recent changes in call open interest to put open interest is the most effective predictor of future equity returns, and that this relationship is positive in the sense that large increases in the ratio are followed by relatively strong future equity returns.
The authors Fodor et al. (2010) demonstrate the documented preference of informed traders, as first discussed by Black (1975), to leverage their views through options (bullish views through long call positions and bearish views through long put positions) due to relatively small initial outlay requirements. Fodor et al. (2010) present further evidence that the real-world informational differences between the options and equity markets result in differences in the speeds at which information gets incorporated into the prices.