13
Risk and Drawdowns
By Hammad Khan
Risk can be defined in various ways. Measurement of risk of an alpha can simply be done by the level of volatility of its returns and the expected value at risk (which is a measure of maximum potential loss the alpha can incur given a statistical confidence level). Risk can be measured with certainty after the fact. But risk can be anticipated for an alpha with some simple techniques.
- Position concentration in a particular security or a group of securities. For example, in equities, if an alpha takes too many positions in a particular security or a particular sector or industry, we can anticipate that the alpha is taking a high risk if something systematic happens to that security or group of securities. Similarly, in futures, if there are too many positions taken in commodities or bonds or equity indices, there is a systematic risk that an alpha is taking. Such risk can be anticipated by knowing how much exposures an alpha is taking in such positions.
- Some alphas and alpha techniques are very commonly known and are used by many quantitative researchers and portfolio managers around the world. Such alphas – let’s call them factors – become a common source of risk because of a lot of money worldwide is riding on them. If performance in such factors degrades, funds may start flowing out of portfolios that are using them, which may cause further degradation in their performance. Any exposures to such factors can be measured by the position and performance correlation between an alpha and such factors, and hence can be anticipated. It may be worthwhile to point out that, in an in-sample period, an alpha may perform very well despite taking these known risks. But as long as an alpha is taking such risks, it is exposed to possible future performance degradation and surges in PnL volatility. Risk is a very vast topic in finance, and many books, papers, and research notes are written on it every year. Here we have only talked about the idea of risk very briefly in the context of designing alphas within the theme of this book.
Risk of any alpha or portfolio can be reduced by diversification. Having a larger universe of instruments increases diversification as long as position concentration is under control. For example, alphas constructed only on FTSE100 have lower diversification than the alphas constructed on the entire UK and European stocks. However, an important point to note with stock universe diversification is that as we expand the underlying universe, other risks can come into play. Such risks include exposure to various countries and currencies within the same alpha. These risks should be considered, appreciated, and sometimes mitigated by neutralizing. Similarly, using a range of instruments (e.g. futures, equities, bonds, etc.) will increase diversification.
An important point to note with risks is that any good alpha is trying to pick winners and losers to go long and short, respectively. But it will not always work with 100% accuracy. Let’s assume that an alpha is able to identify winners and losers, and these stocks continue their winning or losing streak for a long time. If that happens, the alpha gets exposed to a trend in these stocks. Sometimes it may be helpful to have a predetermined profit per trade, after which the alpha decreases the signal in that stock – instead of continuing that streak and eventually incurring a drawdown. Similarly, it is helpful to have a predetermined stop loss per trade in case the trade goes awfully wrong. These techniques are especially important if the universe is not wide enough.
DRAWDOWNS
A drawdown is the percentage loss of an alpha from its peak. For example, if since inception an alpha has made 20% returns and then from its peak it falls down in the next few days (or weeks) to 18% return, the drawdown is measured as 2%. Because every alpha will have up days and down days, there will be drawdowns in every alpha. What we usually concern ourselves with in a backtest are two important features:
- the largest drawdown the alpha has through its history (and in each year of its history);
- the duration of the largest drawdown.
While carrying out a backtest, these drawdowns should be measured in relation to other features of an alpha, e.g. its annualized return and its investment ratio. Sometimes a sudden drawdown can occur in an otherwise good alpha, and then the alpha starts behaving in the same consistent manner. In other cases, drawdowns can be slow and steady negative performance for many days before an alpha starts performing again. Of course, in a real alpha deployment or an out-of-sample test, we would not be able to know whether an alpha has stopped working when negative performance hits, or if this is just a drawdown that the alpha will come out of. Hence, it is important to measure the historic drawdowns in the in-sample period, and the duration of drawdowns. This provides us with a benchmark with which to measure the current performance.
If other measures are taken into account while designing an alpha (e.g. avoiding overfitting), attention should normally be paid to avoiding large drawdowns. The upside should take care of itself. Drawdowns are closely related to risk. Some of the simple techniques used to minimize drawdowns are closely tied to minimizing risk:
- Minimize the maximum exposure taken in any single security.
- Minimize the maximum exposure taken in any similar group of securities.
- Minimize the exposure to any commonly known alpha factors.
- Minimize the exposure to overall market, where the market can be a regional or global index, as an example.
While designing alphas, it is tempting to pay too much attention to returns and not that much to drawdowns. But employing simple techniques such as the ones above (and many others not given here), reducing the risks can lead to reduction of possible future drawdowns. You will note that reducing risk exposures will systematically reduce alpha performance as well (because some of the in-sample performance is driven by these very risks).
PERFORMANCE MEASURES FOR RISK AND ANTICIPATING DRAWDOWN
Another important point to note is performance concentration. It may happen that a lot of alpha performance is concentrated within a particular group of securities, despite limits on exposures. That could give rise to a potentially risky alpha in some respects. Consider an example: In an equities alpha with limits on sector exposures, most of the performance in an in-sample period comes from just the Energy and Information Technology sectors, and the rest of the sectors do not perform very well.
Figure 13.1 is an example of such an alpha.

Figure 13.1 Example of an equities alpha where performance is primarily driven by Energy and Information Technology sectors only
Though an overall in-sample performance may look very reasonable, the alpha may degrade and suffer from drawdowns if the alpha stops working on any one of the two sectors above. A good alpha should have its performance distributed across as many securities (or groups such as sectors) as equally as possible.
Figure 13.2 is an example.
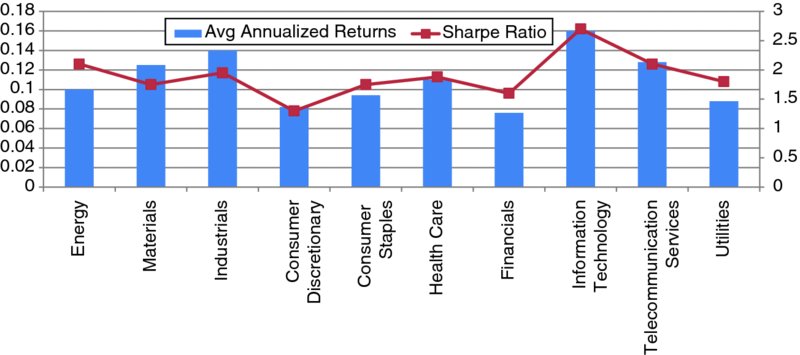
Figure 13.2 Example of an equities alpha where performance across all sectors is not too dissimilar
This should not, however, be taken as a rule when designing alphas specifically for a particular group of securities (e.g. some alphas are for a narrower universe of some sectors and industries).
Similarly, a researcher should check quintile performance of an alpha. The best way to test that is to divide alphas over quintiles, and find mean (and standard deviation) or returns coming from each quintile. What we expect of a good alpha is that the top quintile (mostly highly positive alphas) gives rise to highly positive future returns, and the bottom quintile (mostly highly negative alphas) gives rise to highly negative future returns. Other quintiles lie in a decreasing order of performance from the first to the last.
Figure 13.3 shows an example of an alpha quintile performance distribution that is desired.
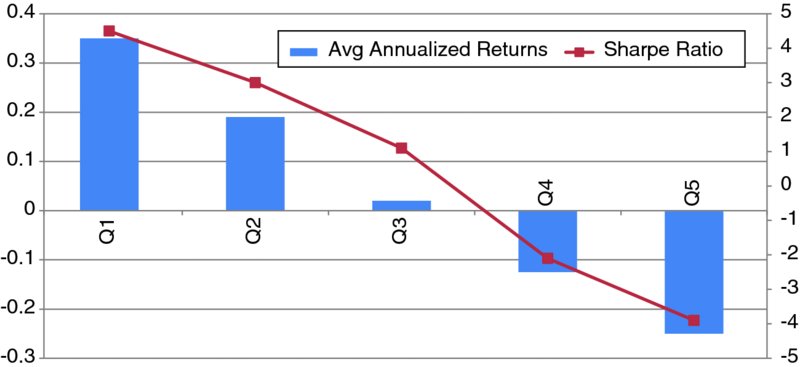
Figure 13.3 A desired quintile distribution of an alpha
What we may find in many alphas is that the performance may be coming from just the top or just the bottom quintile, and quintiles 2 to 4 are just noise.
Figure 13.4 is an example of such an alpha.

Figure 13.4 A quintile distribution where only tails of the alpha have the predictive power
Because such alphas have good predictive power only in tail cases, the actual breadth of performance decreases and the chances of drawdown increase if the tail information becomes less viable in the future. Since there’s no information in the central quintiles of such alphas, listening to the central quintiles would not be such a viable option. There are many examples of alphas that can be used only in tail cases. In some cases, we may find that the quintiles 2 to 4 systematically outperform quintile 1, or they systematically underperform quintile 5.
See Figures 13.5 and 13.6 as examples.
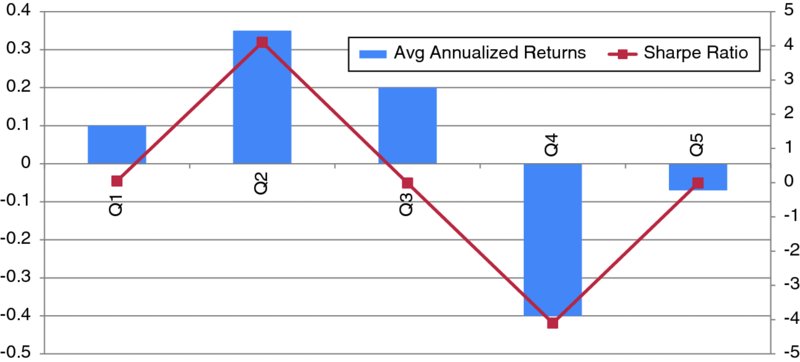
Figure 13.5 A quintile distribution where tails have less predictive power
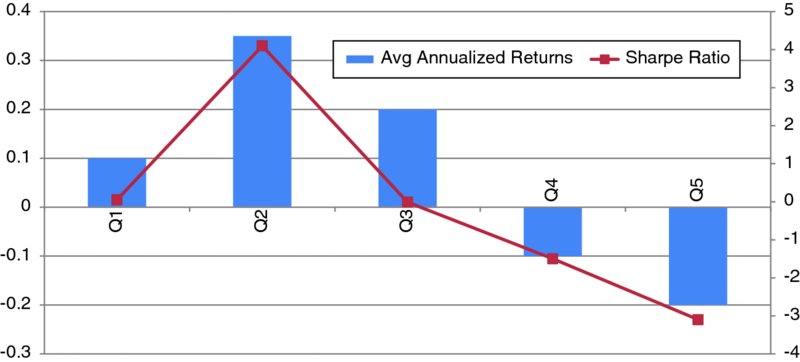
Figure 13.6 A quintile distribution where both second and third quintiles outperform the first quintile
Such cases reveal less power of the top (or bottom) quintiles versus other quintiles, and can lead to future degradation in performance because of lower tail predictive power.
SUMMARY
It is important to consider risks and drawdowns in an alpha design. In-sample performance charts and summary statistics only reveal part of the story of what is going on in an alpha. Correlations with known alpha factors, concentration of performances, and quintile performance distributions, can all help a researcher understand the sources of risk they are taking. While these tools help understand and anticipate the risks an alpha is taking, they can help in a better alpha design so as to enable researchers to reduce future drawdowns by constructing more alphas that adhere to the desired properties mentioned in this chapter.
