24
Introduction to Futures Trading
By Rohit Agarwal
Futures trading includes equity indices, commodities, currencies, and bonds.
An alpha is proportional to: (breadth of universe * depth of information). There are certainly a lot fewer instruments in the futures universe as compared to the equity universe – which means we need to do greater in-depth research to generate substantial alphas from them.
With futures, in contrast to equities, one property may not be comparable across the entire universe due to the diversity within the universe. This difficulty in generating alphas is compensated by the greater liquidity in these markets.
Here’s a look at the most interesting, prominent, and useful information or phenomenon monitored in futures trading.
COMMITMENT OF TRADERS REPORT BY THE COMMODITY FUTURES TRADING COMMISSION
The Commitment of Traders (COT) report (Figure 24.1) is released every Friday. It can be extremely valuable in knowing what the “smart money” is betting on, and then following it. The report gives us the open interest breakdown by different market participants, such as commercial traders (big businesses/producers), non-commercial traders (large speculators), and non-reportable traders (small speculators).
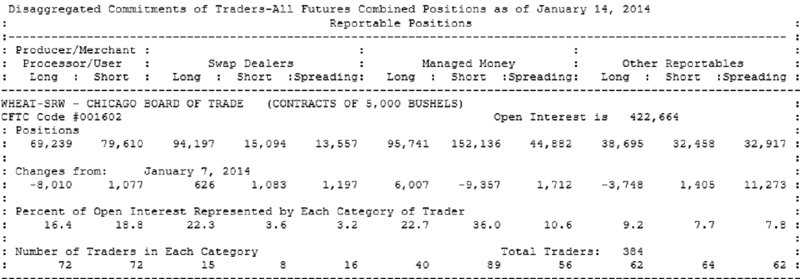
Figure 24.1 COT report of wheat for the week ending January 2014
Source: U.S. Commodity Futures Trading Association (Jan, 2014)
More about this report can be learned here:
http://www.cftc.gov/marketreports/commitmentsoftraders/index.htm
SEASONALITY IN MARKETS
Seasonality is the tendency of markets to move in a given direction at certain times of the year. It is a prominent behavior observed in agri-commodity markets due to weather cycles. But it is not restricted to just agri-commodities as it can be in play due to cyclical demand, consumption, inventory, or supply patterns as well.
Figure 24.2 shows the seasonality in natural gas reserves or inventory. As winter approaches, the demand for natural gas increases as inventory reduces due to its use in the heating of homes.
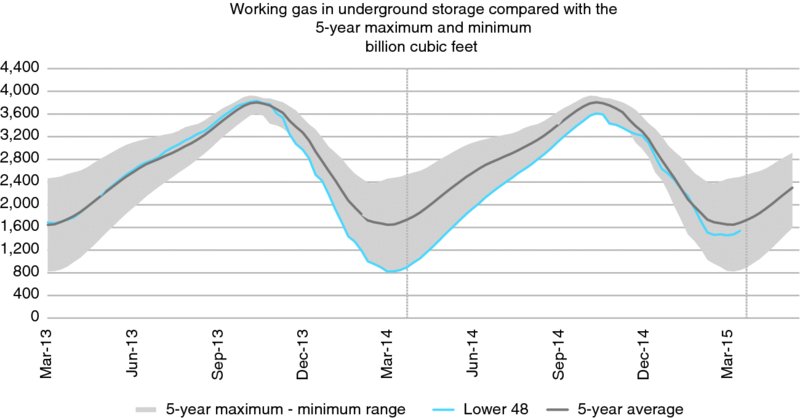
Figure 24.2 Working gas in underground storage compared with the 5-year maximum and minimum
Source: U.S. Energy Information Administration (July, 2014)
Past performance may not guarantee future results.
RISK ON AND RISK OFF
There are times when market sentiment is positive, and investors are optimistic and willing to take more risk in order to get better returns. Such an environment is called a “risk-on” market because risk taking is on. On the other hand, there are times when investors are pessimistic and try to cut risk by selling their positions in risky assets and moving money to cash positions or low-risk safe havens, like US Treasury bonds. These are called “risk-off” times (Figure 24.3).
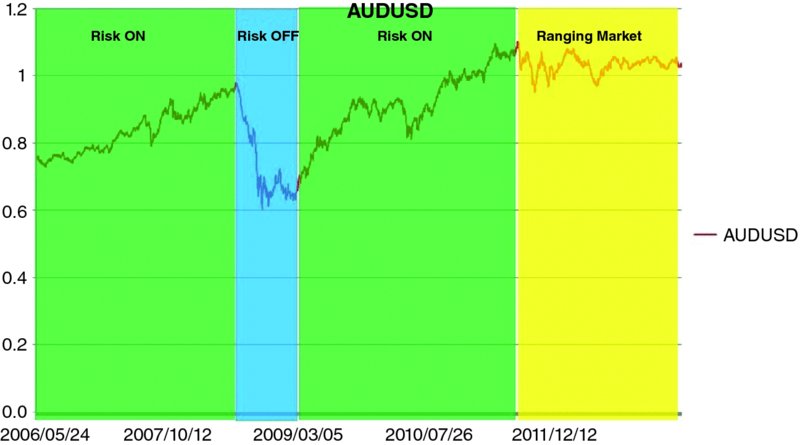
Figure 24.3 Risk-on/risk-off regimes on the AUD/USD price curve
This investor behavior – to flock toward assets perceived as risky during risk-on times, and assets perceived as risk-free during risk-off times – increases the correlation between different asset classes.
The steps to successfully construct risk-on/risk-off strategies include identifying whether the market is in a risk-on or risk-off regime on a daily/weekly/monthly/quarterly basis, and then categorizing different assets as risk-on assets or risk-off assets, and taking positions in them.
One such popular indicator of market risk perception is VIX (Figure 24.4), a volatility index constructed from the implied volatility of S&P 500 options. Traditionally, the correlation between price and volatility is negative for equities. Therefore, high or increasing VIX levels are associated with money moving out of equity markets into safer assets, announcing the arrival of a risk-off regime. VIX itself is a tradable futures instrument and used by many to benefit from falling markets.
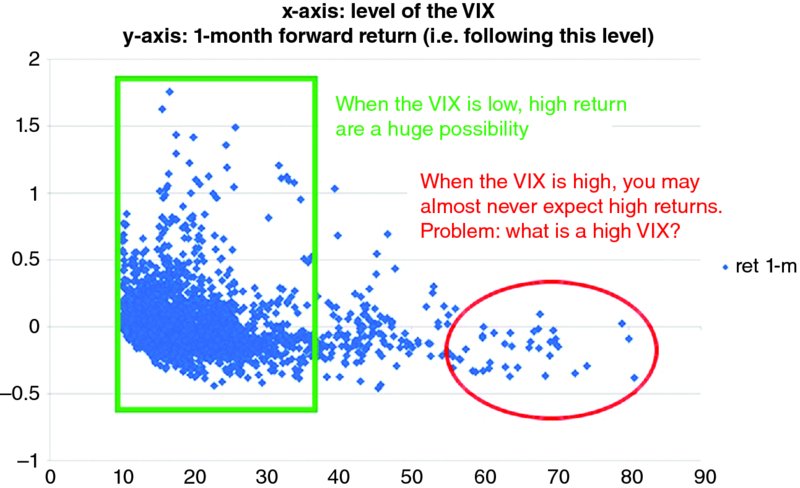
Figure 24.4 The distribution of market returns at different levels of VIX
CONTANGO/BACKWARDATION
When near-month futures are cheaper than farther expiries, it creates an upward sloping curve of prices, and the contract is said to be in contango (Figure 24.5). This effect can be attributed to commodity storage cost or cost of carry.

Figure 24.5 Cocoa distribution in contango
However, in some cases it is possible that near-month futures are more expensive than far-month futures, which creates a downward sloping curve and the contract is said to be in backwardation.
Some traders make money by selling contracts in contango and buying contracts in backwardation.
While these are some of the widely-researched topics in futures trading, the scope is vast and extends into many more territories.