8. Analysis Tool #5: Business Plan Analysis
If you were considering buying a local business, such as a bicycle shop, would you base your purchase decision entirely on how much money the seller said he or she made last year or on the seller’s profit forecast for this year?
I bet not. Instead, you’d probably want to know where the shop gets its bicycles, how much it pays for them, and whether the competition is paying the same prices.
You would check for alternative sources in case an important supplier goes out of business or decides to open its own outlet and stop selling to you. You’d also want to know something about your customers. Are they mostly individual consumers, or did one or two bicycle courier services account for a big hunk of last year’s purchases?
Most people would explore such topics if they were, in fact, thinking of buying a bicycle shop. Yet all too often, investors skip this vital step when analyzing a stock.
For evidence, consider the dot-com start-ups that each raised hundreds of millions of dollars from millions of investors, both amateur and professional. Many of them had nonsensical business plans with zero chance of success. For instance, at least one web retailer planned to, and actually did, sell every product at cost or less.
In this chapter, you’ll learn to analyze the pluses and minuses of your candidate’s business model. Many of the concepts presented were inspired by the ideas of Harvard Business School Professor Michael Porter, considered by many to be the guru of competitive analysis.
Introduction
Nothing attracts competition more than big profits. But no matter how strong the market looks in the beginning, the unimpeded entry of new players leads to supply exceeding demand and tumbling profit margins as players fight for market share. That’s why you need to consider a company’s competitive advantages, or barriers to entry, in your analysis.
Barriers to entry discourage new players from entering the market. Without sufficient barriers to entry, a company’s long-term success is problematic, because it will be easy for new competitors to enter the fray.
Barriers to entry can take many forms. The following sections describe some of the more common ones. You will uncover others when you analyze prospective candidates. A barrier to entry enjoyed by one company translates to a risk factor for its competition. Besides barriers to entry, every company’s business model embodies a variety of additional risk factors.
To streamline the analysis, I’ve combined similar barriers to entry and risk factors into single rating factors. Most of the factors can be considered either an advantage or a disadvantage, depending on the circumstances.
Use the Business Plan Scorecard provided near the end of this chapter to assess each candidate’s business model. Score each business plan factor as 1, −1, or 0, depending on whether you judge it to be an advantage, disadvantage, or not applicable, respectively.
Brand Identity
Many consumers will pay more for Nike shoes, a Sony TV, or an iPod than they would for lesser brands or generics. These products have achieved a combination of brand awareness and perceived superior quality in consumers’ minds. A strong brand identity often translates into higher selling prices and higher profit margins.
Hewlett Packard’s name is synonymous with computer printers, and HP enjoys a strong reputation for quality products. Those factors taken together equate to strong brand identity, explaining why HP printers outsell Lexmark by more than 5 to 1, even though Lexmark’s products may be as good as or better than HP’s.
As another example, consider the experiences of Oakley and Sunglass Hut. Oakley makes designer sunglasses, and Sunglass Hut, a retail chain, is the largest seller of designer sunglasses in the U.S. Back in 2001, Sunglass Hut was Oakley’s largest customer, accounting for 19 percent of its sales. Then, in mid-2001, Luxottica Group, an Italian firm, acquired Sunglass Hut. That created a problem for Oakley, because Luxottica already owned Ray-Ban, a competing sunglasses brand. Sure enough, Luxottica dropped Oakley’s products shortly after taking over Sunglass Hut.
But Sunglass Hut’s shoppers wanted Oakley, not Ray-Ban. By mid-December, the chain was once again stocking Oakley’s glasses, a testament to the power of the Oakley brand.
A strong brand identity gives its owner a competitive advantage and acts as a barrier to entry to new players. Give 1 point to companies with strong brand identities, and subtract 1 point for companies facing a competitor with strong brand identity.
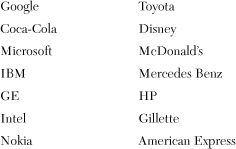
Here is a list of highly regarded U.S. brands based on information compiled from a variety of sources:

Other Barriers to Entry
You will uncover candidates with other barriers to entry in your analysis. Add 1 point for additional significant barriers to entry, and subtract 1 point from companies facing additional barriers. Add or subtract 1 point maximum for this category.
Distribution Model
In the early 1990s, PC makers Compaq and Dell were vying for market leadership. Although they offered similar products, the two companies had developed different distribution strategies.
Compaq adhered to the traditional model, selling to distributors that in turn sold to retail stores and systems builders. Compaq designed standard models, built them in bulk quantities, and warehoused the completed systems until it received orders. Each step of the process—building systems ahead of orders, warehousing, and selling through distributors and retailers—added costs.
Dell, in contrast, had no dealers, distributors, or warehouses stuffed with assembled computers. Instead, Dell allowed customers to pick and choose features, and then Dell built each computer to the buyer’s specifications. Dell undoubtedly incurred higher costs, because it was dealing with thousands of individual customers instead of a few distributors. But on balance, it was the lowest-cost producer because it didn’t have to pay for warehousing, and no middlemen were taking a cut. Dell’s unique distribution system enabled it to overtake Compaq’s once-commanding market share lead.
Eventually, Compaq floundered and was acquired by Hewlett Packard, but that’s not the end of the story.
In the mid-2000s, as the technology evolved, consumers switched en masse from desktop computers to notebooks. That change transformed Dell’s distribution strategy from an advantage into a liability. Here’s why.
Notebook computers, no matter the brand, are all mass-produced in factories in China and Taiwan. A particular model’s configuration is fixed—no customization can occur. Moreover, individual consumers became the most important market segment, whereas before it was large corporations. That was bad news for Dell, because many consumers prefer to buy notebooks in retail stores, where they can touch them and try them out before purchase.
Taken together, the switch to notebooks and the change in market demographics torpedoed Dell’s direct distribution strategy, and the firm began selling PCs to retail stores, taking away its competitive advantage.
You may never find situations as clear-cut as Dell versus Compaq, but be on the lookout for companies with similar operational advantages in areas such as order processing, production techniques, marketing, and the like. Score 1 for companies enjoying such operational advantages and −1 for firms facing competitors with distribution model advantages.
Access to Distribution
If you were to start a new rock band, you could post your videos on YouTube and, if you were lucky, build up a big following and eventually sell your CDs on the web.
Contrast that scenario to starting a new line of laundry detergents, which are mostly sold in supermarkets where shelf space is at a premium. There’s no room for a new detergent without eliminating an existing brand, and Procter & Gamble and its ilk deploy legions of salespeople to ensure that doesn’t happen.
Same thing for cell phones. Most consumers buy their phones from wireless carriers such as AT&T or Verizon. So, if you wanted to bring a new cell phone to market, you’d be limited to a handful of possible distributors.
Locked-up distribution channels represent a strong barrier to entry. Award 1 business model point to companies enjoying distribution channel advantages, and subtract 1 point from companies facing competitors with those advantages.
Product Useful Life/Product Price
Long product-life items such as automobiles, home entertainment systems, computers, and washing machines are discretionary purchases that can usually be put off. However, food, healthcare products, cigarettes, and office supplies are quickly used up, and inventories must be frequently replenished. For example, it’s unlikely that Bank of America stopped buying staples when it slashed spending to stay afloat in 2008 and 2009. Companies selling short-lived products have a business plan advantage.
This principle isn’t limited to consumer products. Cabot Microelectronics makes slurries, used in the semiconductor production process. Something like toothpaste, the slurries are used up in the process and must be continuously replenished. Consequently, despite the semiconductor industry ups and downs, as of the end of its September 2008 fiscal year, Cabot had grown sales 21 percent, on average, over the previous 10 years. In contrast, industry-leading chipmaker Intel had averaged only 4 percent annual growth over the same period.
Similarly, companies with inexpensive products have an advantage over companies with expensive products, especially in a weak economy. For instance, when times are tough, consumers put off buying a car or a new home, but they still buy breakfast cereal.
Award 1 point to companies with short-lived and/or low-priced products, and subtract 1 point from companies selling discretionary purchase products.
Access to Supply/Number of Suppliers
Most firms enjoy a choice of multiple vendors eager to supply needed services and materials. But sometimes you’ll encounter companies where that is not the case.
For example, in March 2005, nutritional oils supplier Martek Biosciences’ share price took a big hit after the company said problems at one of its sole supplier’s plants would cause April-quarter sales to come in 26 percent short of earlier forecasts.
In other instances, companies may have multiple suppliers but face an industry-wide shortage of critical components. That happened in 2006 when notebook PC makers suffered earnings shortfalls because problems at Sony triggered a battery shortage, and again in 2007 when LCD panels were in short supply. Solar panel makers experienced similar problems in 2007 when they couldn’t get enough polysilicon material.
Subtract 1 point from companies that face tight supply or allocated markets or that are dependent on only one or two suppliers.
Revenue Stream Predictability
It’s much easier to forecast a company’s future earnings if you have a good handle on its likely sales. Companies with long-term contracts or stable client bases have predictable revenue streams. Examples include health plans, credit card processors, telephone and cable TV companies, and utilities. Firms with predictable revenue streams suffer less year-to-year volatility in revenues, cash flow, and earnings than those that don’t.
Conversely, media companies and makers of designer clothing, sporting goods, durable goods (such as stoves), video games, semiconductors, computers, computer software, and cameras all have unpredictable revenue streams. Hence, their earnings are equally unpredictable.
Award 1 point to companies with predictable revenues, and subtract 1 point from companies with unpredictable revenue streams.
Number of Customers
Companies with just a few customers accounting for a majority of sales are vulnerable to shifts in the growth rates of their customers and/or changes in their customers’ strategies. Loss of a single customer to a competitor can severely impact a company’s performance.
Furthermore, an important customer can squeeze a supplier’s profit margins by insisting on lower prices. Suppliers to the cable TV, aircraft, and automobile industries fall into this category.
Give 1 point to companies with thousands of customers, and award 0 points to companies with a few hundred customers. Subtract 1 point if fewer than 10 customers account for 50 percent or more of the firm’s sales.
Product Cycle
The product cycle is how long a product is on the market before it’s replaced by a newer version. Companies with short product cycles—including women’s clothing makers, automobile companies, and most technology manufacturers—are riskier investments than those with long product cycles, such as candy makers. The short product cycle companies must continuously develop new products and run the risk of seeing their creations made obsolete by a hotshot new competitor.
Give 1 point to companies with long product cycle products, and subtract 1 point from makers of high-tech and other short-cycle products.
Product/Market Diversification
Firms offering just a single product line are riskier than companies with a variety of products, because something unforeseen can happen to unexpectedly kill the sales of almost any product.
Similarly, companies serving a single business segment—such as the automotive, construction, and energy industries—would suffer when those industries go into a downturn.
Firms producing multiple products serving a variety of markets are less susceptible to those sorts of mishaps and to economic downturns than less diversified companies.
Award 1 point to companies with multiple products serving diversified markets, and subtract 1 point from single-product or single-market firms.
Growth by Acquisition
In the beginning, most firms grow organically. Their growth comes from selling more products or opening new stores. Eventually growth slows as supply catches up with demand or new competition appears. When that happens, management must find new ways to sustain the growth rate; otherwise, the slowing growth will sink the firm’s stock price.
At that point, most firms develop new products or enter additional markets, but others turn to an acquisition strategy to maintain growth.
Growth by acquisition is an appealing strategy. Purchasing an established company already serving a market saves the acquirer the time and expense of learning the business and developing products from scratch. The process is relatively inexpensive because the acquirer often uses its own newly issued shares to pay for the acquisition.
The strategy is often successful early on, and the acquiring firm is able to maintain a strong growth rate, keeping the market happy and its share price up. The latter is important because the firm’s stock is the currency enabling the acquisitions.
Eventually, however, the numbers get too big. Consider the math. A company with $100 million in annual sales can achieve a 25 percent sales increase by acquiring a company selling $25 million annually. However, once it reaches the $200 million level, it must acquire $50 million in annual sales to maintain the same growth rate. Compounding the problem, the bigger it gets, the fewer the acquisition candidates.
Sooner or later, something goes wrong. Perhaps the acquirer overpays. Maybe the acquired company doesn’t perform to expectations, or expected cost-cutting synergies fail to materialize. Perhaps a clash between corporate cultures disenchants key employees in the acquired company, and they leave.
Whatever the cause, the serial acquirer fails to meet earnings growth forecasts, torpedoing its stock price. The lower stock price takes away its acquisition currency, further slowing growth and thereby putting more pressure on its share price. In essence, it’s game over!
Easy-to-Spot Serial Acquirers
When making an acquisition, the acquirer usually pays more than the accounting book value for the target firm. The difference between the purchase price and book value is added to either goodwill or intangibles on the acquirer’s balance sheet. The goodwill and intangibles totals will be close to 0 for firms that have never made any acquisitions.
Thus, you can gauge a firm’s acquisition history by comparing its goodwill and intangibles to its total assets. For brevity, call the result of dividing goodwill plus intangibles by total assets the GI/A ratio. The higher the ratio, the more acquisitive the firm.
Drugstore chains Walgreens and CVS afford a good example. Both are relatively fast-growing firms. Walgreens relies almost entirely on internal growth, while CVS depends mostly on acquisitions to increase sales.
According to their December 2008 balance sheets, Walgreens’ GI/A ratio was 5 percent, compared to 59 percent for CVS.
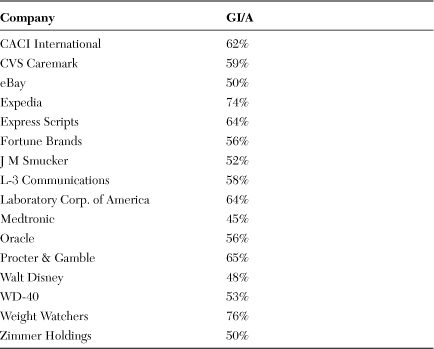
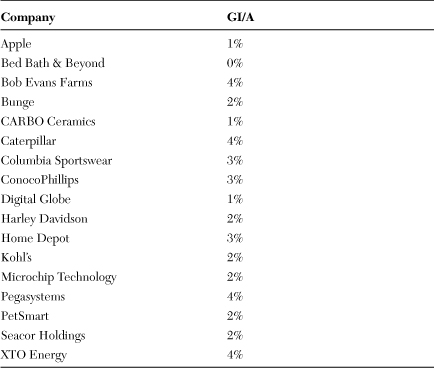
Table 8-1 shows GI/A ratios for firms that have employed acquisitions for much of their recent growth. For comparison, Table 8-2 shows the GI/A ratios for firms that have grown mostly organically.
Table 8-1 Goodwill Plus Intangibles Divided by Total Assets (GI/A) for Serial Acquirers (as of 12/08)

Table 8-2 Goodwill Plus Intangibles Divided by Total Assets (GI/A) for Organic Growers (as of 12/08)

As you can see, a wide divide exists between the ratios of serial acquirers and organic growers. As a rule of thumb, organic growers usually show ratios below 5 percent, and ratios of 15 percent or more identify firms growing at least partly by acquisition.
Award 1 point to companies with GI/A ratios less than 5 percent, and subtract 1 point for companies with ratios greater than 15 percent.
Overblown Competitive Advantages: Factors That Should Make a Difference But Often Don’t
Some supposed competitive advantages sound good but somehow never amount to much in practice. The following are two competitive advantages that you’d be better off ignoring unless you’re an expert in the field.
Patents
The pharmaceuticals industry effectively employs patents as a barrier to entry. However, pharmaceuticals are more the exception than the rule. For instance, tech companies file hundreds, if not thousands, of patents annually. Yet new competitors constantly pop up, and it’s hard to think of a tech name that has turned its patents into an effective barrier to entry.
Few investors have the expertise to judge a patent’s value as a barrier to entry. Even in the pharmaceuticals industry, it’s difficult to assess the value of a particular patent. A new drug may sound miraculous, but an even better treatment could be on the way from a competitor.
Ignore patents as a significant barrier to entry unless you are an expert in the field and a patent attorney.
Proprietary Technology/Production Processes
In theory, a company’s superior production processes or equipment could be an effective barrier to entry. In practice, these advantages rarely produce the expected results.
For example, again comparing Lexmark to Hewlett Packard, Lexmark enjoys laser printer production cost advantages compared to HP because Lexmark makes its own printer engines (the guts of the printer), while Hewlett Packard buys its engines from Canon. Somehow, that advantage has never meant much. Hewlett Packard still dominates the industry, and Lexmark has failed to gain significant market share.
Every CEO, given the opportunity, will tell you why his or her company’s products are technologically superior. That’s their job. Many market analysts repeat that same dogma as truth. As with patents, unless you’re an expert, you’d be well advised to remain skeptical about touted technological advantages.
Business Plan Scorecard
As discussed earlier, award 1 point for each category where a company has a significant advantage, and subtract 1 point for categories where it is at a disadvantage. Score 0 where the category is irrelevant. See Chapters 15 and 16 for further details on the relevance of the categories to each strategy.
Summary
Professional money managers routinely evaluate a firm’s business plan before investing, and you should too. Technology candidates usually score lower than other industries, because many do not enjoy strong brand identity that separates them from the field, most offer expensive products with short life cycles, and many depend on acquisitions for growth.
