3. Screening
Stock screeners are programs, usually accessed through websites, that allow you to search the entire market for stocks meeting your specific requirements. Screening is the most efficient way to find stock candidates, because you can tailor your screens to filter out undesirable stocks, permitting you to focus your research on worthwhile candidates. Screening is an art that requires practice to get it right. When you first try a new screen, it will turn up too many or too few candidates. When you get the right number—say, 20 or so—you’ll find that you don’t like most of them. Eventually you’ll devise a set of screening parameters that gives you a manageable list of candidates worth researching.
While many financial websites offer screening programs, a surprising number are poorly designed, apparently by people who have never bought a stock. Often, the screening parameters don’t make sense. For instance, who would want to screen for stocks that earned exactly $3.50 per share last year? In other instances, the screening parameters simply don’t work.
I’ve found four free screening programs that are mostly reliable, although even some of these have quirks you need to know about. I’ve listed the four screeners in order of ease of use, with the simplest listed first:
• Zacks
Morningstar
Morningstar’s free Stock Screener offers only 18 screening criteria. However, that number is misleading. Morningstar allows you to search for stocks based on its proprietary “stock grades.” Morningstar grades stocks from A to F in three categories: growth, profitability, and financial health. Morningstar combines a number of separate fundamental factors to compute each grade. Thus, it would probably take 20 or 30 separate screening parameters to replicate what you get by using the three grades.
Also unique to Morningstar, you can search for stocks based on eight different categories (stock type), such as “distressed,” “speculative growth,” and “high yield.” Furthermore, you can choose to narrow your search to one of nine different “equity styles,” such as “large value,” “mid-growth,” and “small core.”
You can find Morningstar’s Stock Screener from its homepage (www.morningstar.com) by going to the Tools section and selecting Stocks and then Stock Screener.
Google’s Stock Screener offers more than 50 screening parameters in seven different categories. Even so, it’s still very simple to operate. That said, the rocket scientists who designed Google’s program probably don’t invest in stocks much.
For instance, the Price category includes search parameters, such as “200d avg price,” more commonly known as the “200-day moving average.” Unfortunately, all you can do is screen for stocks with 200-day MAs between minimum and maximum values that you specify. You can’t screen for stocks trading above or below their moving average (MA), which is how you use such parameters.
Those complaints aside, Google’s screener is a good bridge between Morningstar’s ultra-simple Stock Screener and the more powerful Zacks and Portfolio123 screeners. From Google Finance (http://finance.google.com), click the “stock screener” link next to the Get Quotes button.
Zacks
Zacks Investment Research specializes in analyzing how changes in analysts’ buy/sell ratings and earnings forecasts move share prices. Its Custom Stock Screen provides more than 125 screening parameters. More than 50 of them involve analyst buy/sell ratings and earnings forecasts. Despite its power, the Zacks screener is still relatively user-friendly.
Select Screening from Zacks’ homepage (www.zacks.com), and then select Custom Stock Screener (Screening Tools) to get to the screener. Once there, click a Category to see the search parameter choices available for that group.
Portfolio123
Portfolio123 (www.portfolio123.com) offers, arguably, the most powerful free web screener available. It may take you some time to learn how to use it, but it’s worth the effort.
Once you’ve figured it out, Portfolio123’s screener will become your best stock market friend. It’s the only free screener that allows you to compare data values. For instance, you could search for stocks with debt/equity ratios below the industry average, or for stocks with gross margins higher than their five-year industry average. Unlike the other screeners, you can save your Portfolio123 screens, an important feature that spares you the time and effort of entering your search parameters every time that you want to rerun a screen. It’s easy to modify existing screens or add new ones.
For a $29 or $49 monthly fee, depending on which options you select, Portfolio123 offers backtesting, which gives you a way of trying your stock-picking ideas without risking real money. For example, say you’ve decided that the key to success is finding stocks with P/E ratios between 25 and 30 that grew sales at least 25 percent over the past year. You could use Portfolio123’s backtesting feature to find stocks that would have met your criteria had you run the screen at some point in the past—say, two years ago. Portfolio123 tells you how you would have fared had you bought those stocks two years ago.
You’ll probably devise your own screens after you’ve read this book. But here are a few sample screens to get you started and demonstrate how the screening programs work.
Google Growth Screen
This screen seeks out cash-rich, debt-free, profitable, and reasonably priced stocks that are in favor with the smart money.
From Google Finance (http://finance.google.com), click the “stock screener” link next to the Get Quotes button. When you get there, Google displays a default screening program using four of the 60 or so available criteria (selection choices). Start by deleting all but the Market-Cap criterion (click the X to the right of each criterion you want to delete).
Company Size: Market Capitalization
Specify a $1 billion minimum market cap.
Smaller companies are usually riskier than larger companies. They typically offer less diverse product lines, weaker balance sheets, and less experience dealing with economic downturns. Thus, you can reduce your risk by avoiding very small firms. Most investors use market capitalization, which is how much you’d have to shell out to buy all of a firm’s shares, to measure company size.
Firms with market caps below $2 billion are termed small-caps, and those above $8 billion are large-caps. Those in between are mid-caps. I set my minimum market cap at $1 billion. Try reducing your minimum to $500 million (500M) if you want to see more stocks, or increasing it to $5 billion if you want to cut your risk.
Valuation: Price/Sales Ratio
Specify a minimum P/S ratio of 2 and a maximum of 7.
The price/sales ratio is similar to the more familiar price/earnings (P/E) ratio, except that it compares the current share price to the last 12 months’ per-share sales instead of per-share earnings.
The screen avoids stocks with P/S ratios below 2 because those stocks are more likely value candidates than growth stocks. On the downside, setting that minimum rules out supermarket chains and other low-profit-margin businesses. The way the math works, stocks with low profit margins also have low P/S ratios. Change your minimum P/S requirement to 1 if you want to see such stocks.
Price/sales ratios can run as high as 10, and sometimes much higher for in-favor growth stocks. Specifying a maximum 7 P/S avoids overpriced stocks. Since I arbitrarily picked that number, try increasing it to 8 or 9 if you want to see more stocks, or cut it to 5 or 6 if you want to cut your risk.
Cash-Rich: Current Ratio
Specify a 2.5 minimum.
Given the recently fragile credit markets, the slightest hint of a cash shortage can sink a stock. Thus, it’s important to reduce the odds of that happening to your stocks. Using the current ratio to check a firm’s cash position is the first of two selection criteria I use to achieve that goal.
The current ratio compares current assets such as cash, inventories, and accounts receivables to short-term debt such as payroll expenses and other current bills. A ratio of 1 means that current assets equal liabilities, while a 2 ratio means that current assets are double current liabilities. Setting the minimum allowable current ratio at 2.5 ensures that passing firms have plenty of cash. Although I arbitrarily picked that number, I don’t see much advantage in upping that minimum, and I certainly wouldn’t lower it.
Add the current ratio requirement to the screen by selecting Add Criteria, and then Financial Ratios, and finally Current Ratio.
No Debt: Total Debt/Equity Ratio
Specify a 0.1 maximum (most recent quarter).
Refinancing debt is still problematic for all but the top credit-rated corporations. You can avoid such issues by limiting your picks to stocks carrying no long-term debt. To do that, you can use the total debt-to-equity ratio, which compares the total of short- and long-term debt to shareholders’ equity (book value).
While it’s tempting to specify a 0 ratio, I set my maximum at 0.1 to avoid ruling out firms carrying incidental debt items, such as lease obligations on their balance sheets.
Profitable: Return on Equity
Specify a 20% minimum (TTM).
Unless you’re looking for beaten-down value stocks, your best candidates are always profitable firms as opposed to money losers. Return on equity (ROE) measures profitability by comparing net income to shareholders’ equity (book value). Most money managers that I know require a minimum 15 percent ROE. However, here I require a minimum 20 percent ROE to focus on the most profitable candidates. Try cutting your minimum to 15 percent if you want to see more stocks.
Follow the Money: Institutional Ownership
Specify 40% minimum institutional ownership.
Institutional buyers such as mutual funds and pension plans are more wired into the market than individual investors. If they don’t own a stock, you shouldn’t either. “Institutional ownership” is the percentage of a firm’s shares held by those big players. The best growth candidates are stocks that are in favor with the smart money. Institutional ownership ranges from 40 to 95 percent for in-favor stocks.
Growth Rules: Five-Year Revenue Growth
Specify 10% minimum five-year revenue growth.
Growth stocks, by definition, should be growing sales and earnings at least 15 percent annually, and more is better. However, the 2008–2009 economic setback tripped up even the best growth stocks. Given the volatile environment, revenues are a steadier growth gauge than earnings. I take a long view by using the five-year figure. Usually, you want to see at least 15 percent average annual revenue growth. But, considering the tough economy, I required only 10 percent.
Results
Ideally, this screen should turn up 15 or 20 strong growth candidates. If it doesn’t, modify the parameter values as suggested to increase or decrease the number of hits.
Zacks Growth/Momentum Screen
Momentum investors, such as hedge fund managers, search for growth stocks that are already outperforming the market. But that’s not enough. The underlying companies must be profitable and have already racked up strong growth. There’s even more. Momentum strategies require pinpointing the stocks in this already-hot group that are getting hotter. That is, earnings forecasts are increasing.
Find the Custom Stock Screener by selecting Screening on the Zacks homepage (www.zacks.com). Select a parameter category, and fill in the required information for the parameters you want to use (leave the others blank). To help you find the screening parameters, I’ve listed the corresponding category name in parentheses in the following sections.
After you specify a search parameter, be sure to click Add to add it to your screen. (Parameters listed without an Add button are unavailable on the free screener.) Zacks displays your selected search criteria near the top and indicates how many stocks meet your current screen requirements.
Small, But Not Too Small: Market Capitalization
Specify a $250 million minimum
(>=) market cap (Size & Share Volume).
Usually, you’ll find the best momentum prospects among smaller stocks, but don’t go overboard on that score. Very small firms are less able to withstand changing market and economic conditions. Most analysts use market capitalization (the recent share price multiplied by the number of shares outstanding) to measure company size.
Stocks with market caps below $2 billion are termed small-caps. Market caps above $8 billion are large-caps, and those in between are mid-caps. I arbitrarily set my minimum market cap at $250 million. Try cutting that limit to $200 million, or even $150 million, if you want to see more stocks. Raise it to $500 million if you want to cut your risk.
Follow the Money: Institutional Ownership
Specify a 40% minimum (>=) held by institutions (Ownership).
Institutions are mutual funds, pension plans, and other big investors. By virtue of the huge trading commissions they generate, institutional investors have access to inside information we’ll never see. Thus, if they don’t own a stock, you shouldn’t either. Institutional ownership is the percentage of a firm’s stock held by those big players. It runs from 40 percent to 95 percent for in-favor growth stocks. Specify 40 percent minimum institutional ownership.
Analyst Buy/Sell Ratings: Current Broker Recommendation
Specify a maximum (<=) 3.0 (Broker Rating).
Stock analysts publish buy/sell recommendations on the stocks they follow. Zacks compiles the analysts’ advice into strong buy (1), buy (2), hold (3), sell (4), and strong sell (5) categories. It assigns the value shown in parentheses to each category. For instance, if all analysts were at strong sell, the consensus rating would be 5. Since, if anything, analysts tend to be overoptimistic, it pays to avoid stocks that they are advising selling. Specify “hold” or better, which equates to a maximum rating of 3.
Expected Earnings Growth: Long-Term Growth Consensus Estimate
Specify a minimum (>=) 15% (EPS Growth).
Analysts also publish estimates for long-term (three to five years) average annual earnings growth for stocks they follow. I require a minimum 15 percent. Consider increasing that minimum to 20 percent, or even 25 percent, if you want to limit your search to only the hottest prospects.
Profitable: Return on Equity
Specify a minimum (>=) 15% (Return on Investment).
In any market, you’ll always do best by sticking with profitable companies. Return on equity (income divided by book value) is the most widely used profitability measure. For profitable companies, values typically range from 5 percent to 25 percent, where higher is better. Most money managers require at least 15 percent ROE, so specify a minimum 15 percent current ROE.
No Debt: Debt/Equity Ratio
Specify a maximum (<=) 0.1% (Liquidity & Coverage).
In this market, the last thing you need is a high-debt stock. The debt/equity ratio, which compares long-term debt to book value, is a popular debt measure. A 0 D/E signals no debt, and the higher the ratio, the higher the debt. Specify a maximum 0.1 debt/equity ratio, which is just high enough to avoid precluding companies with minor incidental debt.
Earnings Estimate Trend: % Change F1 Estimate (4 Weeks)
Specify a minimum (>=) 5% (EPS Estimate Revisions).
Research done by Zacks and many others has found that changes in analyst earnings estimates move share prices. Stocks tend to move up after estimates increase, and vice versa. Furthermore, once earnings estimates have moved, they tend to move further in the same direction. Thus, stocks with recent positive earnings estimate changes have better price appreciation potential than those that don’t. Zacks’ “% Change F1 Estimate (4 weeks)” parameter tracks the last four weeks’ percentage change in current-year consensus earnings forecasts.
Strong Price Chart: Relative Price
Specify a minimum (>=) 1.5 (Price & Price Changes).
Contrary to the familiar “buy low, sell high” mantra, stocks that have already outperformed the market are more likely to continue their winning ways than other stocks. Conversely, stocks that have underperformed will probably continue to disappoint shareholders.
Zacks’ Relative Price Change parameter compares the year-to-date price change of each stock to the S&P 500. A relative price of 1 means that a stock has performed equal to the S&P, while an RP of 2 means that the stock has doubled the S&P’s price appreciation. My 1.5 minimum requirement means that passing stocks must have moved up at least 50 percent more than the index. Since RP measures year-to-date price action, the same values will give you different results in January than in December.
Portfolio123 Down & Out Value Stock Finder
This screen uses Portfolio123’s unique capabilities to find companies with strong historical sales growth and profitability histories that have recently stumbled.
Although registration is free, you must be a Portfolio123 member to use the screener. After you’ve registered (select the free member option), click the Screener tab, and then click New to set up a new screen. Here’s a brief rundown on how to use the screener.
Portfolio123 calls each screening term a “rule.” For instance, if you wanted to limit your results to stocks trading for more than $10 per share, you could set up your first rule as follows:
price > 10
If you’re rusty on algebraic terminology, the > symbol means “greater than.” The >= symbol means “greater than or equal to,” and the <= symbol means “less than or equal to.” Finally, the symbol * means “multiply.”
Thus, if you wanted to confine your list to stocks with market caps of $900 million or lower, your rule would look like this:
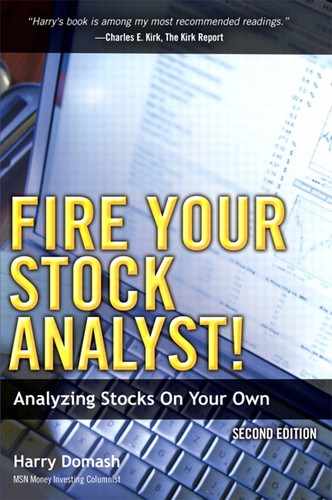
Portfolio123 lists its screening parameters in the Rule Reference section near the bottom of the page. Select Stock Factor to see all available individual stock screening criteria. Click a category name such as Price & Volume to see the available parameters in that category. Then click a specific factor, such as Beta, to see Portfolio123’s definition for that factor. For instance, the definition for MktCap is “Market Capitalization ($ millions).” Double-click the factor name to insert it into a screening rule. Figure 3-1 shows the screening rules for the Down & Out Value Stock Finder.
Figure 3-1 Portfolio123 Screening Rules for the Down & Out Value Stock Finder
After you’ve set up one or more rules, click Totals to see how many stocks meet your screening requirements.
The following sections describe the details of setting up the Down & Out Value Stock Finder screen.
Strong Long-Term Profitability: Return on Assets: Five-Year Average
ROA%5YAvg >= 10
Return on assets (ROA; net income divided by total assets) is a profitability measure. The higher the ROA, the more profitable the company. The average ROA for all stocks is in the 7 to 8 range. This term requires a minimum value of 10 for five-year average ROA, limiting the list to stocks recording above-average long-term profitability. Try increasing the minimum to 15 if you want to see only candidates with stronger profitability numbers.
Depressed Current Profitability: Return on Assets
ROA%TTM <= 0.7 * ROA%5YAvg
This term finds companies with currently depressed ROAs compared to their historical average, a desirable trait for value candidates.
Specifically, it requires that the current (trailing 12 months) ROA must be no higher than 70 percent of the average ROA over the past five years. Try cutting the multiplier to 0.5 if you want to limit the field to stocks with recent profitability ratios of only half of their long-term average.
Value Priced: Price/Sales Ratio
Pr2SalesTTM <= 1.5
Price/sales is a valuation ratio similar to the P/E ratio, except that it compares the current share price to the last 12 months’ per-share sales instead of per-share earnings. P/S ratios below 1.5 typically define value-priced stocks, while higher ratios identify growth stocks. This term sets the maximum P/S ratio for passing stocks at 1.5. Try cutting the maximum to 1.0 if you want to limit the field to deep-value stocks.
Say No to High Debt: Debt/Equity Ratio
DbtLT2EqQ <= 0.5
The debt/equity ratio compares long-term debt to shareholders’ equity (book value). Zero ratios signal no debt, and the higher the ratio, the higher the debt. Most value candidates are established companies that have accumulated some debt. Setting a 0.5 maximum D/E rules out debt-heavy companies.
Sufficient Cash: Quick Ratio
QuickRatioQ >= 1.1
The quick ratio compares the total of cash and accounts receivables to current liabilities. The ratio is 1.0 when cash and receivables equal current liabilities. The ratio would be 2.0 if cash plus receivables were double current liabilities. Requiring a minimum 1.1 ratio rules out firms facing a short-term cash crunch. Try raising the minimum to 2.0 if you want to see only cash-rich companies.
Actively Traded: Average Daily Volume Last Quarter
AvgVol (60) >= 50000
The average daily trading volume reflects the number of shares traded daily. This term limits the field to stocks trading at least 50,000 shares daily, on average, over the past 60 days. Requiring a 50,000 daily volume precludes lightly traded stocks, which are subject to price manipulation and other problems.
Real Sales: 12-Month Revenue
SalesTTM >= 50
Most publicly traded corporations rack up sales exceeding $100 million annually. This term requires a minimum of $50 million in sales over the past 12 months, ruling out firms without meaningful sales.
Long-Term Grower: Five-Year Revenue Growth
Sales5YCGr% >= 10
Companies can’t grow without growing sales. This term requires that passing stocks must have recorded at least 10 percent average annual sales growth over the past five years. This requirement, combined with the next test, ensures that although they are currently down and out, qualifying firms have a reasonably strong historical sales growth history.
Sales Growth Slowdown: Revenue Growth Quarter Versus Quarter
Sales%ChgPYQ <= 0.5 * Sales5YCGr%
Limits passing stocks’ recent quarter’s year-over-year sales growth (Sales%ChgPYQ) to 50 percent of their five-year average annual growth rate (Sales5YCGr%). This requirement identifies companies with recent sales growth below long-term trends, a hallmark of promising value stock candidates.
Out of Favor: Analyst Buy/Sell Mean Rating
AvgRec >= 3
Services such as Reuters compile analyst ratings for each stock into five categories and assign the numeric value shown in parentheses to each category: strong buy (1), moderate buy (2), hold (3), moderate sell (4), and strong sell (5).
The best value candidates are out of favor with most market players, including analysts. This term requires that the consensus analyst rating must be hold (3) or worse. Try changing the minimum rating value to 3.5 if you want to limit the field to only the most out-of-favor stocks.
Portfolio123 Growth Stock Screen
This screen uses Portfolio123’s screener to find strong earnings growth stocks that are already outperforming the market. Not long-term buy-and-hold candidates, these stocks are only suitable for a strong market.
Not Too Small: Market Capitalization
MktCap >= 400
All else equal, smaller companies are riskier bets than larger stocks. Market capitalization, which is how much you’d have to shell out to buy all of a company’s shares, is the best way to measure company size. Some risk-averse investors won’t go below $1 to $2 billion in market cap. However, many promising growth candidates can be found in the $500 million to $1 billion range. This term rules out stocks with market caps below $400 million. Try raising the minimum to $1 billion if you want to reduce your risk.
Low Debt: Total Debt to Equity
DbtTot2EqQ <= 0.1
The best growth candidates carry little or no debt and are loaded with cash. The total debt/equity ratio compares the total of short- and long-term debt to shareholders’ equity (book value). A 0 D/E signals no debt, and the higher the ratio, the higher the debt. Typically, firms with D/E ratios above 0.5 are considered high debt. This term limits the field to firms with a maximum 0.1 D/E ratio. Try raising your maximum D/E to 0.2 if you want to see more stocks.
Loaded with Cash: Quick Ratio
QuickRatioQ >= 2
The quick ratio compares current assets readily converted to cash (cash plus accounts receivables) to current liabilities. A quick ratio of 1 means that current cash equals current liabilities. This term requires a minimum 2 quick ratio, which means that cash plus receivables must be double current liabilities.
Profitable: Five-Year Average Return on Assets
ROA%5YAvg >= 10
Profitability measures shareholders’ return on investment. Whether you’re looking for growth or value stocks, you’ll always do best by sticking with the most profitable companies. ROA compares net income to total assets. The higher the ROA, the more profitable the company. This term requires a minimum 10 ROA, which rules out low-profitability stocks. I use the five-year average ROA because the recent economic slump tripped up even normally profitable companies.
In Favor: Analyst Buy/Sell Rating
AvgRec <= 2
Services such as Reuters compile analyst ratings for each stock into five categories and assign the numeric value shown in parentheses to each category: strong buy (1), moderate buy (2), hold (3), moderate sell (4), and strong sell (5).
The best growth candidates are in favor with most market players, and analyst buy/sell ratings are the best gauge of a stock’s popularity. This term requires that passing stocks must be rated at moderate buy (2) or better by most analysts.
Good Growth Prospects: Forecast Long-Term Growth
LTGrthRtMean >= 15
Given enough time, share prices more or less track earnings growth. So, all else equal, stocks with the strongest earnings growth usually do the best. Many analysts forecast long-term (five-year) average annual earnings growth for stocks they cover. This term requires that analysts must be forecasting at least 15 percent average annual long-term earnings growth for passing stocks. Consider raising that to 20 percent if you want to limit your list to the hottest candidates.
Not Too Cheap: Recent Price
price >= 15
Stocks changing hands at low trading prices usually got that way because most market players see problems ahead. Whether they are right or not, cheap stocks are riskier than more expensive stocks.
For that reason, many growth stock money managers avoid stocks trading below $15. This test requires that passing stocks meet that criterion.
Strong Long-Term Price Chart
price >= 1.20 * SMA(200)
Valid growth candidates should be in strong uptrends. You can judge whether a stock is trending up or down by comparing its current share price to its moving average (average closing price over a specified number of trading days). Stocks trading above their moving averages are said to be in an uptrend, and those trading below their MAs are in a downtrend. The distance that a stock is trading above or below its moving average reflects the trend strength.
The 200-day moving average works well for measuring long-term trends. This term requires that a passing stock must be trading at least 20 percent above its 200-day MA, signaling a strong uptrend. Try cutting that requirement to 15 percent above the 200-day MA if you want to see more stocks, but don’t go below that figure.
Strong Medium-Term Price Chart
price >= 1.05 * SMA(50)
The 200-day test ensures that passing stocks are in long-term uptrends. This test uses the 50-day moving average to isolate stocks that are in medium-term uptrends as well.
Because the 50-day MA tracks the share price closer than the 200-day MA, this test only requires that a stock be trading 5 percent above its 50-day average. In terms of trend strength, this is equivalent to trading 20 percent above its 200-day average. Try cutting the margin to as low as 1 percent above the 50-day MA if you want to see more stocks.
Zacks’ Bulletproof Stocks
Whether or not your stock actually files for bankruptcy, just the rumors will be enough to drive the share price into the ground. This screen uses the Zacks’ Stock Screener to find stocks that are unlikely to be bankruptcy candidates anytime soon.
Unless they’re filing for bankruptcy to avoid big lawsuits, companies fail for only one reason: They’ve run out of cash. Avoiding bankruptcy candidates comes down to developing a set of requirements that cash-starved companies can’t possibly meet. That’s the goal of this screen. I call the survivors “bulletproof stocks.” Here are the bulletproof stock qualifications:
• Maximum 0.1 debt/equity ratio
• Minimum 2.0 quick ratio
• Positive operating cash flow
• Positive net income
• Current share price at least $5
• Annual sales at least $50 million
The debt/equity and quick ratios limit the field to cash-rich firms with virtually no debt—at least as of the end of their last reporting period.
The positive operating cash flow requirement, in theory, eliminates cash burners. But it’s not foolproof. Insisting on positive net income helps ensure that the company is, in fact, profitable.
Stocks usually trade below $5 per share when most market players see serious fundamental problems. Limiting the field to stocks trading above that level helps ensure that the firm’s fundamental outlook hasn’t seriously deteriorated since it published the debt, cash, and cash flow numbers that form the basis of this analysis.
The $50 million annual sales requirement rules out companies that look good on paper but, in reality, have no substantial business.
You can find the Custom Stock Screener by selecting Screening on the Zacks homepage (www.zacks.com). To help you find the screening parameters, I’ve listed the corresponding category name in parentheses in the following sections.
Debt/Equity Ratio
debt/equity ratio <= 0.1 (Liquidity & Coverage)
The debt/equity ratio compares long-term debt to shareholders’ equity (book value). Zero values reflect no long-term debt, and the higher the ratio, the higher the debt. Setting the maximum allowable D/E at 0.1 instead of 0 allows companies with incidental debt items such as long-term leases to pass the test.
Quick Ratio
quick ratio >= 2.0 (Liquidity & Coverage)
The quick ratio compares the total of cash on hand plus accounts receivables to current liabilities. Specifying a minimum 2.0 ratio means that cash plus receivables must be at least double current liabilities.
Operating Cash Flow
cash flow (millions) >= 0.001 (Income Statement & Growth)
Operating cash flow is the actual cash that flowed into or out of a firm’s bank account. Unlike reported earnings, which are subject to myriad accounting decisions, it’s hard to fudge the cash flow numbers. All we’re looking for here is that cash flowed in, not out. We don’t care about the numbers.
Net Income
net income (millions) >= 0.001 (Income Statement & Growth)
In theory, the positive operating cash flow requirement should be sufficient to ensure that passing stocks are profitable, on a cash basis. But you can’t underestimate the creativity of motivated accountants. Checking for positive net income helps ensure that the firm is profitable.
Current Price
current price >= 5 (Price & Price Changes)
Cheap stocks are usually cheap for good reason. This check helps rule out stocks that look good based on the most recent quarterly report, but, in fact, are facing serious problems.
Annual Sales
annual sales >= 50 (Income Statement & Growth)
Zacks’ annual sales parameter actually totals the sales from the last four reported quarters. Requiring $50 million sales during the last 12 months filters out companies that aren’t real businesses.
The screen should turn up at least 300 bulletproof stocks. Zacks doesn’t give you a way to print the list directly, so use the “export” function to download the results into an Excel spreadsheet.
The Zen of Screening
It takes some practice to become proficient at screening. When you run your first screens, you’ll probably come up with no hits, because you’ve specified too many parameters and/or made your requirements too tight. When that happens, it’s hard to figure out which search parameters are causing the problem.
It’s easier to go the other way. That is, start with just a few parameters and relatively loose requirements so that you get too many hits. Then add parameters and tighten requirements one by one until your screen comes up with a reasonable number of candidates to research—say, 15 to 30 stocks.
After you’ve done some preliminary research, you’ll probably be unhappy with many of the stocks in your first group of candidates. If that’s the case, modify your screening parameters to disqualify the offending stocks. Repeat the process until your screens produce reasonably sized lists of qualified stocks.
Premade Screens
Some websites offer ready-to-use or premade screens. The advantage of premade screens is you don’t have to devise your own search parameters. All you have to do is click and view the results. One problem with premade screens is that you don’t have much of a feel for the quality of the screening strategy.
There is an exception. The American Association of Individual Investors (AAII) website (www.aaii.com) offers a large variety of premade screens and tracks their performance over time. AAII, a not-for-profit organization, provides education in the area of stock and mutual fund investing. You have to be a member to access the screening area. Membership is $49 a year and includes a monthly investing magazine that by itself is worth the price. The magazine doesn’t tout stocks. It’s educational in content and describes stock and mutual fund selection strategies that well-known money managers follow.
When I checked, the AAII website was running 50 or so value, growth, combined growth and value, small-cap, and specialty screens based on the stock-picking strategies of the likes of Benjamin Graham, John Neff, David Dreman, Geraldine Weiss, Warren Buffett, and many more. One AAII screen is based on Joseph Piotroski’s value-stock selection criteria that inspired my detailed fiscal fitness exam described in Chapter 10.
AAII runs the screens monthly, so you can see the top stocks picked by each screen as of the end of the past month. AAII also updates each screen’s performance figures at the same time and once a year compares the performance of all the screens.
Summary
Screening is the best way to find stock candidates. But coming up with screens that work for you is a process of trial and error. However, like so many things in life, the more you work at it, the better your results.
Consider the results of all screens, whether based on your ideas or the ideas of a guru, as a list of research candidates, not as a buy list.