9. Analysis Tool #6: Evaluate Management Quality
Many professional money managers consider management quality an important consideration in their analysis. They often visit the company and spend a day or two talking with management to determine if its key officers are in tune with stockholders’ best interests. It’s impractical for individual investors to visit companies and meet with management. However, we still have clues at our disposal to accomplish the job.
Key Executive and Board Quality
Start by reviewing key officers’ resumes. Reuters’ Officers and Directors report includes biographies of key executives and board members.
Look for officers with relevant experience. At least some should be crusty veterans with years of experience in the same industry. Imagine that you’re doing the hiring. Would you hire these people based on their experience? Notice how long the key executives have been on the job. Numerous recent management changes signal problems.
Look at the makeup of the board of directors. The best boards are filled mostly with CEOs of successful firms in the same field, not consultants and venture capitalists.
During the Internet bubble heyday, many hot startups were run by investment bankers rather than experienced managers. Here’s an extreme example.
Webvan was a web-based grocery retailer offering home delivery that went public in November 1999 and filed for bankruptcy less than two years later. Its CEO had previously been a management consultant. Its senior VP of corporate operations and finance, a lawyer, came from stockbroker Merrill Lynch. The VP of merchandising, the man responsible for ordering the groceries, came from General Electric. Nobody on the board of directors had experience in selling groceries.
Unfortunately, things haven’t changed much. You’ll still find the boards of many companies filled with private equity investors, stockbrokers, lawyers, and consultants.
Clean Accounting
Many market pros consider clean and straightforward accounting a hallmark of good management. For them, repeated one-time, nonrecurring, and extraordinary charges are red flags signaling questionable accounting practices.
The reason that some corporate executives like nonrecurring expenses is that they don’t have to count them when they tabulate pro forma earnings. Thus, the more expenses that can be defined as nonrecurring, the higher the reported pro forma earnings.
There’s nothing wrong with pro forma earnings when they are used appropriately. Such uses might include presenting the results of recently merged companies “as if” they had always been a single company, or excluding the effects of one-time events such as income tax refunds or legal expenses.
The problem comes in when managers use them inappropriately, and repeatedly, simply to boost pro forma earnings. Unfortunately, analysts often accept management’s definition of what’s appropriate without questioning it.
It’s easy to spot nonrecurring charges. Both Reuters and MSN Money list nonrecurring items on a separate line of each company’s income statement. The entries are labeled Unusual Expense/Income on both.
The raw numbers don’t mean much by themselves, so it’s best to compare nonrecurring expenses to total sales, also shown on the income statement. You do that by dividing the nonrecurring expenses by sales and computing the result as a percentage. For instance, the ratio would be 10 percent if a company recorded sales of $1,000 and listed $100 in nonrecurring charges (100/1,000).
Table 9-1 lists the nonrecurring expenses to sales percentages for a sampling of companies. I compiled the data using MSN Money’s income statement, which combines several separate line items into Total Extraordinary Items. If you use the MSN Reports, add unusual expenses to total extraordinary items, and divide that total by revenues.
Table 9-1 Unusual Expenses and Extraordinary Charges as a Percentage of Annual Sales
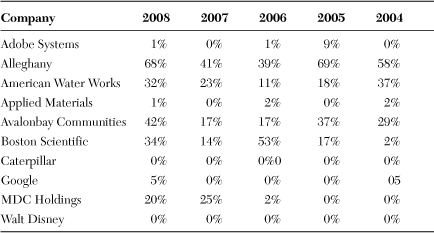
Figures shown are from fiscal year data closest to the calendar year columns, compiled from MSN Money income statements. Charges considered include unusual expenses and total extraordinary items.
Use the Reuters income statements if you want to see more details. If you do, consider all charges labeled unusual, restructuring, purchased R&D, extraordinary, accounting changes, and discontinued operations in the calculation.
Judging management quality is a subjective exercise. Most firms from time to time incur costs that are truly nonrecurring, such as charges associated with losing a lawsuit, closing factories, or writing off worthless patents. The trick is to differentiate those from the companies that persistently come up with nonrecurring expenses to boost pro forma earnings.
Looking for recent years’ patterns is more significant than any single year’s number. You can do that by simply eyeballing the results or averaging the past five years’ ratios. Consider companies with five-year average ratios much above 4 percent as suspected nonrecurring expense abusers.
For a historical perspective, Table 9-2, taken from the first edition of this book, shows the same information for a selection of companies as found in early 2002.
Table 9-2 One-Time, Nonrecurring, and Extraordinary Charges as a Percentage of Annual Sales as of Early 2002
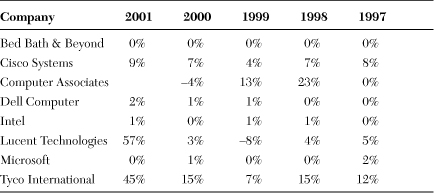
Figures shown are from fiscal year data closest to the calendar year columns, compiled from Reuters’ income statements. Charges considered include unusual expenses, restructuring, purchased R&D, extraordinary items, accounting charges, and discontinued items.
Tyco’s CEO, Dennis Kozlowski, and CFO, Mark Swartz, were convicted of grand larceny. Lucent flirted with bankruptcy but didn’t file and eventually merged with Alcatel.
Earnings Growth Stability
Looking at a firm’s historical earnings pattern can also help you evaluate management quality. Every company has its bad years, but overall, solid managers turn out relatively consistent earnings growth. Conversely, some firms’ roller coaster earnings histories make you wonder whether management is really in control.
Both MSN Money’s Financial Results Highlights Report and Reuters’ Financial Highlights reports list up to three years’ reported earnings per share in formats that make it easy to visually evaluate earnings growth stability. They show each fiscal year’s quarterly earnings in a column so that you can compare the same quarter of each year (such as the March quarter) and thus eliminate seasonal variations. That’s good for a quick overview, but you really need at least four, and ideally five, years worth of data to analyze earnings growth stability. Earnings.com is a good resource for quarter earnings per share data going back five years or so. On the downside, Earnings.com shows the EPS data in list form, so you have to build your own table.
Table 9-3 shows an example of a company with consistent earnings history. Always compare earnings to the year-ago period, not the previous quarter, to rule out seasonal distortions. Don’t be too hard of a grader. Even well-managed companies have occasional bad quarters.
Table 9-3 Earnings Per Share, Quarterly Results; Consistent Earnings History Reflects Quality Management
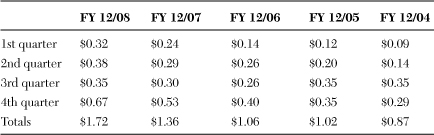
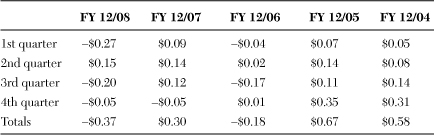
Table 9-4 shows an example of a company with an erratic earnings history, casting doubt on management quality.
Table 9-4 Earnings Per Share, Quarterly Results; Inconsistent Earnings Growth
Stock Ownership
It’s reassuring to know that key management, particularly the CEO and CFO, hold large positions in a firm. What constitutes a large position varies with company size, but think millions of shares for the CEO and hundreds of thousands for the CFO. It’s disconcerting if key officers hold only a few thousand shares and sell immediately after they exercise stock options.
Yahoo!’s Insider Roster report is a good place to see how many shares insiders own. Reuters’ Officers and Directors reports show the stock options held by each insider. Low shareholdings by key officers isn’t a deal breaker per se, but it should be considered along with the other management quality factors.
Summary
Management quality is probably the single most important determinate of a company’s success. Reviewing key officers’ resumes is a good check on management’s qualifications for the job. Analyzing the firm’s accounting cleanliness tells you whether its officers are a conservative lot looking out for the firm and its shareholders’ long-term interests, or are bending the rules to achieve short-term gains. Analyzing earnings growth stability and key officers’ shareholdings gives you further perspective on management quality.