4. Analysis Tool #1: Analyze Analysts’ Data
Tomorrow, or even next week, your stocks will move up or down, driven more by the winds of the market than fundamentals. But long-term, trading prices usually reflect the market’s earnings growth expectations for a stock. All else equal, you make money when expectations rise and lose money when they decline.
And who sets those expectations? Stock analysts.
Sure, analysts have come under fire time and time again for giving bad advice. They told us to buy ridiculously overpriced tech stocks when the market was in bubble territory in 1999 and 2000. In 2001, they urged us to buy Enron shortly before the energy trader collapsed. In 2007 and 2008, analysts were advising buying Fannie Mae, AIG, and oh so many bank stocks even while the credit markets were collapsing.
After all that, analysts’ buy/sell ratings and earnings forecasts still mold most investors’ expectations for any given stock.
While you’re unlikely to make money simply following analysts’ buy/sell ratings, plenty of information embedded in those ratings and earnings forecasts can help you make better investing decisions. You just need to know what to look for.
The Sentiment Index described later in this chapter helps you find out whether the stock you’ve been following would be better viewed as a growth or value candidate. A quick look at earnings growth forecasts and recent earnings surprises tells you a lot about a stock’s price appreciation prospects. Finally, you can use revenue forecasts, which most investors ignore, to gauge a firm’s real growth prospects.
Who Are the Analysts?
Stock analysts come in two varieties: buy-side and sell-side. Investment bankers, including most full-service brokerages, hire sell-side analysts to write research reports and issue buy/sell ratings and earnings forecasts for stocks they want to follow. Why are they called “sell-side” analysts? Originally, brokerages derived most of their income from commissions on stock sales, and the analyst reports and rating changes encouraged the brokers’ customers to trade more. Hence the term sell-side analyst. These days, investment banking accounts for the lion’s share of full-service brokerage income, but the sell-side label stuck.
Brokerages employ scores of analysts. Most cover a specific industry such as semiconductor equipment or restaurants. The analysts write research reports on the industry as a whole and on specific companies within the industry. Analysts publish sales and earnings forecasts; buy, hold, and sell recommendations; and target prices for companies they follow. They update those ratings and forecasts whenever one of their companies reports quarterly results, changes guidance (forecasts), or announces other significant news.
Sell-side analysts’ ratings and reports are widely distributed. Third parties including Thomson Reuters and Zacks Investment Research tabulate the analyst opinions and publish them in the form of analysts’ consensus ratings and forecasts for every covered stock.
Institutional buyers, such as mutual funds, pension plans, and other big players, read the sell-side analysts’ reports, but many also employ their own analysts. These “buy-side” analysts do their own research and arrive at their own opinions about a company’s prospects. Alas, you and I never see the buy-side analysts’ reports.
However, many stockbrokers offer clients access to sell-side analysts’ research reports published by one or two investment bankers. Those reports are worth reading if they are available for the stocks you follow.
Analysts usually publish an in-depth report describing the business model, industry, and competitive situation when they first start following a stock. After that, they typically publish short updates after earnings reports and conference calls or when other significant news breaks. The in-depth reports and short updates always include the analysts’ current buy/sell recommendation (rating), and earnings and sales forecasts for the current and next quarter and for the current and next fiscal year. Sometimes analysts issue short updates when they change their ratings or forecasts.
Analysts’ Ratings
The point of an analyst’s report is to advise clients whether to buy or sell a stock. But it’s not that simple. Many brokerages use different terminology to express the same opinion.
For instance, Goldman Sachs would put a stock on its Recommended List if it thinks the stock is going up in short order. But Merrill Lynch would simply label it a “buy,” JMP Partners would say “strong buy,” and Friedman Billings Ramsey would say “outperform.” The only way you can be sure of a specific ratings definition is to consult the brokerage’s rating explanation, which is usually included near the end of the report.
The terminology is not a problem when you’re looking at ratings compiled by Thomsen Reuters or Zacks. They figure out all of that when they sort the ratings into five categories: strong buy, moderate buy, hold, moderate sell, and strong sell.
When you look at the compiled ratings, interpret only strong buy ratings as meaning that the analyst is advising you to buy the stock. Anything short of strong buy means that the analyst is not excited about the stock’s prospects and wouldn’t add it to his own portfolio.
“Sell” Is a Four-Letter Word
Sell-side analysts are real people like you and me who happen to have very well-paying jobs. You can’t blame them for wanting to hold onto those jobs. Their employers, mostly investment bankers, derive much of their profits from helping client companies issue stock, make acquisitions, borrow money, and so forth. How much money is involved? Say an investment banker brings a new company public by underwriting its IPO. The underwriting fee is negotiable, of course, but think 7 percent. So a deal is worth 7 percent of $150 million, or $10.5 million, if the new company issues 10 million shares at a $15 offering price. When one company acquires another, both firms hire investment bankers to advise them on the transaction, incurring fees running into tens of millions of dollars.
With that much money involved, the competition to land these juicy contracts is intense. Naturally, the client—say, a new company going public—picks the investment banker it believes will do the best job, meaning the one who will sell the most shares at the highest price and, equally important, keep the share price up after the IPO. That’s important, because company executives own tons of shares they will eventually want to sell. That’s where the analyst comes into the picture. A highly regarded analyst’s strong buy recommendation can make a big difference in a stock’s trading price.
From an investment banker’s perspective, most public corporations are potential clients. The top executives running those corporations have plenty of incentives to keep the share price up. They may be on bonus plans tied to the share price, have stock options, or own shares outright.
You can understand why they would take it personally when an analyst’s sell rating tanks the share price. But they don’t just get mad; they can get even by diverting investment-banking business to another firm. Analysts understand that. Most don’t see anything to gain by advising selling a stock. Instead they say hold, neutral, or market perform, and the pros know that means sell.
On occasion, analysts do want to advise selling, but some investment banks don’t allow sell ratings. So, the policy of the analyst’s employer, not his view of the stock’s prospects, determines whether a stock will be rated hold or sell. Bottom line: Interpret hold, sell, and strong sell ratings as sell.
Consensus Ratings
As mentioned, Thomsen Reuters and Zacks compile analysts’ individual buy/sell ratings into a single consensus number for each stock. They do that by first assigning each individual rating to one of five categories: strong buy (1), buy (2), hold (3), sell (4), or strong sell (5). Each category has the numeric value shown in parentheses.
The compiler tabulates and averages the individual analyst ratings. For instance, if three analysts all rate a stock strong buy, the total is 3, and the average (the total divided by the number of ratings) is 1. That makes sense, but you need to be careful about how you interpret those numbers.
For instance, the consensus rating for a stock with one strong buy (1) and one hold (3) would be 2 (4/2), equating to a buy, even though neither analyst actually rated the stock a buy. As another example, say that two analysts rate a stock strong buy, and two advise selling. The consensus rating would be hold, even though none of the analysts gave that advice. Table 4-1 illustrates how the ratings are shown on Yahoo!’s Analyst Estimates report.
Table 4-1 Analysts’ Consensus Rating of 2.0 Equates to Buy Even Though None of the Six Analysts Following the Stock Rated It Buy
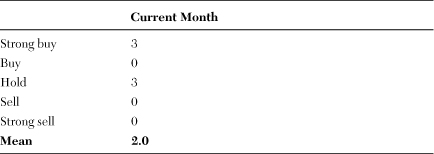
Despite the shortcomings, compiling consensus ratings this way enables you to get a sense of the ratings trend by comparing older ratings to the current value. For instance, you’d see that analysts are getting more excited about a stock if last month’s rating was 2.2 (weak buy) and this month it’s 1.8.
Here’s my rule of thumb for interpreting the consensus number:
1.0 to 1.5: Strong buy
1.6 to 2.4: Buy
2.5 to 3.5: Hold
3.6 to 5.0: Sell
Do Strong Buys Outperform Sells?
Since (in theory, at least) analysts spend all day evaluating stocks, making money in the stock market should be as easy as buying “strong buy”-rated stocks. However, little evidence exists to support that assumption.
Research on the subject is inconclusive. Some studies show that hold-rated stocks outperform strong buys, but other studies draw the opposite conclusion. In fact, there’s no solid evidence that strong buys even outperform strong sells. Maybe that’s because analysts issue many more buys than sells, and analysts can make some really dumb calls.
Think that’s an overstatement? Consider residential home mortgage maker American Home Mortgage, which filed for bankruptcy on August 6, 2007, essentially wiping out shareholders.
That was quite a comedown from January 26 of that same year, when AHM’s shares were fetching $34, and at least five stock analysts were advising buying the real estate investment trust (REIT).
Just the day before, the home mortgage maker had reported December quarter earnings $0.03 above forecasts. Besides blowing away December quarter estimates, American had captivated analysts with its $5.40 to $5.70 per share earnings forecast for all of 2007, far above the $4.85 analysts had been expecting.
So, on January 26, Deutsch Bank upgraded its rating to “buy” from “hold” and upped its target price by $2 to $34.50. Not to be outdone, RBC Capital reiterated its outperform (buy) rating and hiked its price target to $40 per share.
All of this unfolded against the backdrop of a collapsing residential real estate market. New-home sales were plunging, and on January 25, 2007, the same day that AHM issued its upbeat December quarter report, the news broke that used-home sales fell 8 percent in 2006 versus the year before, the sharpest annual decline since 1989.
Since AHM’s business was making mortgage loans secured by single-family homes, you’d think that the health of the residential real estate market would be relevant.
AHM specialized in a special type of mortgage called Alt-A loans. Unlike subprime loans made to borrowers with bad credit, Alt-A loans were supposedly made to borrowers with good credit scores. The catch was that Alt-A borrowers didn’t have to document their income, home values, how they obtained the money to make the down payment—anything. As an Alt-A borrower, you could say that you took home $50,000 per month, if that’s what it took to qualify for the loan, and not show any check stubs or tax returns to prove it.
All was well as long as homes were selling at ever-increasing prices. Of course, as everybody except the analysts seemed to know, by January 2007, that was no longer the case.
Nevertheless, on January 31, Ryan Beck raised its advice on AHM to “outperform” from “market perform.” AHM closed at $35 that day.
To their credit, on February 16, analysts at Bank of America reiterated their negative outlook and advised selling most mortgage lenders, including AHM. B of A seemed like a voice in the wilderness.
Only five days later, on February 21, Friedman Billings Ramsey, commenting on subprime lender NovaStar Financial’s disappointing December quarter results and guidance of little or no taxable income until 2011, reiterated its “outperform” rating on AHM. Friedman said AHM was a different story than NovaStar. Despite Friedman’s support, AHM shares dropped $1.80 to $30.80.
AHM shares continued drifting down and were changing hands in the $25 range by March 5, 2007, when AHM declared a $1.12 per share quarterly dividend. RBC Capital reiterated its “outperform” rating the next day.
A few days later, on March 14, Lehman Brothers noted that after examining its balance sheet, it had concluded that AHM was in a better position than other mortgage lenders to “manage through this challenging environment.”
On April 5, when AHM shares were still changing hands at $25 or so, Bear Stearns, one of the few heroes in this story, cut its rating to “underperform” from “peer perform.” Translation: Bear Stearns cut AHM to “sell” from “hold.”
Only four days later, on April 9, citing changing market conditions, AHM lowered its March quarter and full-year earnings forecasts by 55 percent and 25 percent, respectively, and said it would cut its next dividend by 38 percent.
On that news, Deutsch Bank, Friedman Billings Ramsey, and Lehman Brothers cut their ratings to “hold,” “market perform,” and “equal weight,” which all translate to “hold,” which, of course, means “sell.” Citigroup, already at hold, actually did cut its rating to “sell.”
With the stock trading at around $22, Citigroup cut its target price to $19, Deutsch cut its target to $24.50, and Lehman cut its target to $20.
Incredibly, on April 11, 2007, with AHM trading at around $22, AG Edwards, citing AHN’s safe dividend, upped its rating to “buy” from “hold.”
On April 30, with its share price back up to $25 or so, AHM announced March quarter earnings of $0.54 per share, below the year-ago $1.02, but above the $0.46 figure that analysts were expecting.
On May 1, in a public offering, AHM sold 4 million new shares at $23.75. Citigroup, which had set a $19 target price for AHM shares on April 5, handled the offering. Also on May 1, AG Edwards, citing valuation, cut its rating on AHM to “hold.” AHM closed at $23.15.
On June 28, AHM said it was establishing additional reserves for delinquent loan repurchases, would likely experience a loss in its June quarter, and withdrew its guidance (forecasts) for 2007. AHM closed at $20.91.
The next day, on June 29, Friedman Billings threw in the towel, cutting its rating to “underperform” and cutting its target to $15. Standard & Poor’s, noting that it believed the dividend secure, cut its earnings estimates but kept its “buy” rating (four stars). AHM closed at $18.38 that day.
On July 18, with AHM changing hands at $13 or so, Lehman Brothers, noting that AHM might cut its dividend again, reiterated its “hold” rating.
On July 20, RBC Capital, still rating AHM at “outperform,” said it expected the mortgage maker to generate sufficient income to cover a $0.60 per share quarterly dividend. RBC did lower its target price to $20 from $25. AHM closed at $12.80.
On July 30, AHM, citing unprecedented disruptions in the credit markets, said it would delay its next dividend. JMP Securities, Lehman Brothers, and Standard & Poor’s cut their ratings to versions of “sell,” while RBC Capital cut AHM to “sector perform” from “outperform.” AHM closed at $10.47.
On July 31, AHM in essence said it had run out of cash, couldn’t pay its current loan obligations, and couldn’t borrow more funds. AHM hired advisers to help evaluate its options, which included liquidating its assets. Its share price closed at $1.04.
On August 1, RBC Capital Markets reiterated its “sector perform” rating.
On August 2, AHM fired most of its employees; on August 3, it stopped accepting mortgage applications; and on August 6, it confirmed that it had filed for Chapter 11 bankruptcy.
The moral of the story is you’re on your own; you can’t rely on analysts to make your buy and sell decisions for you. But don’t go away. Important information can be gleaned from analysts’ ratings and forecasts.
Number of Analysts
Each analyst following a stock works for a different brokerage or investment banker. One brokerage may employ thousands of stockbrokers, and each of those brokers may have dozens, if not hundreds, of individual clients. Moreover, analysts’ research reports circulate to mutual funds and other big buyers. So each analyst’s report potentially reaches tens of thousands of investors. The mere issuance of an analyst report creates awareness of the stock in the investment community, regardless of whether the analyst advises buying or selling.
How many analysts follow a stock? Somewhere between 20 and 30 follow most well-known large stocks. For instance, in early 2009, Apple and Google both had 30 analysts, 24 were following Cisco Systems, and 23 were offering buy/sell opinions on Microsoft.
Smaller firms that have already attracted interest will have somewhere between eight and 17 analysts. For instance, flash memory market SanDisk had 16 analysts when I checked. Firms that haven’t yet garnered much attention may have coverage from only one, two, or three analysts.
The number of analysts following a stock is usable information, but how you interpret it depends on your investing strategy. For instance, value investors want stocks given up for dead by the growth crowd, who make up the bulk of the market. All else equal, analysts go where the action is and usually drop coverage when a stock goes into the tank. So the lack of analyst coverage signals a potential value candidate.
However, often everything isn’t equal. Sometimes analysts continue covering a troubled stock for business reasons. Distressed companies must often raise cash by selling operating divisions and issuing bonds, bank borrowings, and the like. Those sorts of activities generate big fees for investment bankers. The fact than an investment banker stuck with the firm and continued to provide coverage during the dark days might give it an edge in getting that business.
That’s why, in March 2009, down-and-outers such as Fifth Third Bancorp and Las Vegas Sands still had coverage by 19 and 17 analysts, respectively. But you can still spot out-of-favor stocks if you take a closer look at the ratings. For instance, here are the ratings distribution for the 17 analysts that were following Las Vegas Sands:
Buy: 1
Hold: 11
Sell: 3
Strong sell: 1
Most of the analysts covering Las Vegas Sands advised selling (holds and sells), and only one was at strong buy. So despite coverage by 17 analysts, you couldn’t say that there was much enthusiasm for Las Vegas Sands.
Sentiment Index
The analysts’ ratings tell you a lot about the market’s expectations for a company. For instance, you’d interpret the information differently if, instead of only one, 16 of the 17 analysts covering Las Vegas Sands were saying “strong buy.”
The Sentiment Index gauges the market’s enthusiasm or excitement for a stock, at least from the analysts’ perspective. It’s based on the premise that only strong buy ratings reflect analyst enthusiasm for the stock. Moderate buys signal disinterest, and holds, moderate sells, and strong sells all translate to “sell.” Calculate the sentiment score by adding points for strong buy ratings and subtracting points for holds and sells. Ignore moderate buys.
Sentiment Index Calculation
• Strong buy: Add up the number of “strong buy” ratings.
• Buy: Ignore.
• Hold, sell, and strong sell: Subtract a point for each of these ratings.
For example, a stock with three strong buys and no other ratings would score 3. A stock with three strong buys and three buys would also score 3, because the buys aren’t counted. A stock with three holds would score −3. A stock with three holds and one strong sell would score −4.
Interpret negative scores as meaning the stock is out of favor. Scores of 8 and above reflect strong enthusiasm.
Here’s an example of how the index works in practice. Transocean is the largest provider of deepwater oil and natural gas well-drilling services. In June 2007, crude oil prices were edging up but hadn’t yet gone into the stratosphere. Transocean was trading around $105 per share, and with 33 analysts following, it was hardly unknown.
Nevertheless, the market, at least as gauged by the analysts, wasn’t overly exuberant about the stock. With 15 strong buy ratings and 10 holds and sells, Transocean’s Sentiment score stood at 5. As you’ll learn shortly, this is close to the sweet spot for growth stocks.
By December 2007, however, crude oil prices were on the move, and Transocean was changing hands in the $130 to $150 range. By then, its Sentiment score, at 11, did reflect strong enthusiasm. Transocean peaked in the high $140 range in December and then dropped back to $125 in February. By then, its Sentiment score had dropped back to 5.
After that, crude oil prices skyrocketed and then plunged. By then, for Transocean, fundamentals didn’t matter. Its share price merely tracked crude oil prices, both up and down.
Here’s how to apply the Sentiment Index:
• Value candidates: Stocks with negative scores are clearly in the doghouse and are your best bets. Value-priced stocks with scores between 0 and 2 reflect weak sentiment and may also be value candidates.
• Growth candidates: Scores significantly below 0 (such as −4) reflect strong negative sentiment, and that doesn’t bode well for growth stocks. Sentiment scores of 8 or higher reflect high risk, but that doesn’t mean that they won’t trade higher.
Scores between −2 and 7 are acceptable, but I’ve found that growth stocks with lower scores—say, in the 0 to 4 range—have more upside potential than stocks with higher scores.
Analysts’ Estimates
Analysts’ consensus earnings forecasts are the single most important factor influencing stock prices. Changes in consensus forecasts often trigger major stock price moves. You can find analysts’ forecasts on many financial websites, but Yahoo! and Reuters show you more data than other websites, and both display all the information on a single page, making it easier and faster to access.
Earnings Growth Forecasts
Consensus forecasts—the numbers that determine whether a company’s stock moves up or down on report day—typically are simple averages of the individual forecasts.
For example, say four analysts publish forecasts for a company. Three expect $1 per share, and the fourth predicts a break-even quarter—that is, no earnings. The average of the four estimates is $0.75, even though no one expects the company to earn $0.75.
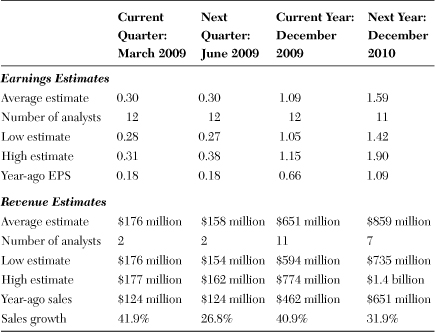
Using Yahoo! as an example, it displays consensus earnings per share (EPS) forecasts for the current and next quarter and for the current and next fiscal year (see Table 4-2). Yahoo! lists the number of analysts making estimates, the high and low estimates, and the year-ago EPS for each period. For example, 12 analysts made forecasts ranging from $0.28 to $0.31 per share for the March 2009 quarter. The consensus forecast (average) was $0.30. The company had reported $0.18 per share earnings in the year-ago March 2008 quarter.
Table 4-2 Example of Analysts’ Consensus Earnings and Revenue Forecasts
Considerable information can be gleaned from the earnings estimates data.
Forecast Spread
The difference between the high and low analysts’ estimates, 31 cents versus 28 cents, is typical for a current quarter. The June 2009 quarter and both fiscal years’ estimates show wider spreads, signaling that those forecasts likely will move closer over time. A wide spread (such as 5 cents or more) close to the announcement date indicates the likelihood of a significant earnings surprise.
EPS Growth
Table 4-2 shows that analysts expected earnings to grow 65 percent year-over-year in its December 2009 fiscal year (1.09 versus 0.66) and another 46 percent the following year (1.59 versus 1.09).
Growth investors should focus on stocks with at least 15 percent forecast year-over-year earnings growth. The strong year-over-year earnings growth forecasts qualify this stock as an attractive growth candidate.
Value stocks will likely have low or nonexistent forecast earnings growth. Consensus growth forecasts exceeding 5 percent signal relatively high expectations and would disqualify this stock as a value candidate.
Forecast EPS Trend
Consensus earnings forecast trends are even more significant than the forecasts themselves.
The forecast trend is the current forecast for a specific period—say, the current fiscal year—compared to forecasts for the same period one, two, or three months ago. A positive forecast trend tells you that analysts are becoming increasingly optimistic about the company’s prospects, and a positive earnings surprise is likely. Conversely, a negative trend raises the specter of further forecast reductions and bad news at report time.
Value Candidates
The best value candidates show flat or negative forecast trends. Positive forecast trends signal increasing enthusiasm, which means that it’s probably too late for that stock.
Growth Candidates
Stocks with flat (no trend) or positive forecast trends are valid growth candidates. But growth investors should avoid stocks with negative forecast trends.
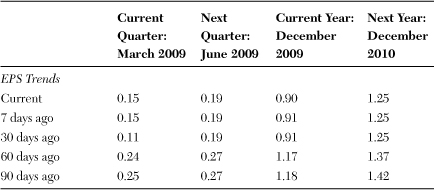
The EPS trends report shown in Table 4-3 shows consensus estimates going back 90 days for each of the two quarters and fiscal years covered. Pay most attention to the fiscal year numbers, because the quarterly results can fluctuate for a variety of short-term reasons. Ignore $0.01 changes.
Table 4-3 EPS Trends Report for a Strong Growth Candidate
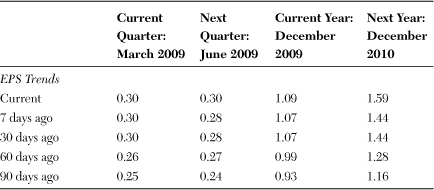
The report shows that analysts had been consistently increasing their estimates, reflecting a strong growth candidate. Most of your growth candidates won’t look this good.
Table 4-4 shows the numbers for a more typical growth candidate. The current fiscal year’s forecasts barely moved during the preceding three months, and the next fiscal year’s forecast moved up only 2 cents. The flat EPS trend signals less enthusiasm than we saw in Table 4-3, but that wouldn’t disqualify the stock as a growth candidate.
Table 4-4 EPS Trends Report for an Acceptable Growth Candidate

Table 4-5 tells a gloomier story. The earnings forecasts had been steadily trending down, and both fiscal year forecasts dropped substantially over the 90-day period. The negative forecast trends are red flags warning of further cuts and/or a negative earnings surprise. These trends, while unacceptable for growth stocks, would get value investors’ attention.
Table 4-5 Unacceptable EPS Trends Report for a Growth Candidate
Long-Term Earnings Growth
Many analysts, as a matter of course, estimate a company’s long-term (usually five years) average annual earnings growth. Those forecasts are averaged, and the long-term consensus earnings growth estimates are listed on many websites. These long-term growth forecasts are the G in PEG (P/E divided by expected earnings growth), the valuation method favored by many growth investors (see Chapter 5). Although they are widely used, nobody checks the accuracy of analysts’ long-term growth forecasts.
For instance, I’ve never heard of anyone looking up a particular analyst’s long-term earnings growth forecast for, say, Google from five years past and then comparing it to what actually happened.
Nevertheless, long-term consensus forecasts work great as an expectations gauge. High average annual growth forecasts reflect high expectations, and vice versa.
Value investors should favor candidates with 10 percent or less expected annual growth. Growth investors, however, should stick with stocks reflecting at least 15 percent long-term growth expectations; 20 to 25 percent is better.
Earnings Surprise
An earnings surprise is the difference between analysts’ consensus forecasts and the actual reported earnings. It’s a negative surprise when reported earnings come in below forecasts and a positive surprise when earnings beat forecasts.
Surprises are measured in cents, as in “a 2-cent positive surprise.” Most companies routinely report 1- or 2-cent positive surprises. Such amounts are not really surprises and don’t move prices much.
All else equal, a negative surprise of any amount drives the share price down, often sharply.
Positive surprises of 4 or 5 cents (or more) usually do move up the share price, although not nearly as much as a negative surprise forces it down. A big positive surprise—say, 10 cents—can have a more pronounced effect. Surprisingly, the surprise percentage isn’t as important as the number of cents. A 4-cent shortfall, such as when a company reports $4.04 instead of the expected $4.08, is about as significant as if the company reported $0.08 instead of $0.12.
Although the stock price reacts immediately, significant surprises often have a longer-lasting effect, because they force analysts to reevaluate their forecasts. For instance, analysts almost always increase their earnings estimates following a large positive surprise.
Although a stock reacts to the magnitude of the surprise in cents rather than percentage, some pros believe that in the event of a positive surprise, the surprise percentage does foretell future price action. That is, stocks with higher percentage surprises gain more in the ensuing months than stocks with lower percentage surprises.
History Lessons
You can see recent surprise history on many financial websites. Table 4-6 shows the data you need. It includes estimated earnings, actual reported earnings, and the difference (surprise) in cents for each of the last four reported quarters.
Table 4-6 Data Needed to Analyze the Surprise History
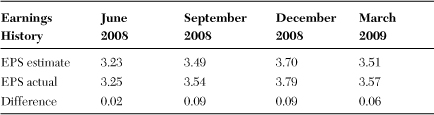
The data shows that the sample company, at least over the past year, had been a habitual positive surpriser. Based only on its surprise history, chances are this company will surprise again on the upside when it reports its current quarter’s results.
Conversely, a history of negative surprises signals risk that more bad news is on the way.
Value Versus Growth
Research has shown that, in the event of a negative surprise, growth stocks drop more, percentagewise, than value-priced stocks. That makes sense, because by definition, the market has high expectations for growth stocks and low expectations for value stocks.
For a value stock, a negative surprise is really no surprise, because most players already view the company as a loser. Conversely, growth investors expect their picks to surprise on the upside, so a negative surprise is a real surprise.
Research results are mixed on positive surprises. Some studies show that growth stocks outperform value stocks in the event of a positive surprise, while other research shows the opposite result.
Sales Forecasts
Although it may sometimes seem so, analysts just don’t pull their earnings forecasts out of thin air. Rather, they set up detailed earnings models, starting with sales forecasts. From those, they deduct estimated costs to arrive at their earnings forecasts.
While many financial websites display earnings forecasts, only two, Yahoo! and Reuters, also show consensus revenue (sales) forecasts. The availability of sales forecasts is an important breakthrough that many investors haven’t noticed.
Consensus sales forecasts are especially important when analyzing growth candidates. Without them, you wouldn’t know that a firm’s recent earnings growth was driven by a large acquisition or another one-time event and won’t be repeated. Other times, slowing sales growth estimates are your first clue that once-hot earnings growth is about to slow.
Table 4-7 shows the forecasts, as you would have seen during the September 2008 quarter, for a company with slowing sales growth. The company entered 2008 growing sales at a 25 percent year-over-year clip. That’s why the current-year forecast (2008) shows 20 percent growth, even though analysts forecast only 11 to 12 percent for the last two quarters of the year. The 2009 forecast shows that analysts don’t expect sales growth to pick up anytime soon.
Table 4-7 Revenue (Sales) Forecasts
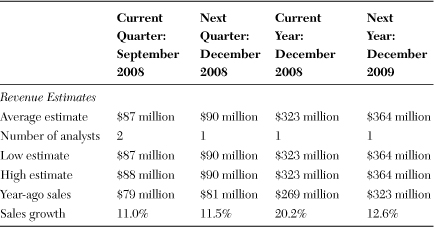
Chapters 11 and 12 describe in detail how to analyze sales growth forecasts.
Guidance Changes
Before the rules changed, company execs didn’t publicly reveal their sales and earnings expectations (guidance). Instead, they would privately advise a few favored analysts whether they expected to meet, beat, or fall short of published forecasts. That’s where the term “whisper number” came from.
In October 2000, the SEC’s Fair Disclosure rule (Regulation FD) outlawed such shenanigans. Now, management must announce guidance changes via press releases and/or in conference calls open to the public.
Since all analysts get the same news at the same time, consensus forecasts change immediately. Consequently, changes in guidance have the same effect on a stock price as an earnings surprise. However, so far as I know, nobody tracks management guidance changes the way they track surprises.
Oddly, even though they no longer exist, you still hear people talk about whisper numbers, and some websites continue to track them.
Research Reports
While I don’t suggest following analysts’ buy/sell advice, it’s worth your time to read their research reports. Many are filled with essential information about the company’s business plan, the problems it’s encountering, and the analysts’ take on the competition and industry trends. That’s valuable information that would take you days to dig up on your own. Moreover, sometimes an analyst reveals information in the write-up that doesn’t support his or her buy/sell rating.
While you can purchase analyst reports on various financial websites at $10 to $75 a pop, you can run up a big bill fast. However, many web brokers offer free research reports to their customers. I suggest starting with your broker’s offerings, and even consider opening a second account with a different broker to access additional free reports.
Summary
You probably won’t make money following analysts’ buy/sell advice per se. But there’s plenty of moneymaking information imbedded in their ratings and forecasts, if you know what to look for. Also, you can use analysts’ advice and forecasts to help you qualify viable value or growth candidates. Furthermore, analysts’ research reports can help you understand a company’s business and competitive standing. They often yield clues about the analysts’ real view of the company’s business prospects.