15. Quick Prequalify
There’s no point in wasting time analyzing stocks that don’t fit your investing strategy. In this chapter, you’ll learn how to rule out bad ideas early.
Concentrate on the Strongest Candidates
The best way to analyze stocks is to start with a large group of candidates and then eliminate the weakest contenders as soon as possible. This “survival of the fittest” strategy allows you to spend your time more efficiently by focusing on the strongest candidates.
In this chapter, you’ll learn how to weed out the obvious misfits early. They may be firms that are mostly hype and don’t have real sales and earnings, or they simply may not fit your requirements. You should be able to eliminate most bad ideas in less than five minutes once you get the hang of it.
You’ll probably end up eliminating 15 out of every 20 candidates if they originated from tips from TV pundits, magazines, friends, and so forth. The survival rate will likely be higher for candidates turned up by your own screens.
You could use many financial websites to do the analysis. I’ll demonstrate using Morningstar to analyze Buffalo Wild Wings. While Morningstar’s website has sections that require a subscription, everything I describe here is free.
Company Overview
Begin by determining the company’s line of business. Keep in mind that this is just a quick look, not a detailed analysis.
Morningstar’s Company Profile, found on its Snapshot page, gives you a quick overview, as shown in Figure 15-1.
Figure 15-1 Morningstar Company Profile for Buffalo Wild Wings
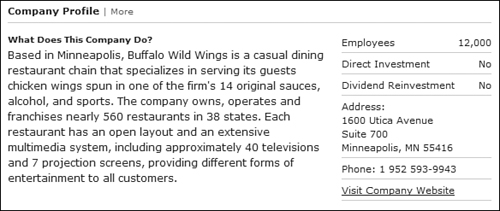
From Morningstar, you know that Buffalo is a casual restaurant chain. Moreover, its restaurants are basically sports bars with a limited menu emphasizing chicken wings.
Morningstar’s profiles usually include a link to the company’s website. Always check out those links. Five minutes on a company’s website will give you a better perspective on its business than you could get from Morningstar or any other analyst. Buffalo’s website makes it clear that Buffalo takes “casual” to the limit and is as much about the experience as the food.
Currently, with the economy in the dumps, low-priced restaurants are outperforming the overall market. Thus, considering only its market sector and current conditions, Buffalo would be of interest to growth investors who find its business plan appealing. Keep your personal feelings out of the equation. Whether or not you like chicken wings or watching sports on TV doesn’t matter.
Since Buffalo’s concept is in sync with current fashions and economic conditions, it would not make a very good value candidate. However, consumer tastes can turn on a dime. Remember the Atkins diet? Should the country take off on a low-calorie or healthy-eating craze, Buffalo, with its menu of wings, burgers, and ribs, would suffer. Then, it would be a potential value play.
At this point, discard candidates that don’t interest you based on industry sector or business plan.
While on the Snapshot report, also check market capitalization, which is how most investors gauge company size.
Market Capitalization
Market capitalization is how much you’d have to shell out to buy all the outstanding shares. You could compute it by multiplying the number of shares outstanding by the current share price. But you don’t have to do the calculation, because most websites list market cap.
Market capitalization categorizes a company as micro-cap, small-cap, mid-cap, or large-cap. No hard-and-fast rule defines those categories, but here are my rules of thumb:
• Large-cap: $8 billion plus
• Mid-cap: $2 billion to $8 billion
• Small-cap: $200 million to $2 billion
• Micro-cap: Below $200 million
To put the numbers in perspective, Table 15-1 lists some familiar names in each category.
Table 15-1 Market Caps of Well-Known Stocks
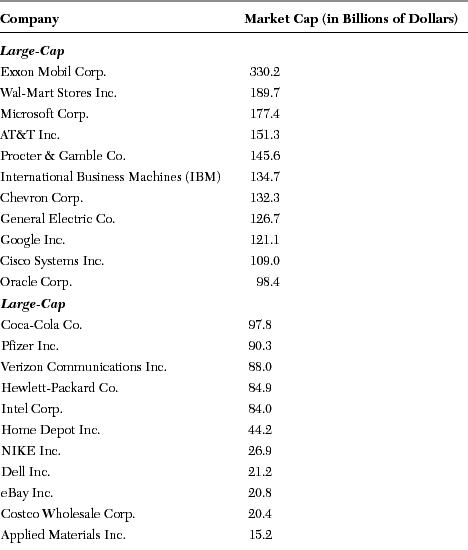
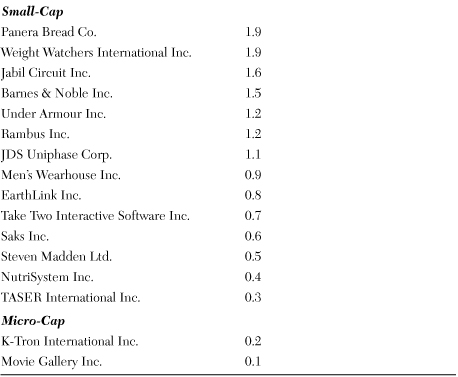
Morningstar listed Buffalo’s market cap at $686 million, putting it in the small-cap category.
There are no good and bad market caps. Large-caps generally are the safest category because they’ve usually been in business for years, are financially solid, and have already survived a variety of economic ups and downs.
Micro-caps and small-caps typically have the greatest growth potential because they are mostly emerging companies introducing new products or entering new markets. On the downside, micro-caps are too small to interest mutual funds and other institutional investors. Consequently, they don’t have much analyst coverage, making them difficult to research.
Which market caps have the best price appreciation prospects? Putting risk aside, the smaller the company, the greater the appreciation potential. However, you can’t put aside risk. In my experience, once you get below $500 million or so in terms of market cap, you are more likely to lose big than you are to score a big gain.
At this point, eliminate candidates that don’t fit your requirements in terms of market cap.
Valuation Ratios
Valuation ratios tell you whether the market is pricing your candidate as a value, growth, or momentum stock. Value stocks are usually former growth stocks that fumbled and are now out of favor with most market players. Growth stocks, which most investors prefer, are stocks expected to grow sales and earnings at least 15 percent annually, and often much higher. Momentum stocks are the subset of growth stocks that are the most in favor. They have already moved up in price substantially and have probably outrun their fundamentals. Thus, they are higher risk than other growth stocks. Nevertheless, they will likely continue to move up until something goes wrong.
Morningstar displays three valuation ratios—price/earnings (P/E), price/sales (P/S), and price/book (P/B)—on its Snapshot page. Each ratio has its pluses and minuses. However, at this point, your goal is to determine whether the stock you’re evaluating is being priced in the value, growth, or momentum category by the overall market. For that, the price/sales ratio is your best bet.
Here are my rules of thumb for using the price/sales ratio to determine the value/growth/momentum category:

Use these guidelines to rule out stocks that don’t fit your investing style. Since my guidelines are arbitrary, use them to avoid obvious misfits, not as a final arbiter of value. For instance, a value investor shouldn’t automatically reject a stock because its P/S is 2.1. However, it would be unusual to find a worthwhile value candidate with a P/S ratio of, say, 4.
Conversely, it’s unlikely that a growth investor would find a stock with a P/S of 0.5 that would survive the growth analysis. Growth investors will often find momentum-priced stocks almost irresistible, but caution is advised.
Consider current market conditions when applying these guidelines. In a bull market, all categories would be trading at higher price/sales ratios, and vice versa.
Morningstar listed Buffalo’s price/sales ratio at 1.7. Normally, a ratio that low would disqualify a potential growth candidate. But not when I researched this chapter in April 2009. Then, most stocks were trading at half their usual valuation ratios, if not lower.
Trading Volume
Trading volume, also referred to as liquidity, is the average number of shares traded daily. For trading volumes, higher is usually better. Lightly traded stocks—say, those trading less than 40,000 shares daily—often make big moves because of the actions of a single buyer or seller. Also, rumors posted on stock message boards can move lightly traded stocks.
Mutual funds and other institutional players who trade in big numbers cannot establish or unload meaningful positions in lightly traded stocks without disrupting the market. Consequently, they avoid those stocks. That’s an important consideration, because institutional buying pressure frequently moves up share prices.
At this point, rule out candidates with average daily trading volumes below 50,000 shares.
According to Morningstar, Buffalo, trading 608,000 shares daily, easily passed that test.
Float
Like so many other things, stock prices are subject to the laws of supply and demand. Stock prices move up when buyers want to buy more shares than sellers want to sell, and vice versa. Ideally, when good news hits the wires for a stock you own, you’d like to see buying demand overwhelm supply. Thus, in terms of supply, smaller is better, at least up to a point.
The supply side of the equation starts with the number of shares issued by the corporation. These are the number of shares outstanding. However, not all of the shares outstanding are available for trading.
Insiders, such as key executives, directors, and other large shareholders, can’t freely trade their shares. They can trade at only certain times, they must notify the SEC of their trades, and they have other limitations on their trading. Consequently, the insiders’ holdings are unavailable for daily trading. The float is the number of shares that are available for trading. It’s the total shares outstanding minus the insiders’ holdings.
Generally speaking, the smaller the float, the more upside potential when good news happens and buyers scramble for shares. However, a too-small float would dissuade institutional investors. As a rule of thumb, below 5 million shares is too small, and a 10 million to 25 million-share float is ideal. When I checked, more than 400 widely traded stocks met that criterion.
Buffalo’s 16.5 million-share float puts it in the sweet spot by that definition (data from Yahoo!’s Key Statistics report).
At this point, eliminate candidates with floats that don’t meet your requirements.
Cash Flow
Operating cash flow is the amount of cash moving into or out of a company’s bank account generated by its basic business. Very fast-growing companies often burn cash (negative cash flow) in their early stages. However, companies growing sales less than 25 percent annually should be generating positive cash flow. Growth investors should require positive operating cash flow for candidates growing annual sales less than 25 percent and would be well served by avoiding cash burners.
Value investors need candidates with a solid track record of producing strong cash flows, but they may not be doing so now, due to current problems. Therefore, value investors would not eliminate cash burners at this stage.
Morningstar’s 10-year Cash Flow report showed that Buffalo has generated positive operating cash flow every year since its 2002 IPO.
At this point, rule out candidates that do not meet your cash flow requirements.
Real Revenues + Real Earnings + Real Growth = Real Stock
Many stocks have great stories to tell. That may have a cure for cancer, faster Internet connections, more efficient solar panels—you name it. Sad to say, in most cases, those stories will never translate to meaningful revenues and earnings.
Your best bets are stocks that already have a track record of producing meaningful revenues and earnings, along with consistent growth in both departments.
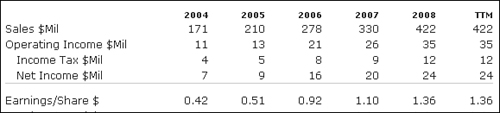
Morningstar’s 5-Yr Restated and Growth Rates reports give you the information you need to make that assessment. The 5-Yr Restated report is shown in Figure 15-2.
Figure 15-2 A portion of Morningstar’s 5-Yr Restated report for Buffalo Wild Wings. Access the report from the Financial Statements menu.
Revenues and Earnings
The 5-Yr Restated report shows, among other items, revenues (sales) and earnings per share for each of the past five fiscal years. Use this data to confirm that you are researching a real company with real revenues and real earnings.
Avoid companies with revenues of less than $40 million over the past 12 months (TTM). Since it’s unlikely that consistent money losers will survive your detailed analysis, check the earnings-per-share figures, and disqualify firms showing more unprofitable years than profitable years.
Buffalo Wild Wings, with TTM revenue of $422 million, and profitable during the last 12 months, as well as in every one of the five years listed, easily met those requirements.
At this point, disqualify stocks with insufficient revenues. Growth investors should also rule out candidates lacking a consistent earnings history.
Growth Rates
Next, check historical growth. Morningstar’s Growth Rates report, shown in Figure 15-3, lists year-over-year and three-, five-, and 10-year average annual growth rates for revenues, operating income, and earnings per share. You can access the report from Morningstar’s Key Ratios menu.
Figure 15-3 Morningstar’s Growth Rates report for Buffalo Wild Wings
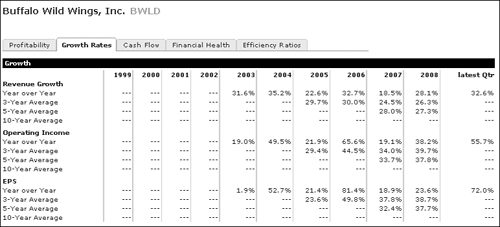
If you’re a growth investor, look for a minimum 15 percent year-over-year revenue growth in recent years; higher is better. Buffalo Wild Wings’ 28 percent year-over-year revenue growth for 2008 would get any growth investor’s attention. The 33 percent most recent quarter’s growth signals that growth might be accelerating. High 20 percent and accelerating revenue growth is about as good as it gets for growth investors these days.
Buffalo’s EPS growth is reasonably consistent with revenue growth, signaling that Buffalo is a well-managed company.
As good as Buffalo might look to growth investors, value investors would find nothing of interest here. For them, a busted growth stock such as laser vision correction center operator LCA-Vision would be of more interest (see Figures 15-4 and 15-5).
Figure 15-4 A portion of Morningstar’s 5-Yr Restated Report for LCA-Vision
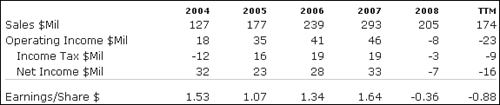
Figure 15-5 Morningstar’s Growth Rates Report for LCA-Vision
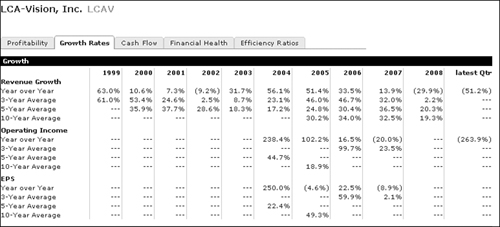
LCA-Vision got off to a slow start in 2000–2002, but growth took off in 2003, peaking at 50 percent year-over-year growth in the mid-2000s. From there, revenue growth and earnings slowly deteriorated until everything went wrong in 2008. However, 2008 was the year the entire economy nearly imploded. Thus, LCA-Vision would be worth a look as a value candidate.
At this point, rule out candidates with revenue and earnings growth histories that don’t meet your requirements.
Check the Buzz
There’s no point in digging into financial statements and calculating target prices if the competition just announced a new widget that obsoletes one of your candidates’ major products, a rating service just downgraded its bonds to junk status, or the FBI is investigating the company for Medicare fraud.
On the other hand, you’d probably redouble your research efforts if you knew that your candidate has a hot new product that is stealing market share from the competition.
Finding out the buzz could determine how you analyze a company and should be an early step in your research.
News Websites
Yahoo! Finance is the best website for recent company news. It displays headlines from a large variety of sources, but it keeps most of them in its database for only a couple of months. Clicking a headline brings up the entire story, but depending on the source, you may need to subscribe to the website to see the entire story.
MarketWatch has fewer sources, but it keeps headlines generated by MarketWatch writers in its database forever. However, once you go back a couple of years, only a small percentage of MarketWatch-authored headlines are clickable. Still, MarketWatch is your best free resource for researching old news on companies.
StreetInsider.com is a good resource for news going as far back as 2006 about a specific company’s earnings reports, guidance changes, and analysts’ reactions to those actions.
The Archives option on Google News (not Google Finance) is also a worthwhile resource for looking up old news on a specific company.
If you want to research a specific company’s old press releases, the company may maintain several years of press release archives on its own website.
At this point, if you’re a growth investor, disqualify stocks with significant recent bad news. On the other hand, value investors should discard candidates reporting a preponderance of recent good news.
Summary
Your time is your most valuable asset. Don’t waste it analyzing stocks that aren’t qualified candidates. Concentrate on your strongest candidates by eliminating bad ideas as soon as possible. This chapter described a few simple checks. You’ll probably add some of your own ideas as you gain experience.