5. Analysis Tool #2: Valuation
How much is a stock worth?
If we knew, making money in the stock market would be a snap. All we would have to do is buy undervalued stocks and then sit back and wait for them to move up to their “correct value.” Of course, it’s not that easy. Unless they pay significant dividends, stocks are like baseball cards. They have no value other than what another investor is willing to pay.
That said, countless stock valuation schemes are in use. Many originated when investors did buy stocks mainly for the dividends. Then, it made sense to value stocks based on the present value of their future payouts. While many investors still buy stocks for the dividends, that’s a separate topic. For growth and value stock investing, capital appreciation is the goal, and dividends, although welcome, usually don’t affect valuations much.
You’d think that, given that shift, analysts would have found new ways of valuing stocks. Some have, but many others still use the same formulas, simply replacing dividends with expected future earnings or cash flows. That’s great in theory, but in real life, who will buy your shares at an arbitrary price calculated by those methods?
There is no such thing as a “correct price,” because the greed, excitement, fears, expectations, and enthusiasm that determine today’s trading price are impossible to quantify. What you can do is evaluate the reasonableness of the expectations reflected in the current stock price. This chapter describes two ways to do that:
• Growth at a reasonable price (GARP)
The first, determining the earnings growth rate implied by a stock’s current trading price, although employed by many professionals, is unknown to most individual investors.
The second, growth at a reasonable price, applies only to growth stocks and is arguably the valuation formula of choice for individual investors and pros alike. Unfortunately, GARP relies on analysts’ forecasts. This goes a long way toward explaining why so many got it so wrong during the tech bubble days, the China stock bubble days, the oil stock bubble days, the solar stock bubble days, and on and on.
After reading this chapter, hopefully you’ll check the implied growth before you chase the next rocket. However, implied growth conveys only what is true today. You’ll have to calculate target prices (see Chapter 6) to find out what happens next.
Implied Growth
Benjamin Graham, sometimes called the father of value investing, proposed a practical and easily calculated formula for estimating the “intrinsic value” of a growth stock in his pioneering treatise on fundamental analysis, “Security Analysis.” It was cowritten with David Dodd and published in 1934. Don’t be put off by the algebraic formulas. I included them to impress you and justify the result. In the end, all you’ll have to do is look up implied growth in Table 5-1. Graham and Dodd defined intrinsic value as follows:
intrinsic value = EPS × [8.5 + (2 × forecast annual earnings growth %)]
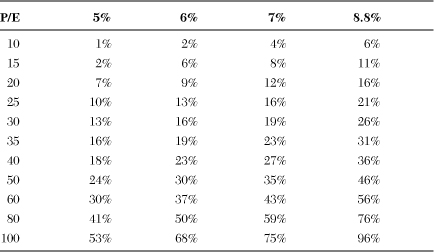
Table 5-1 Implied Annual EPS Growth Rates for Various AAA Corporate Bond Rates
where EPS is the last 12 months’ earnings per share.
Put into words, Graham said that a company’s intrinsic value is its latest 12 months’ earnings multiplied by a factor equal to 8.5 plus twice its projected annual earnings growth rate.
Later, Graham modified the formula to account for the notion that stock valuations vary inversely with prevailing interest rates. That is, stocks tend to trade at higher valuations when interest rates are low, and vice versa (see Chapter 2). Graham used AAA (highest quality) corporate bond rates as a proxy for prevailing interest rates. The AAA corporate bond rates were around 4.4 percent when he first devised the formula, so the revised version looks like this:
intrinsic value = EPS × (4.4 / AAA) ×
[8.5 + (2 × forecast annual earnings growth %)]
where AAA is the current yield of AAA-rated corporate bonds.
For example, if a company’s latest earnings were $1 per share, the bond yield was 5.5 percent, and analysts forecast 20 percent average annual earnings growth over the next five years, the intrinsic value would be
intrinsic value = $1.00 × (4.4 / 5.5) × [8.5 + (2 × 20)] = $38.80
The intrinsic value is $38.80, based on March 2009’s 5.5 percent corporate bond yield.
Graham’s intrinsic value hinges on analysts’ long-term earnings growth forecasts, which, as pointed out in Chapter 4, are probably wrong. Thus, although the intrinsic value calculation is an interesting exercise, it has little practical value.
However, Graham’s formula can be very insightful when used in another way. If you substitute the current stock price for intrinsic value, and implied earnings growth for forecast growth, and then do some algebraic manipulation, you get
implied growth rate = P/E (AAA / 8.8) − 4.25
Implied growth, as I’ve defined it, is the long-term average annual earnings growth that the company would have to achieve to justify its current P/E.
To gain further insight, assume for the moment that the AAA corporate bond rate is 8.8 percent. Then the formula is simplified to
implied growth rate = P/E − 4.25
For example, using the simplified formula, a P/E of 50 implies a 46 percent average annual earnings growth rate.
The implied growth rate corresponding to a particular P/E moves in tandem with the corporate bond rate. For example, the market supports higher P/Es when interest rates drop. Table 5-1 shows how it works out. You can use this table to look up the long-term average annual growth rate corresponding to your stock’s P/E. As you can see, the corporate bond rate makes a big difference. For instance, when the bond rate is 5 percent, a 50 P/E corresponds to a reasonable 24 percent annual EPS growth rate, but a usually unrealistic 46 percent growth rate for an 8.8 percent bond rate.
You can see the current AAA corporate bond rate at www.neatideas.com/aaabonds.htm.
What’s a reasonable annual earnings growth rate expectation?
It’s better to start with sales growth, because earnings figures can be impacted by all sorts of nonrecurring charges related to acquisitions, loan refinancings, lawsuits, you name it. Consequently, the average annual earnings growth you calculate will come out too high if you pick a starting year with significant nonrecurring charges or too low if your ending year has one-time charges.
Table 5-2 shows average annual sales growth over the past five years and past ten years for a few well-known growth stocks.
Table 5-2 Average Annual Sales Growth (Data as of 3/16/09)
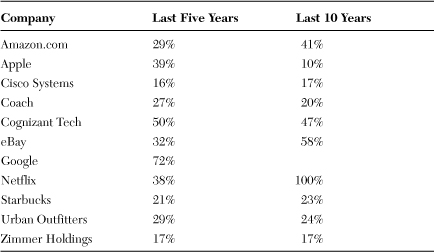
As a rule of thumb, expect 25 to 40 percent annual sales growth from newer, small companies with new products and 15 to 25 percent from larger, established firms. Expect annual earnings growth to exceed sales growth by 2 to 5 percent for newer companies and to be even with sales growth for established firms.
You can look up the current AAA corporate bond rate on the Financial Forecast Center (www.neatideas.com/aaabonds.htm). What corporate bond rates should you assume for the future? Use history as your guide. Table 5-3 shows historical ranges dating back to the 1920s. You can draw your own conclusions, but my take is that barring a period of runaway inflation, rates are likely to hover in the 5 to 9 percent range.
Table 5-3 Historical AAA Corporate Bond Rates
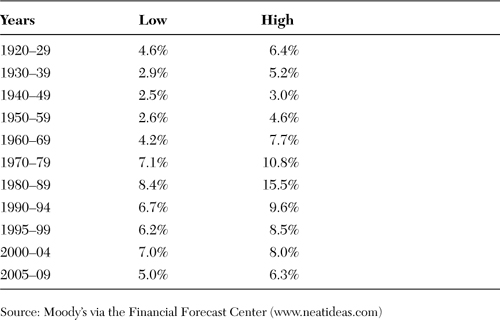
Table 5-1 gives you the earnings growth rate implied by your stock’s P/E. It’s up to you to determine the reasonableness of the implied rate. However, a little common sense goes a long way.
For instance, say you’re considering a value candidate with a 5 percent implied annual earnings growth rate. Based on your analysis, you expect the firm to achieve 10 to 20 percent annual earnings growth when it recovers from current problems. Thus, since it’s currently valued at 5 percent growth, all else equal, it’s a good candidate. You’ll make money regardless of whether the market ends up pricing it as a 10 or 20 percent grower.
Growth at a Reasonable Price
Many growth investors don’t spend much time worrying about the subtleties of stock valuations. Instead, they prefer a “keep it simple” philosophy. For them, valuation boils down to earnings and earnings growth.
These investors look for a balance between price and expected earnings growth. Specifically, they want to buy growth at a reasonable price. They determine the “reasonable price” by comparing a stock’s price/earnings (P/E) ratio to its expected long-term annual earnings growth rate.
PEG and Fair Value
A stock is said to be “fairly valued” when its P/E equals its expected growth rate, “undervalued” when trading at a P/E below its growth rate, and “overvalued” when trading above. For example, a stock expected to grow earnings 25 percent annually is fairly valued when it’s trading at a 25 P/E.
PEG is the acronym for the ratio of the stock’s P/E divided by the expected earnings growth:
PEG = P/E ÷ forecast annual EPS growth
The PEG is 1 when the PE and growth rate are equal, above 1 when the P/E exceeds the growth rate (overvalued), and below 1 (undervalued) when the forecast growth exceeds the P/E. While it makes sense that faster-growing stocks should trade at higher P/Es than slower growers, I’ve never found any research or mathematical formulas that show why a stock is fairly valued when its P/E equals its growth rate.
Thus, it’s understandable that growth investors, being pragmatic by nature, adjust their fair-value definition depending on market conditions. In strong markets, players consider stocks with PEGs of 2 (PE twice the earnings growth rate) to be fairly valued. In weak markets, they revert to defining PEGs of 1 as fair value. Adjusting fair value to the market makes sense. In the end, P/E measures the market’s enthusiasm for a stock, and most stocks trade at higher valuations during a bull market.
While the definition sounds precise, not everyone uses the same value of earnings or growth to calculate the P/E.
The E in P/E
Everyone agrees that the E in P/E is 12 months’ earnings, but which 12 months, and which earnings? Academics and individual investors often use the last four quarters’ earnings (trailing earnings). However, most analysts and many money managers use analysts’ consensus forecast earnings (forward earnings) for the current year. Since we’re evaluating stocks expected to grow earnings, forecast earnings are higher than historical earnings. Also, forecast earnings usually exclude one-time or nonrecurring charges, which reduce earnings. Thus, the P/E calculated using forward earnings usually is lower than the P/E calculated using trailing earnings.
Keep in mind that this isn’t rocket science. As you gain experience, you’ll develop your own strategies for evaluating P/E and PEG. As long as you’re consistent, it doesn’t matter which version of earnings you use to calculate P/E.
Growth Rate
The earnings growth rate, the G in PEG, could be historical long-term earnings growth, but most participants use analysts’ consensus growth forecasts. Here again, there’s room for discussion. Some use analysts’ five-year average annual earnings growth forecasts, while others prefer the current or next fiscal year’s growth forecasts.
Despite the inaccuracies, many professional money managers rely on PEG because it’s “close enough.” In their view, this isn’t rocket science. They’re not calculating PEG down to decimals. If the P/E is 20 and forecast earnings growth is 40 percent, the stock is undervalued. If forecast earnings growth is 20 percent and the P/E is 50, it’s overvalued. It’s that simple.
Realistic Earnings Growth Estimates
Successful emerging growth companies often chalk up supercharged earnings growth in early years. Sales are growing rapidly, but more important, many are near the break-even point, and gross profits are just beginning to exceed fixed costs. As revenues grow, higher percentages of gross profits fall to the bottom line, driving up earnings faster than sales.
Eventually, sales growth slows to levels similar to the firm’s market sector. When the market realizes that growth is slowing, the share price usually takes a massive hit, because investors value moderate-growth stocks much lower than rockets. The timing of the growth slowdown depends on the particulars, but it usually happens sooner than most expect.
Once a company is past that initial growth spurt, earnings growth, although volatile quarter to quarter, trends down toward the sales growth rate. That happens because a company can grow earnings faster than sales only by increasing its profit margins, and margin expansion opportunities diminish over time. That said, for the best companies you could probably expect annual earnings growth to exceed sales growth by approximately 10 percent on an ongoing basis. This means that a well-run company may be able to grow earnings around 22 percent annually on only 20 percent sales growth.
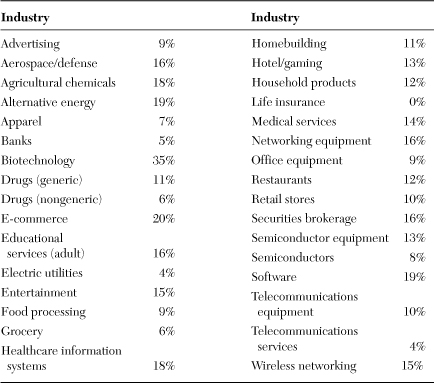
Table 5-4 shows expected annual sales growth rates for a few representative industries. The best companies exceed these industry averages by taking market share from weaker competitors. The forecasts assume normal economic conditions.
Table 5-4 Industry Expected Average Annual Sales Growth During Normal Economies
Dividends
The valuation formulas described in this chapter do not include value added by dividends, if any. You can account for dividends by dividing the annual dividend payout by the AAA corporate bond rate. For instance, if a stock is paying $1.00 per share annually, and the corporate bond rate is 7 percent, the value added by the dividend is $14.28 ($1.00/0.07). That equation assumes that the dividend payout will continue indefinitely at the same level. Dividends growing over time would warrant a higher valuation.
Summary
Market analysts all too often ignore the earnings growth expectations built into the current price when they tell us to buy their favorite stocks. But you can check the reasonableness of their recommendations yourself. Simply look up the current AAA corporate bond rate on the web and then find the growth rate implied by a stock’s P/E in Table 5-1.