10. Analysis Tool #7: Analyze Financial Fitness
Picking financially strong stocks is critical to investing success. This chapter describes how to achieve that goal.
Financial Fitness Counts
Stocks move up or down on a daily basis for any number of reasons. But in the long term, only two factors account for most stock losses:
• Earnings growth expectations drop.
• The market believes that the company is running low on cash and might file for bankruptcy.
Most analysts and individual investors concentrate on the first one and don’t worry much about the second.
For proof, look no further than Fannie Mae, Freddie Mac, or AIG. All three were taken over by the U.S. government in 2008 to prevent them from filing for bankruptcy. Yet, despite numerous warning signals and plunging stock prices, many analysts continued to advise buying these stocks until shortly before they imploded.
A company doesn’t have to file for bankruptcy to ruin your day. Just coming close would drive its share price into the ground.
Given the consequences, you’d think that financial strength would be an important consideration when market analysts decide on their buy/sell ratings. But all too often, it isn’t, so you’re on your own in this department.
Fortunately, the information you need to do the analysis is readily available. Moreover, you don’t have be a bond analyst to do the job. You only need to determine if a company is a potential bankruptcy candidate, not whether its bonds should be rated AAA or AA. The process is straightforward; anyone can do it. This chapter describes two different methods of evaluating financial fitness, depending on whether it’s a low- or high-debt firm.
Low-debt companies are relatively easy to analyze, while high-debt firms require spending some time with your calculator. Thus, if working with numbers is not your idea of fun, consider confining your candidate list to low-debt stocks. That shouldn’t be a problem—you’ll find plenty that fit the bill.
If you don’t want to do either of those analyses, we describe two alternative checks later in this chapter: looking up the firm’s current bond ratings, and checking to see if bond traders are pricing a risk premium into the firm’s bond prices, indicating perceived default risk.
Pinpointing Financially Challenged Companies
Bankruptcy candidates typically fall into one of three categories:
• Busted cash burners are newer firms that have never made it to the stage where they consistently turn a profit. They may have little or no long-term debt because they were originally funded via IPOs and follow-on stock offerings. Now they are running short of cash and can’t raise more.
• Overburdened debtors typically are large, mature companies with a history of using debt to enhance productivity. Then something happens and they can no longer generate sufficient cash to service their debt.
• Solvent and/or profitable companies may be established firms that file for bankruptcy to avoid crippling lawsuits, such as asbestos-related claims.
We’ll focus on tools to detect the first two categories. But neither would protect you from firms that misrepresent their financial condition. For instance, our analysis procedures would not detect that assets held are worth less than shown on the balance sheet.
Simplify the Problem
You can analyze low-debt firms using the Busted Cash Burner analysis, which is simpler than the Detailed Fiscal Fitness Exam required for high-debt firms. So the first order of business is determining whether your stock falls in the low- or high-debt category.
Measuring Debt
What’s the best way to measure debt? I suggest using the financial leverage ratio, often simply called “leverage” or “leverage ratio.” Whatever you call it, the formula is total assets divided by shareholders’ equity. The concept of using assets to measure debt probably sounds backwards, but it works. Here’s why.
If you do the algebra, you’ll find that financial leverage is also equal to 1 + TL / SE, where TL is total liabilities and SE is shareholders’ equity. In other words, financial leverage is total liabilities divided by shareholders’ equity, plus 1. So it’s equivalent to comparing liabilities to assets.
The advantage of using financial leverage instead of TL/SE is that you don’t have to do the math. MSN Money, Morningstar, Forbes, and possibly others do the calculation and list it on their financial ratios reports.
A leverage ratio of 1 equates to no debt, and the higher the ratio, the higher the debt. The median (as many stocks above as below) leverage ratio for all stocks is around 2.5. However, banks and other financial institutions carry higher ratios, typically between 5 and 15. For them, borrowed cash is their inventory.
The financial leverage ratio is a better debt measure than the more common debt/equity ratios. The debt/equity ratio counts only long-term debt, while the total debt/equity ratio counts both short- and long-term debt. You’d think that the total D/E would cover all the bases, but it doesn’t. Some firms list certain debt items in categories that don’t get counted by the D/E ratios. By contrast, the leverage ratio counts everything.
Table 10-1 lists the financial leverage ratios for Fannie Mae, Freddie Mac, and AIG as of June 30, 2008, shortly before they imploded.
Table 10-1 Financial Leverage Ratios
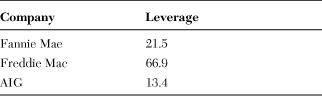
Table 10-2 lists the financial leverage ratios for the 11 publicly traded firms that filed for bankruptcy during the first three months of 2009. The ratios were taken from each firm’s last financial report before filing.
Table 10-2 Financial Leverage Ratios for Firms That Filed for Bankruptcy in Early 2009
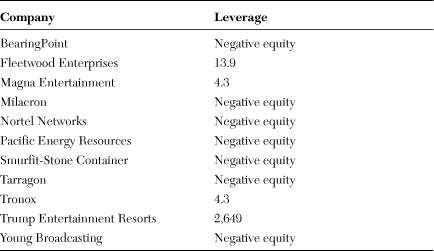
Negative equity means that liabilities exceed assets; in other words, the company is technically insolvent. However, that doesn’t necessarily mean that it is a bankruptcy candidate. That depends on whether it is generating sufficient cash to service or, even better, pay down its debt.
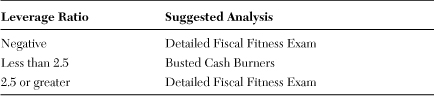
Use the leverage ratio to determine if you can apply the Busted Cash Burner analysis or if you need to do the Detailed Fiscal Fitness Exam. Table 10-3 gives the rules.
Table 10-3 Financial Leverage Ratio Determines the Required Fiscal Fitness Analysis
Detecting Potential Busted Cash Burners
Determining if a stock is a potential busted cash burner involves comparing its operating cash flow to working capital. The following sections explain what those terms mean.
Operating Cash Flow
Operating cash flow is the cash that moved into or out of a firm’s bank accounts as a result of its main operations during a specified period. Operating cash flow excludes cash flows resulting from adding or paying down debt, buying capital equipment, selling more shares, and so on.
It’s better to analyze operating cash flow than earnings, because a firm could be reporting positive earnings but still be burning cash (cash is flowing out, not in). The following sections describe three ways that could happen.
Example #1
Say that Company A reports a $1,000 sale to Customer B. Next, say that Company A recorded the $1,000 order as shipped, but Customer B hadn’t paid for the goods by the end of the quarter.
Following the rules, Company A records the $1,000 as a completed sale, deducts the product cost and other expenses, and logs the difference—say, $200—as net income. Because it hadn’t yet received any cash from Company B, Company A added the $1,000 unpaid bill to accounts receivables.
Thus, Company A showed the $1,000 sale and the $200 profit on its income statement, but it didn’t receive any cash from the customer. In fact, Company A actually spent $800 in real cash. Consequently, its operating cash flow was a negative $800.
Example #2
Let’s modify that scenario and assume that Customer B did pay before the books were closed. But to get the best prices, Company A ordered enough materials to build two of the products—say, $600 worth. So Company A had an extra $300 worth of materials in its inventory. Assuming that Company A paid cash for the materials, it ended up with $100 less in the bank ($200 net income (profit) on the product sold, less $300 for extra inventory). So it recorded $200 income on the sale, but its operating cash flow was a minus $100.
Example #3
Finally, assume a third scenario in which Customer B paid before the end of the quarter, but Company A had to buy a new machine costing $2,000 to produce the product. So Company A’s operating cash flow was $200, but after shelling out $2,000 in capital expenses, it was, in fact, $1,800 poorer for the transaction. Free cash flow is accounting terminology for operating cash flow minus capital expenses (plants and equipment). In this example, Company A’s free cash flow was a negative $1,800.
Since capital expenses generally are an optional expense, we’ll use operating cash flow to analyze potential busted cash burners.
Working Capital
Examining cash flow tells only half the story. You must also determine if the company has enough cash to run its business. For that, we’ll check working capital, which is current assets minus current liabilities. In accounting terminology, “current” refers to assets and liabilities that are short-term (less than one year) in nature.
Current Assets
Current assets include cash plus inventories and accounts receivables. It doesn’t include nonliquid assets such as buildings, capital equipment, and patents.
Cash includes cash in the bank plus short-term investments that can be readily converted to cash. Inventory includes finished products ready to be shipped to customers, raw materials, and partially built products (work in process). Accounts receivables are the monies owed by customers for goods that have been shipped but not paid for.
Current Liabilities
Current liabilities include unpaid taxes, accounts payables, short-term debts, and anything else the company will have to pay out during the next 12 months.
Comparing Current Assets to Current Liabilities
Working capital is simply current assets minus current liabilities, which is the cash available to run the business. Working capital is positive when current assets exceed current liabilities and negative when liabilities exceed assets.
Current ratio is another term that gives you the same information. Instead of subtracting, current ratio is current assets divided by current liabilities. The current ratio is greater than 1 when current assets exceed current liabilities and less than 1 when liabilities exceed assets.
Cash Burner Analysis
You can do the analysis using balance sheet and cash flow data offered by a variety of financial websites. However, Morningstar compiles the data into a readily usable format. Especially important, Morningstar displays the trailing 12 months (TTM) operating cash flow, a figure you need for the analysis.
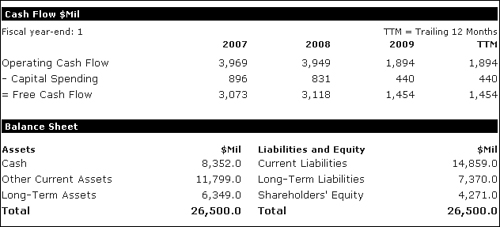
It shouldn’t take you longer than a minute or two to complete the entire busted cash burner analysis using Morningstar’s oddly named “5-Yr Restated” financial report, shown in Figure 10-1. Morningstar’s balance sheet breakdown lists cash and other current assets on separate lines. Calculate current assets by adding together those two items. Then calculate working capital by subtracting current liabilities from current assets. Using Morningstar’s terminology:
working capital = cash + other current assets − current liabilities
Figure 10-1 Morningstar’s cash flow and balance sheet breakdown for Dell as of March 2009. You can find it on Morningstar by selecting Financial Statements and then 5-Yr Restated.
Next, estimate the current year’s operating cash flow. Morningstar lists the last three fiscal years and the TTM operating cash flow. Usually, the TTM number is a good estimate.
However, you may need to modify it if the historical cash flows are inconsistent from year to year. For instance, say that the TTM cash flow is 30 but the last three fiscal years’ numbers are −50, 50, and −20, respectively. That much inconsistency makes the TTM number suspect. You have to exercise judgment in those instances. I’d probably estimate 0 current year operating cash flow in that case.
Based on the working capital and estimated operating cash flow, each company falls into one of four categories:
• Cash flow positive and working capital positive
• Cash flow positive and working capital negative
• Cash flow negative and working capital positive
• Cash flow negative and working capital negative
Cash Flow Positive and Working Capital Positive
This is the best result. You wouldn’t go wrong requiring that all your stocks meet this requirement. These companies already have enough working capital to pay their bills, and they are consistently adding more cash to the pile.
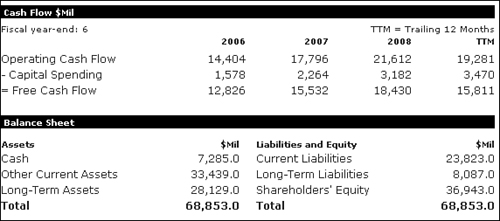
Software giant Microsoft’s March 2009 financials, shown in Figure 10-2, illustrate the point. The company had $7,285 million in cash and another $33,439 million in other current assets on its balance sheet. Subtracting the $23,823 million current liabilities left Microsoft with working capital of $16,901 million. Furthermore, Microsoft generated $19,281 million in TTM operating cash flow. Comparing the TTM cash flow to the last three fiscal years shows the TTM number to be reasonable.
Figure 10-2 Morningstar’s 5-Yr Restated report for Microsoft
There may be other reasons why Microsoft’s shares might not have been a smart buy, but from a fiscal fitness perspective, Microsoft looks like a winner.
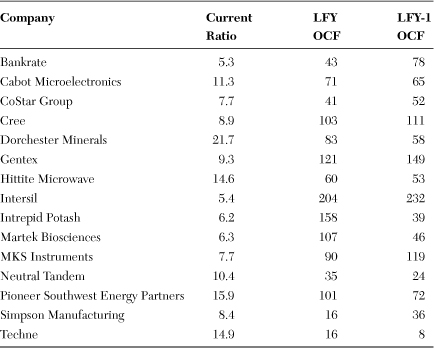
Table 10-4 lists 15 consistent positive cash flow generators that had strong working capital and carried virtually no debt. OCF stands for operating cash flow (in millions of dollars). LFY is the last fiscal year. LFY-1 is the previous fiscal year.
Table 10-4 Cash-Rich Stocks (Data as of May 15, 2009)
Cash Flow Positive and Working Capital Negative
These may be former cash burners that have turned the corner and are now generating excess cash. However, they are still in the hole in terms of working capital. To pass this test, current cash flow must be sufficient to overcome the working capital deficit.
Security software maker Symantec offers a good example (see Figure 10-3). As of December 31, 2008, Symantec’s balance sheet showed current assets of $2,943 million compared to $3,471 million in current liabilities, so in terms of working capital, it was $528 million in the hole.
Figure 10-3 Morningstar’s 5-Yr Restated report for Symantec
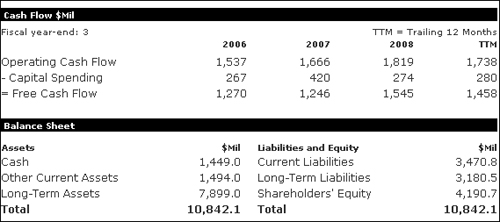
However, the company posted positive TTM operating cash flow of $1,738 million. Assuming that it keeps generating cash at that clip, it could make up the deficit in six months.
To pass this test, the estimated annual operating cash flow, at a minimum, should equal the working capital deficit.
Cash Flow Negative and Working Capital Positive
Most cash burners that you encounter will have positive working capital. In these instances, you need to estimate how long the company can continue operating at its present burn rate before it runs out of cash.
The best way to get a handle on that is to convert the TTM operating cash flow to a monthly burn rate (divide by 12) and then compare the burn rate to the working capital. For example, a company has a 10 months’ supply of cash if it’s burning $10 million monthly and has $100 million in working capital.
How much is enough? As a rule of thumb, a company probably has a good shot at surviving if it has enough cash to last at least two years. If its business plan makes sense, the firm is likely to attract more capital or, better yet, become cash-flow-positive in that time frame.
Conversely, firms with less than 12 months of working capital are in dangerous waters unless they can raise additional funds in short order.
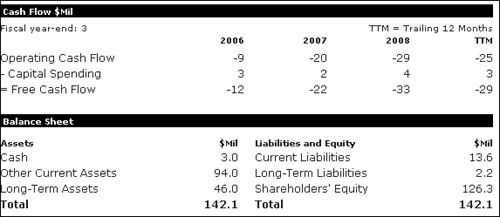
To illustrate, consider medical device maker Abiomed (see Figure 10-4). Abiomed had burned $25 million in the four quarters ending in December 2008, around $2 million per month. However, Abiomed had current assets totaling $97 million versus $14 million of current liabilities, so its working capital totaled $83 million, enough to last about 3.5 years at its current burn rate. With that much time, chances are that Abiomed would get its new products on the market before it ran out of cash.
Figure 10-4 Morningstar’s 5-Yr Restated report for Abiomed
Cash Flow Negative and Working Capital Negative
Companies in this condition are in bad shape; normally you wouldn’t find many in such dire straits. However, they were plentiful in 2008 and 2009.
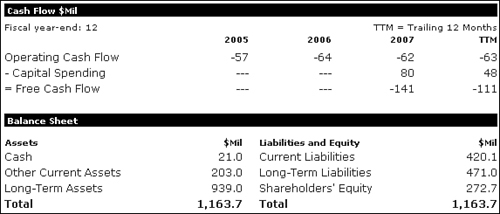
Racetrack owner Magna Entertainment is one such example. According to its September 2008 report, Magna had burned $63 million in the previous four quarters (see Figure 10-5), leaving it with a $196 million working capital deficit. Magna never got around reporting its December 2008 results. It filed for bankruptcy in March 2009.
Figure 10-5 Morningstar’s 5-Yr Restated report for Magna Entertainment
Simple Analysis Is Good Enough
This simple analysis assumes that the TTM cash flow burn rate will continue into the future, and that each company’s working capital will be completely converted to cash in time to pay its operating expenses.
In practice, a firm running close to the edge will figure out how to reduce its cash burn rate. On the other hand, not all of its working capital will convert to cash, not all of its inventory will be sold, and not all of its accounts receivables will be collected. In the end, the assumption errors tend to be self-canceling, and the estimate is close enough for our purposes.
Some Will Survive
Not all busted cash burner candidates will file for bankruptcy. Some will find additional financing, and others will be acquired.
You can do more research to identify likely survivors. Start by checking the news for each company. Firms that have found additional funding will say so in a press release.
If you don’t find out anything by checking the news, you could continue your research by reviewing each company’s SEC reports. But first you should decide whether your time wouldn’t be better spent locating more promising candidates.
Detailed Fiscal Fitness Exam
A landmark study done in the early 1990s showed that value-priced stocks outperformed growth stocks. Later, Joseph Piotroski, an accounting professor at the University of Chicago business school, took another look at that study.
He found that a few strong stocks accounted for the value portfolio’s outperformance. In fact, more stocks underperformed the market than outperformed.
Piotroski wondered about the relevance of a strategy that “relies on the strong performance of a few firms while tolerating the poor performance of many deteriorating companies.” For instance, say five stocks out of a hundred account for the outperformance. What are the chances of picking one of those outperformers if you buy only 10 or 15 stocks?
Piotroski reasoned that since value stocks got that way because something went wrong, many were financially distressed and might not survive. Piotroski wondered if you could boost the performance of the value portfolio by getting rid of the weakest players. To find out, he devised a simple nine-step test, using financial statement factors to evaluate financial strength.
Each step posed a question and awarded 1 point if the company passed. For instance, did the company earn money last year? Give it 1 point for a yes and 0 for a no. Same thing for operating cash flow—1 point if it was positive last year and 0 if not. The remaining seven questions looked at performance measures such as return on assets, gross margins, asset turnover ratio, working capital, and so forth. Each question was worth 1 point, so the total score ranged between 0 and 9.
Piotroski classified companies scoring below 5 as financially weak. Those that scored 5 and above were strong. He compared the performance of a portfolio limited to strong firms to a portfolio of all value-priced stocks. He found that the strong firms outperformed the all-stock portfolio by 7.5 percent annually. Most significant, he found that weak (low-scoring) firms were five times more likely to delist for performance-related reasons than strong firms.
You could use Piotroski’s formula to find value candidates. The American Association of Individual Investors (AAII) maintains a stock screen based on the formula in the Screens section of its website (www.aaii.com). However, with some modifications, Piotroski’s scoring system can be used to evaluate the financial strength of all high-debt companies, not just value-priced distressed firms.
I tested Piotroski’s scoring formula on a variety of stocks, both value and growth, and further researched the factors common to financially stressed firms. Based on that research, I devised a modified version that is applicable to a wide range of medium- to high-debt companies. However, it breaks down when applied to very low-debt firms, sometimes giving failing scores to financially solid companies that recently reported negative cash flow and earnings.
Consequently, the detailed fiscal fitness exam should be applied only to high-debt firms (financial leverage ratios of 2.5 or higher).
I’ll explain the modifications I made to Piotroski’s original scoring formula as I describe the revised version.
Measuring Fiscal Fitness
Piotroski’s scoring formula consisted of nine tests, each worth either 0 or 1 point. I modified some of his original tests and added two new ones. One of my new tests can have a score of −1, 0, or 1, and the other can have a score of 0 or 1. So the range of possible scores is from −1 to 11.
Piotroski grouped his nine tests into three categories: profitability, leverage and liquidity, and operating efficiency. All tests measure the company’s performance over a 12-month period—either the last four reported quarters or the last fiscal year. It’s easier to compute the scores using fiscal-year data, but the last four reported quarters’ data may be timelier.
Many of Piotroski’s tests involve comparing ratios at the beginning of the test period to the same ratio at the end. For instance, did the return on assets (net income divided by total assets) increase during the period? I take some shortcuts rather than computing the beginning and ending ratios. For instance, to find out if the ROA increased, I compare the percentage increase in net income to the percentage increase in total assets. It’s mathematically identical to comparing ratios, but easier to compute.
When computing the scores, always measure revenues, income, and cash flow over 12 months. For balance sheet items, such as assets and debts, always compare values at the beginning and end of the 12-month period.
The following sections provide detailed descriptions of Piotroski’s original nine tests plus the two that I added.
Profitability
Profits are, of course, the key to financial strength. Without profits, most companies would eventually fail. This section describes four profitability tests, each essentially identical to Piotroski’s tests. The first two determine if the company is profitable in terms of net income and operating cash flow. Tests 3 and 4 gauge the quality of the reported profits.
1. Net income: Net income is the bottom-line after-tax profit. Award 1 point if net income is a positive number.
2. Operating cash flow: Reported net income is subject to a variety of arbitrary accounting decisions. By contrast, operating cash flow measures real-cash profits. Award 1 point if operating cash flow is positive.
3. Return on assets: ROA (net income divided by total assets) measures management’s effectiveness in converting available resources into profits. Piotroski wanted to see a year-over-year increase in ROA. I measure that by requiring that the net income growth exceed the growth in total assets. Award 1 point if that condition is met.
4. Quality of earnings: Operating cash flow should exceed net income because depreciation and other noncash items subtract from income, but not from cash flow. If net income exceeds cash flow, noncash accounting entries may be inflating income. Award 1 point if operating cash flow exceeds net income.
Debt and Capital
Is the company sinking deeper into debt, or is it digging its way out? Tests 5 and 6 award points for declining debt levels. If debt dropped, was it due to profitable operations, or did the company raise cash by selling more stock? Test 7 penalizes companies that sold shares to raise cash. As a byproduct, the test also penalizes firms that issued shares to grow by acquisition, rather than organically.
5. Total liabilities to total assets: Comparing total liabilities to total assets measures the overall debt load. Increasing debt isn’t necessarily a problem for strong companies, but Piotroski, dealing mostly with financially distressed firms, preferred shrinking debt. I substituted total liabilities where Piotroski called for long-term debt, because TL counts debt that the long-term debt figure might miss. Award 1 point if the percentage increase in total assets exceeds the percentage increase in total liabilities.
6. Working capital: Current assets minus current liabilities. Piotroski looked for growing working capital to signal a strengthening balance sheet. However, there’s no reason why healthy companies should increase working capital beyond needed levels. I modified Piotroski’s requirement and penalize only companies with shrinking working capital.
The current ratio (current assets divided by current liabilities) measures working capital. The ratio is 1 when current assets equal current liabilities and increases when working capital increases. Award 1 point if the latest current ratio is equal to or greater than the year-ago ratio.
7. Shares outstanding: Figuring that they sold stock to raise cash or to make an acquisition, Piotroski penalized companies that increased the number of shares outstanding. However, employee stock options, a normal course of business, inflate the shares outstanding total, even if the firm didn’t use stock for acquisitions or to raise cash. Stock option activities typically inflate the number of shares outstanding by less than 2 percent annually. I modified Piotroski’s test to award 1 point if the number of shares outstanding increased less than 2 percent.
Operating Efficiency (Productivity)
These two tests, in effect, take the company’s operational pulse. Rising gross margins along with improving asset turnover signals that both the company’s competitive position and its productivity are improving.
8. Gross margin: Declining gross margins (gross income divided by sales) warn of a deteriorating competitive position, a problem regardless of the company’s financial condition. Piotroski rewarded firms with increasing gross margins, and I kept that requirement. Award 1 point if the gross margin (trailing 12 months) is higher than the year-ago figure.
9. Asset turnover: Asset turnover, which is revenues divided by total assets, is a productivity measure. Piotroski rewarded companies with improving asset turnover ratios. I implement the test by comparing sales growth to asset growth, and I award 1 point if the percentage sales increase exceeds the percentage increase in assets.
Added Tests: Current Financial Strength
Piotroski’s scoring system weighs factors that predict which way a firm’s fiscal fitness is trending (stronger or weaker). But he doesn’t discriminate between strong balance sheet firms and those on the ropes. That worked for identifying the stocks most likely to rise from the dead, which was his goal. However, extending Piotroski’s strategy to evaluate all stocks requires taking into account existing financial strength. It’s counterproductive to penalize firms for carrying high debt as long as they are generating sufficient cash to service the debt. To accomplish that, I added two more checks:
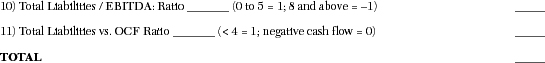
10. Total liabilities/EBITDA: A gauge favored by lenders, EBITDA measures income before deducting for interest, taxes, depreciation, and amortization. Credit analysts believe that EBITDA best measures the ability to service debt. Lenders often require debtor companies to maintain a specified debt/EBITDA ratio (typically 7 or 8). Failure to maintain the required ratio gives lenders the option to call their loans, meaning that they want their money back immediately.
Credit analysts use the debt/EBITDA ratio to gauge credit quality. They consider firms with ratios below 5 as investment-quality, qualifying them to borrow at the lowest rates. Analysts’ and lenders’ reliance on the debt/EBITDA ratio makes it more important than any other single factor, so I give it more weight. I substituted total liabilities for Piotroski’s total debt because it’s a more complete debt measure. Award 1 point to companies with ratios up to 5. Award 0 points for ratios of 6 or 7. Deduct 1 point for ratios of 8 or above.
11. Total liabilities to operating cash flow: This test awards firms that generate significant cash flows compared to their liabilities (cash flow at least 25 percent of total liabilities). They are in little danger of insolvency as long as that condition persists. Add 1 point if the TL/OCF ratio is less than 4.
Add up the individual test results to determine the test score.
A Passing Grade
In Piotroski’s original 9-point system, 5 points constituted a passing grade. My changes didn’t affect Piotroski’s passing criteria. I found that companies that ended up in bankruptcy court almost always scored between 1 and 4 points. This was based on my analysis of the most recent financial statements the company filed prior to filing for bankruptcy.
The goal is to highlight companies most at risk of facing solvency problems. Obviously, not all companies with low scores will end up in financial trouble, but all the troubled companies I analyzed had low scores.
Piotroski’s research found that, in terms of scores, higher is better. For instance, firms scoring 7 recorded better future performance than those scoring 6, and so on. However, Piotroski’s value-priced distressed-stock universe is not representative of all stocks. I haven’t found any evidence that 10-point stocks perform better than 6-point stocks.
Table 10-5 lists scores for the 14 largest publicly traded companies that filed for bankruptcy during the first three months of 2009. The Date column shows the date of the financial statements analyzed. For instance, 12/08 means that I analyzed data for the 12 months ending 12/31/08.
Table 10-5 Companies That Filed for Bankruptcy in Early 2009
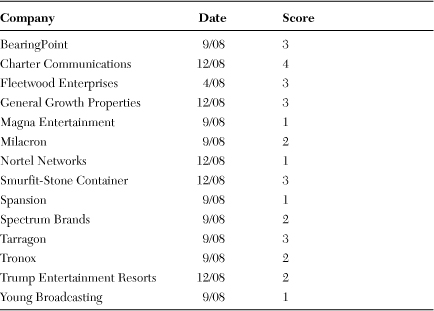
Table 10-6 lists the scores for 14 well-known stocks.
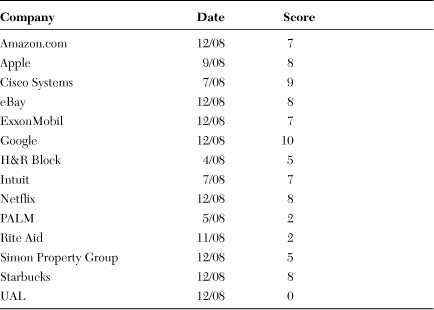
Of the stocks listed, only PALM, Rite Aid, and UAL scored low enough to qualify as bankruptcy candidates. The fact that Netflix scored higher than ExxonMobil highlights that once you get up to 6 or so, higher isn’t necessarily better. Keep in mind that these tests measure financial strength, not business outlook or stock appreciation prospects.
Computing Fiscal Fitness Scores
Computing EBITDA can be time-consuming, so if possible, use financial statements that do the math for you and display EBITDA as a line item. You also need to know the number of shares outstanding for each stock.
Smart Money (www.smartmoney.com), Forbes (www.forbes.com), MarketWatch (www.marketwatch.com), and CNN Money (money.cnn.com) all list EBITDA on their income statements and shares outstanding on their balance sheets.
A fiscal fitness worksheet is included at the end of this chapter. Make copies and use the worksheet to tally the scores when you analyze a company. The process looks formidable, but you should be able to score a company in less than ten minutes after you’ve done it a couple of times.
The worksheet is divided into two sections. The top section is used to gather the data and make necessary calculations, and the lower section is used to tabulate the scores.
Figuring Percentages
The worksheet requires two types of percentage calculations: simple percentages and year-over-year comparisons.
To calculate simple percentages, divide one number by the other. For instance, gross margin is gross profit divided by sales. If the gross profit is 10, and the sales are 25, the gross margin is
10 / 25 = 0.40 or 40%
Calculate year-over-year percentage growth by dividing the latest figure by the year-ago value, and subtract 1 from the result. For instance, if the recent value is 10, and the year-ago number is 7:
percentage growth = (10 / 7) − 1 = 1.43 − 1 = 0.43 or 43%
Do this calculation when A versus B is indicated—for instance, this year versus a year ago. Do all calculations in millions, and compute numbers to only one decimal place.
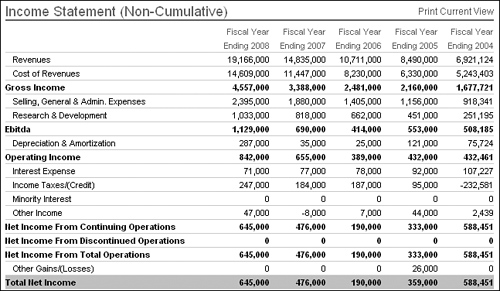
The following sections show a sample Fiscal Fitness Score calculation using Amazon.com’s December 2008 fiscal year results. Figure 10-6 shows the Smart Money annual income statement, which provided the data.
Figure 10-6 A portion of Smart Money’s display of Amazon.com’s annual income statement. Smart Money shows EBITDA as a separate line item, avoiding the need to calculate the figure.
Gathering and Calculating
The form is organized so that you can gather the needed data from the income statement, balance sheet, and cash flow statement in sequence. A sample Fiscal Fitness Exam Worksheet appears at the end of this chapter. The following sections break the worksheet into individual portions, using Amazon as an example.
Income Statement
The Income Statement portion of the Fiscal Fitness Exam Worksheet lists the following:
a) Record the most recent year’s and previous year’s sales (revenues), and compute the percentage increase. For Amazon, the sales figures were 19,166 million (latest) and 14,835 million (year-ago) for a year-over-year increase of 29.2 percent [(19,166 / 14,835) − 1]:
Sales Growth: TTM Sales vs. Year-Ago TTM Sales: 19,166 vs. 14,835 = 29.2%
b) Record the latest period’s gross profit (gross income on smart money) and sales. For Amazon, the gross profit was 4,557, and sales were 19,166:
TTM Gross Margin: Gross Profit / Sales (%): 4,557 / 19,166 = 23.8%
c) Repeat step b) using year-ago figures:
Year-Ago Gross Margin: Year-Ago Gross Profit / Sales (%): 3,388 / 14,835 = 22.8%
d) Record the EBITDA figure from the Income Statement:
TTM EBITDA: 1,129
e) Record the most recent year’s and previous year’s total net income, and compute the percentage increase. For Amazon, the income figures were 645 (latest) and 476 (year-ago) for a year-over-year change of 35.5 percent:
Net Income Growth: TTM Net Income vs. Year-Ago NI: 645 vs. 476 = 35.5%
Balance Sheet
Next, fill in the Balance Sheet data:
f) Record the latest and year-ago total asset figures, and compute the percentage change. For Amazon, the numbers were 8,314 (latest) and 6,485 (year-ago):
Asset Growth: Total Assets / Year-Ago Total Assets: 8,314 vs. 6,485 = 28.2%
g) Record the latest and year-ago total liabilities, and compute the percentage change. For Amazon, the numbers were 5,642 (latest) and 5,288 (year-ago):
Total Liabilities Growth: Latest TL / Year-Ago TL: 5,642 vs. 5,288 = 6.7%
h) The current ratio is the current assets divided by the current liabilities. By custom, the current ratio is not expressed as a percentage. This step computes the latest period current ratio. For Amazon, the current assets are 6,157 and the current liabilities are 4,746:
Current Ratio (latest): Current Assets / Current Liabilities: 6,157 / 4,746 = 1.3
i) Compute the year-ago current ratio. For Amazon, the year-ago current assets were 5,164, and the current liabilities were 3,714:
Current Ratio (year-ago): Year-Ago Current Assets / Year-Ago Current Liabilities: 5,164 / 3,714 = 1.4
j) The number of (common) shares outstanding at the end of each period is shown near the bottom of the balance sheet. Record the number of common shares outstanding for the current and year-ago periods. Multiply the year-ago figure by 1.02 (a 2 percent increase):
Shares Outstanding: Latest 428 million Year-Ago 416 million ¥ 1.02 = 424 million
k) Compute the ratio of total liabilities to EBITDA by dividing the total liabilities (item g) by the EBITDA (item d):
Total Liabilities to EBITDA ratio: TL / EBITDA: 5,642 / 1,129 = 5.0
Cash Flows
Only two entries are required on the Cash Flows portion of the worksheet:
l) The operating cash flow (net cash from operating activities) is listed about midway down the cash flow statement. Record the most recent four quarters’ (TTM) operating cash flow:
TTM Operating Cash Flow (OCF): 1,697
m) Compute the total liabilities to operating cash flow ratio by dividing the total liabilities (item g) by the OCF (item l):
Total Liabilities to OCF Ratio: 5,642 / 1,697 = 3.3
Tabulating the Score
That was the hard work. Now all that remains is filling in the blanks on the rating form.
The Tabulate Score section of the worksheet is divided into four sections: Profitability, Debt and Capital, Operating Efficiency, and Added Tests.
Profitability
The Profitability section of the worksheet shows the following:
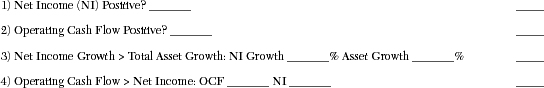
1) Net income: Use the TTM net income (item e). Score 1 point if the income is a positive number, no matter how small:
Net Income (NI) Positive? 645 = 1
2) Operating cash flow: Use the most recent year’s operating cash flow (item l). Score 1 point if it is a positive number:
Operating Cash Flow Positive? 1,697 = 1
3) Return on assets (ROA): Record the net income growth (item e) and the total asset growth (item f). Score 1 point if the income growth exceeds the asset growth (if the ROA increased). If both growth figures are negative, score 1 point if the NI growth dropped less than the asset growth:
Net Income Growth > Total Asset Growth: NI Growth 35.5% TA Growth 28.2% = 1
4) Quality of earnings: This test compares operating cash flow to net income. It’s a positive if cash flow exceeds net income and a negative if it doesn’t. This holds true even when both are negative numbers. For instance, it is still worth a point if net income is −$100 million but cash flow is only −$10 million. Score 1 point if operating cash flow (step 2) exceeds net income (step 1):
Operating Cash Flow > Net Income: OCF 1,697 NI 645 = 1
Debt and Capital
Next, fill in the Debt and Capital portion of the score:
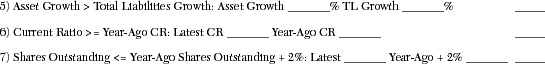
5) Growth of assets versus debt: It’s a positive if assets grow faster than debt, and vice versa. Award 1 point if the assets growth (item f) exceeds the total liabilities growth (item g). If liabilities growth is negative, award 1 point if asset growth is less negative than liabilities growth:
Asset Growth > Total Liabilities: Asset Growth 28.2%
Total Liabilities Growth 6.7% = 1
6) Working capital: Award 1 point if the latest current ratio (item h) equals or exceeds the year-ago ratio (item i):
Current Ratio >= Year-Ago CR: Latest CR 1.3 Year-Ago CR 1.4 = 0
7) Shares outstanding: Award 1 point if the latest number of shares outstanding (item j) is less than or equal to the year-ago figure plus 2 percent (item j):
Shares Outstanding <= Year-Ago Shares Outstanding + 2%: Latest 428
Year-Ago + 2% 424 = 0
Operating Efficiency (Productivity)
Next, record the Operating Efficiency (Productivity) scores:
8) Gross margin: Award 1 point if the latest GM (item b) exceeds the year-ago GM (item c):
GM > Year-Ago GM: GM 23.8% Year-Ago GM 22.8% = 1
9) Asset turnover: Ideally, sales should rise faster than assets. Award 1 point if the sales (revenue) growth (item a) exceeds total assets growth (item f). Both figures can be negative. In those cases, award 1 point if the sales shrinkage is less than the asset shrinkage:
Sales Growth > Asset Growth: Sales Growth 29.2% Asset Growth 28.2% = 1
Added Tests: Current Financial Strength
Finally, enter the scores for the Current Financial Strength tests:
10) Total-liabilities-to-EBITDA ratio: EBITDA is a measure of cash available to service debt and pay taxes. Thus, the lower the debt-to-EBITDA ratio, the better. Record the total liabilities/EBITDA ratio (item k). Award 1 point if the ratio is equal to or less than 5.0. Subtract 1 point if the ratio is 8.0 or higher, or if EBITDA is a negative number:
Total Liabilities / EBITDA: Ratio 5.0 = 1
11) Total liabilities compared to operating cash flow: Award 1 point if the ratio of total liabilities (item g) divided by operating cash flow (step 2) is less than 4.0. Score 0 if the ratio is 4.0 or higher or if cash flow is negative:
Total Liabilities / OCF Ratio <4.0 = 1: 5,642 / 1,697 = Ratio 3.3 = 1
Total Score: 9
Amazon’s 9 score signals that you don’t have to worry about the online retail giant’s financial strength—at least until its next quarterly report. Companies scoring 4 or less are risky from a financial fitness perspective and should be avoided. Firms scoring 5 or higher are not high bankruptcy risks, but that’s all the score means. No data shows that the stocks of high-scoring firms outperform lower-scoring stocks.
Bond Ratings
The fiscal fitness exam is a thorough analysis, but it takes some time and effort. Another way to get a reading on a firm’s financial health is to piggyback on bond analysts’ research.
Rating agencies, such as Moody’s Investors Service (www.moodys.com), Standard & Poor’s (www.standardandpoors.com), and Fitch (www.fitchratings.com), perform in-depth financial strength analyses of corporations that raise funds by issuing bonds or similar credit instruments. The company being rated pays for the analysis because it needs the rating to sell its bonds. So you won’t find bond ratings for companies that raise funds strictly by selling stock.
Don’t confuse bond ratings with the stock analysts’ buy/sell ratings. Unlike stock analysts, who are concerned mainly with earnings growth prospects, bond analysts focus on the company’s ability to service its debt. They evaluate financial statements, management quality, the competitive environment, and overall economic conditions. Where stock analysts are optimists, bond analysts—in theory, at least—focus on what can go wrong.
Bond ratings reflect the agencies’ view of the risk that a company will default on its bond payments. That information is important to stock investors as well as bond investors because a bond default always destroys the issuing company’s stock price. Also, the rating determines a firm’s access to, and its cost of, borrowing. A lowered bond rating can impact the company’s earnings by increasing its interest expenses, and lack of access to new borrowings can stifle growth or even drive a firm into bankruptcy.
The agencies use a combination of letters, numbers, and plus or minus signs, such as AAA, BA1, and B−, to rate corporate bonds:
• The combination of symbols used by each rating service varies somewhat, but AAA always indicates the highest quality rating, and any rating starting with A signifies high-quality debt. Three-letter ratings starting with B, such as BAA and BBB, indicate lower-quality debt than A ratings but are still considered investment-quality. Companies with A or three-letter B ratings probably could raise additional funds without problems.
• Two-letter B ratings, such as BB and BA1, signify noninvestment-grade or junk-bond securities. Corporations with bonds in the junk category may be able to raise additional funds, but this is problematic, and they will have to pay higher interest rates.
• Single-letter B ratings, such as B1, and all double or triple C-rated bonds, such as CC and CCC, signify substantial risk. Companies with bonds carrying these ratings probably couldn’t raise funds from normal sources.
• Single-letter C ratings indicate that the company has filed for bankruptcy, and D ratings signify that the company has defaulted on its bond payments.
S&P often adds a + or − to the rating to indicate that it falls at the top or bottom of its rating group. For instance, a + indicates that the rating falls at the top end. Moody’s adds the numbers 1, 2, and 3 to fine-tune their ratings, where 1 indicates rating at the top end of the range, 2 signifies midrange, and 3 indicates the lower end of the rating category. Rating agencies frequently place a rating on credit watch or under review if they are considering changing a rating.
Any A or triple letter B rating is good enough for our purposes, because it signals that the rating agency sees little risk of default. There is no evidence that stocks issued by AAA-rated companies outperform BBB-rated companies’ stocks.
Rating agencies also publish ratings that apply to the issuer’s general creditworthiness instead of to a specific bond issue. Moody’s uses the same rating codes for corporate credit as for specific bond issues, but S&P uses different codes for corporate credit:
• A-1, A-2, and A-3: Best or good quality
• B: Risky credit
• C: Riskier than B
• D: Already in default
You can see each of the three major rating services’ ratings on their own websites. However, it’s easier to use sites such as Finra (www.finra.org), BuySellBonds (www.buysellbonds.com), or the Securities Industry and Financial Markets Association website (www.investinginbonds.com). On those sites, you can frequently see all three major ratings, as well as the bond trading prices, at one time.
The downside of relying on bond ratings is that they can be too slow to change in fast-moving situations, or they can be wrong for other reasons. The rating services were famously slow to downgrade Enron’s investment-grade ratings until just a few weeks before the energy trader filed for bankruptcy in December 2001. The Enron debacle was a huge embarrassment for the rating agencies, and you would have thought that the experience would have compelled them to rethink their rating strategies.
But it didn’t happen. The agencies were equally slow to catch on to the problems brewing at mortgage insurers Ginnie Mae and Freddie Mac. The agencies kept them rated at investment grade until a month or so before the U.S. government took control of both.
Use Bond Prices to Identify Risky Debtors
As was the case with Enron, Fannie Mae, Freddie Mac, and others, bond buyers often know of problems before bond analysts change their ratings. When that happens, bond buyers demand a higher bond yield, or a risk premium, to compensate for the added risk before they’ll buy the bonds. Thus, a drop in bond prices often signals a change in the issuing firm’s fundamental outlook. So, a quick check on bond prices will give you a read on income investors’ take on a company’s outlook.
Bonds are usually sold in $5,000 denominations but are quoted as if the bonds were traded in $100 increments. For instance, a bond price of $105 means that the bond traded at $105 per $100 of face value, or at a 5 percent premium.
Most corporate bonds are bought and sold by individual dealers. Unlike stocks, there is no national quotation system for bonds, and you’ll find different quotes for the same bond on different websites.
The maturity date is the date when the issuing corporation must redeem the bond for its face value. Bonds with maturities of four years or less are termed short-term bonds, those with maturities of more than 12 years are deemed long-term, and those in between are medium-term bonds. When comparing a particular firm’s bond prices to other bonds, stick with similar maturity dates.
Most corporate bonds pay a specified fixed interest rate, called the coupon rate, based on the issue price. The current yield is the return rate a new buyer would receive. For instance, say a bond with a 6 percent coupon (original interest rate) is currently selling for $95. A new buyer would receive $6 in interest annually, which would equate to a 6.3 percent yield, since the buyer paid only $95 for the bond. The difference between the original (coupon) interest rate and the current rate also reflects the risk bond investors see in holding the bond.
A bond is callable if the issuer can redeem it before the maturity date. Most bonds are noncallable. Since callable and noncallable might trade at different prices, stick with noncallable bonds for your analysis.
Summary
Few would argue that checking a firm’s financial health should be done for every investment candidate. You’d think that stock analysts would take that step before advising investors to buy a stock, but since they don’t, you have to do it on your own.
You can simplify the task by sticking with low-debt firms showing positive cash flow and positive working capital. You can get a quick read on a high-debt firm’s financial health by checking its bond ratings, but the detailed Fiscal Fitness Exam is the best way to detect a potential financial basket case.
COMPANY __________________________ as of (financial statement date): __________
a) Sales Growth: TTM Sales _______ vs. Year-Ago TTM Sales _______ = ____%
b) TTM Gross Margin: Gross Profit _______ / Sales _______ = ____%
c) Year-Ago Gross Margin: Year-Ago Gross Profit _______ / Year-Ago Sales _______ = ____%
d) TTM EBITDA: _______
e) Net Income Growth: TTM Net Income _______ vs. Year-Ago NI _______ = ____%
f) Asset Growth: Total Assets _______ vs. Year-Ago Total Assets _______ = ____%
g) Total Liabilities Growth: Latest TL _______ vs. Year-Ago TL _______ = ____%
h) Current Ratio (Latest): Current Assets _______ / Current Liabilities _______ = ____
i) Current Ratio (Year-Ago): Year-Ago Current Assets _______ / Year-Ago Current Liabilities _______ = ____
j) Shares Outstanding: Latest _______ Year-Ago _______ Year-Ago × 1.02 _______
k) Total Liabilities to EBITDA Ratio: Total Liabilities (Latest) _______ / EBITDA _______ = _______
l) TTM Operating Cash Flow (OCF): _______
m) Total Liabilities vs. Operating CF Ratio < 4: TL _______ / OCF _______ = _______
Tabulate Score
Profitability
Debt and Capital
Operating Efficiency
![]()
Added Tests