
Once you have completed all your Kano surveys, you can summarize all the responses in an evaluation table, as shown in Figure 8.16 (note that this is only a partial image; the number of questions and customers should be considerably more than what is shown here):
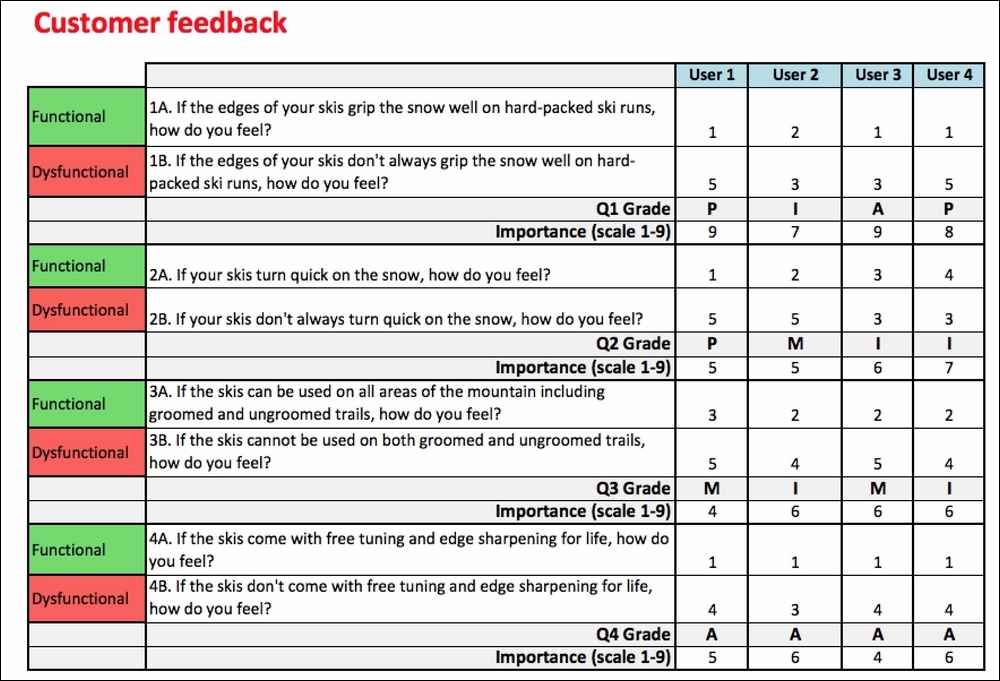
Figure 8.16: Evaluation table
Once we have collected all this feedback, we need to summarize it further. The easiest method is to evaluate and interpret the answers according to the frequency of responses, as shown in Figure 8.17. As you can see in this image, we total up the number of A, M, I, P, R, and Q to fill in this table. The final grade for each question is whichever response gets the greatest number of votes from all the customers who have participated in our survey. In this case, we see that having good edge grip is a Performance attribute, skiing on all areas of the mountain is a Must-Be attribute, and skis with free edge sharpening and tuning would be a product differentiator in the market with an Attractive or Delight attribute.
You will often find that you may have groupings of responses that point to two different results if you have not done adequate segmentation before administering the questionnaire. As an example, edge grip and the ability to ski on groomed and ungroomed trails might be Must-Be attributes for an expert skier, but novices might see edge grip as a Performance attribute and may be Indifferent to using the skis to ski on anything but a groomed trail:
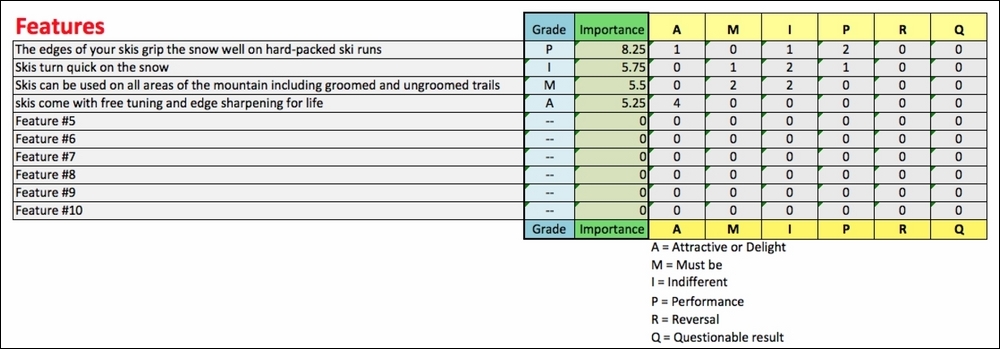
Figure 8.17: Frequency of responses
If the individual product requirements cannot be assigned to a specific category due to a large number of votes in more than one category, it is helpful to consider the following rule:
M > P > A > I
Simply put, the Must-Be requirements are the most important and will yield product dissatisfaction if not met, so in the case of a tie between Must-Be and something else, Must-Be wins. The next most important variables are the Performance characteristics, followed by the Attractive characteristics, and lastly the Indifferent characteristics. When deciding between various Attractive attributes in your product decisions, the decisive factor is how important they are to the customer. This can be determined by evaluating the self-stated Importance attribute in the customers' responses.
Based on this discussion, one might ask if there is any way to measure customer satisfaction using the tools in the Kano model. Fortunately, Charles Burger and his associates determined a way to leverage the Kano model to help us understand the level of customer satisfaction when a specific attribute is present and the level of customer dissatisfaction when a specific attribute is missing.
They determined that the best way to calculate the level of customer satisfaction is to add the Attractive and Performance columns, and divide by the total number of Attractive, Performance, Must-Be, and Indifferent responses. For the calculation of the average impact on Dissatisfaction you would add the Must-Be and one-dimensional columns, and divide them by the same divisor as in the previous example:
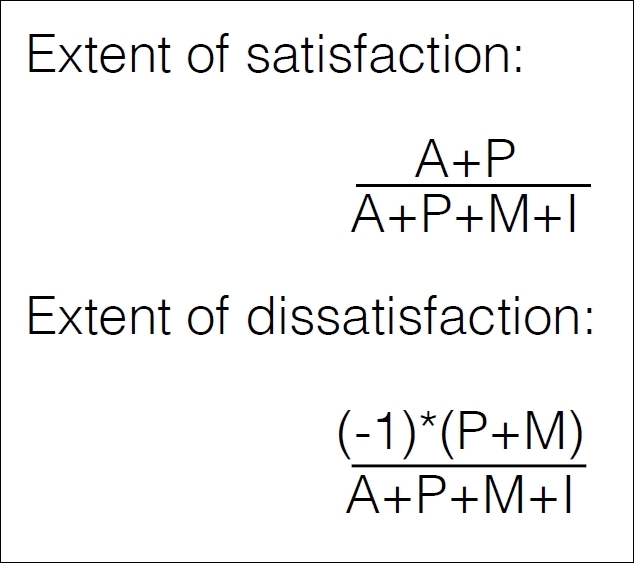
Figure 8.18
The dissatisfaction equation is multiplied by (-1) in order to emphasize the negative influence on customer satisfaction if this attribute is not fulfilled. The extent of satisfaction ranges from 0 to 1; the closer the value is to 1, the more the attribute influences customer satisfaction. A customer satisfaction score close to 0 signifies there is little influence on customer satisfaction resulting from this attribute. For the customer dissatisfaction score, if the number approaches -1, the influence of this attribute on customer dissatisfaction is very strong if the attribute or feature is not fulfilled. A value close to 0 signifies that this feature or attribute will not cause a great deal of customer dissatisfaction if it is not met. The completed satisfaction/dissatisfaction table is shown in Figure 8.19:
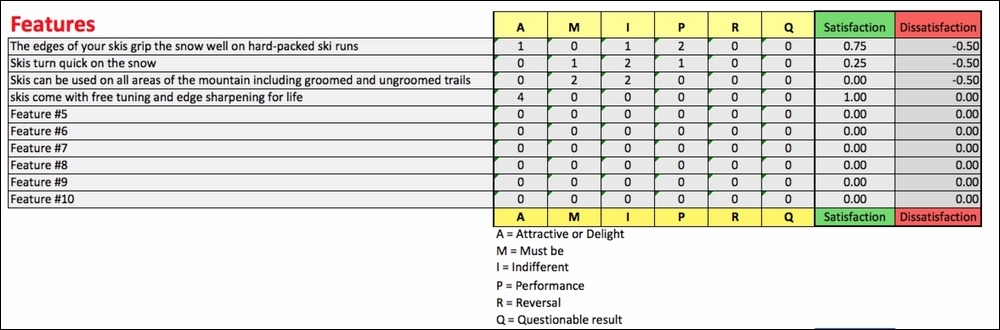
Figure 8.19: Satisfaction/dissatisfaction table
Using the aforementioned techniques, you should have a good idea of your customers' priorities. You now have an understanding of your customers' priorities, their must-haves, the things that could drive satisfaction by being improved, and the differentiators that could delight your customer. The next step, although optional, can also provide a little more illumination in terms of how importance can drive increased satisfaction. I find it is worthwhile to multiply the satisfaction and dissatisfaction scores by the importance score. This should give you a more weighted view of the customer satisfaction score (as shown in Figure 8.20):
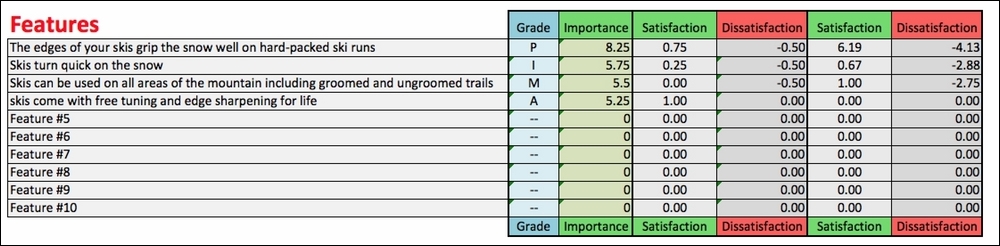
Figure 8.20: Weighted satisfaction/dissatisfaction table