
Now that we have developed a consistent way of putting our requirements down on paper for the rest of the organization to understand, we must now work to develop a way to express our requirements to engineering. This must be done so they can understand what it is we are asking for, what must be done by the organization to fulfill those requirements, and who will do it and when, so they can go about creating our new product.
To do this, we will turn to a tool called QFD. QFD originated in Japan in the late 1960s, during a time when Japan was trying to break away from its notoriety of product development through copying and imitation, to a product development process based on originality. At that time, the Japanese automobile industry was in a state of evolution, as they were growing rapidly and needed to create multiple model changes to keep up with demand. As a result, Japanese companies began to understand the importance of design quality to ensure the rapid developments would not fail when they were delivered to the end customers. Unfortunately, there was no process to impart design quality into the front end of a product, only a way to check quality at the end of the line during manufacturing, after the new products were already produced.
This new concept is called hin shitsu (Quality), ki nou (Function), and ten kai (Deployment) – that's Quality, Function, and Deployment, which we have acronymized to QFD. While the translation means little to us on the surface, the three words taken together mean meeting customer requirements, determining what must be done to meet the requirements, and who will do what action at what time to meet the requirements.
The concept of QFD originated in the late 1960s, but it was not until 1972 in the Mitsubishi Kobe Shipyard in Japan, where they were building supertankers, that it was fully deployed. The new process by Mitsubishi ensured that every step of the construction process would be linked to fulfilling a specific customer requirement. As each need was identified, the design team developed potential solutions to solve the customer's identified need. The needs were called the "Whats" and the means of addressing the need were called the "Hows."
The team began by thinking there was a clear one-to-one relationship between each What and each How. Unfortunately, it quickly became apparent that many times the Hows impacted more than one What, and often in very conflicting ways, as shown in Figure 9.1:
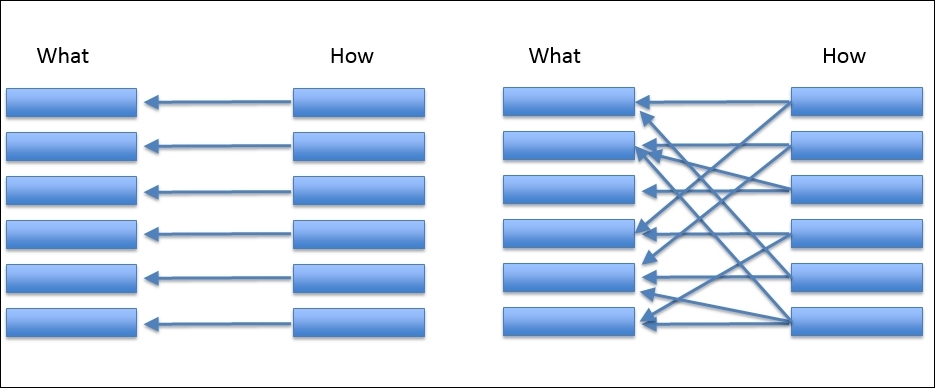
Figure 9.1: Whats versus Hows – originally conceived versus reality
To overcome this, the team at Mitsubishi put customer demands on the vertical axis of a matrix (the Whats) and the methods by which these demands would be met (the Hows) on the horizontal axis of the same matrix, to see the relationships of the methods in relation to the various customer demands:
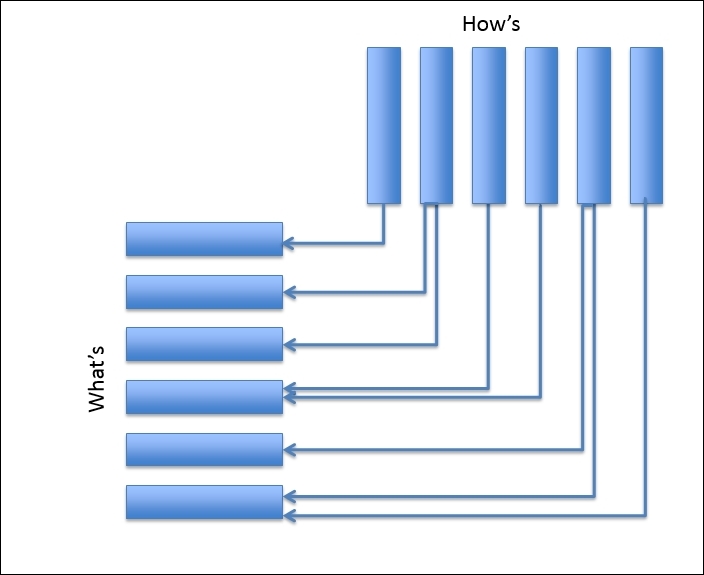
Figure 9.2: Interrelationships of methods and customer demands
This was recognized as a breakthrough in the way to visualize customer needs versus product development. The process was widely adopted by many Japanese and global companies, including Toyota, Nippondenso, Nissan, Komatsu, Honda, Ford, GM, Chrysler, HP, Xerox, Dow, and many more. Since that time, QFD has progressed well beyond a two-axis matrix simply showing Whats and Hows, and now has the ability to present a number of design considerations in a graphical form. Additionally, it was discovered that QFD could also be an effective tool in developing component requirements, operational requirements, and working procedures resulting in aiding communication between design and manufacturing departments, identifying potential failure modes, developing new technologies, and reducing product cost.
QFD is often presented using a QFD matrix otherwise known as the House of Quality. The term "House of Quality" originated as the structure of the diagram resembles that of a house. The House of Quality uses a planning matrix whereby we can define what a customer "wants" versus what the organization is willing and able to deliver. A basic House of Quality matrix has the following form:
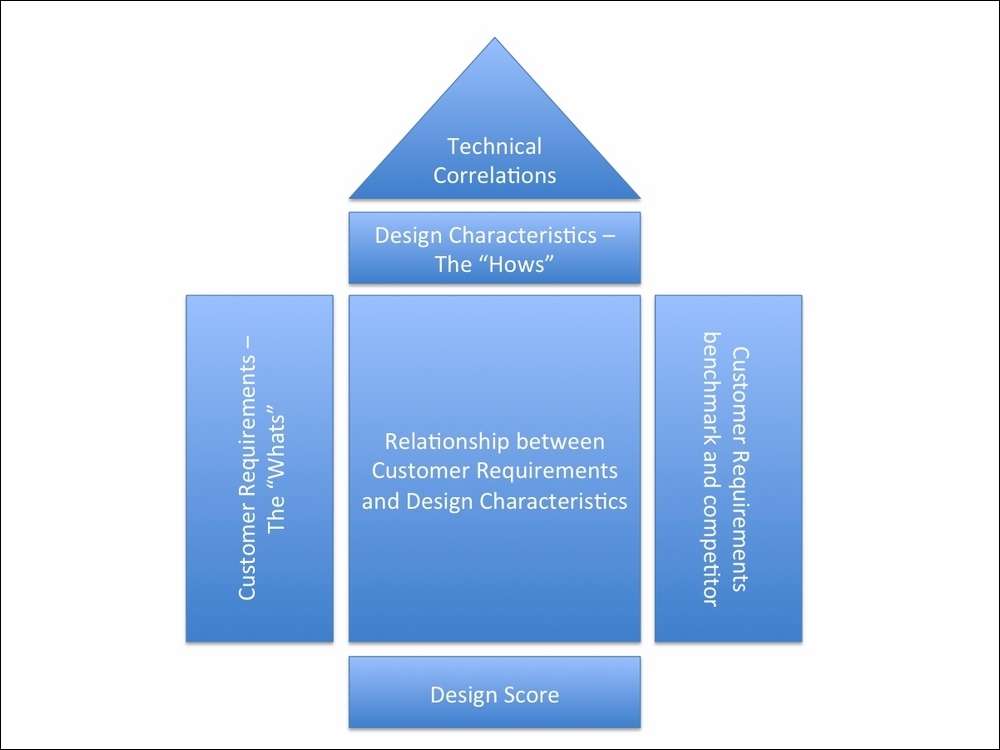
Figure 9.3: The House of Quality
The main sections of the House of Quality are as follows:
- Customer requirements: The "Whats" – this is the first section of the House of Quality (HoQ) to be completed, and is a structured list of the customer's requirements generated through the VoC.
- Customer requirements benchmark and competitors: Quantifies the customer's requirements and the performance of competitive products.
- Design characteristics: The "Hows" – this section is also referred to as the "Voice of the Company" and is generated by the design team who identify all the measurable characteristics of the product that they perceive are related to meeting the customer's requirements.
- Relationships between customer requirements and design characteristics: This section allows the design team to quantify the interrelationships between the customer requirements and the design characteristics. This is the most critical part of the HoQ and is the most time-consuming.
- Technical correlations: Used to identify where the technical design considerations support or impede one another.
- Design score: This is the last section to be completed, and it summarizes the results from the HoQ and may also include technical priorities, competitiveness, and potential targets.
To better understand how one can use QFD and the HoQ in a real-world situation, it may be best to use an example for illustrative purposes. The example we will use was originally developed by the University of Warwick, but I have taken the liberty of updating the content with changes in technology, market demand, and my own viewpoint.
In our example, we will take the role of an airline seat manufacturer, and discuss the steps we would undertake in our VoC and QFD process to design a seat to be marketed to the airlines. To begin the QFD, we will leverage all the work we have done previously in our VoC research. As a summary, we must:
- Determine the targeted market segments
- Determine who is our customer and the customer value chain (our customer's customer)
- Create a list of customer requirements through various VoC processes in the customer's own words
- Consolidate and rewrite customer requirements based on the first section of this chapter
In our example, we have already determined our market segment and potential customers as the airline companies servicing the economy flier market. Our customer's customers are their economy passengers. The potential list of requirements for our customer and our customer's customer, which we have generated from our VoC, might look like the following:
- Customer must "feel" safe in the seat
- Fire-retardant material
- Built-in life preserver
- Quality seatbelt
- Meets all FAA regulations
- Color consistent with brand
- Low purchase price
- Easy to retrofit
- Durable material
- Lightweight
- Easy to replace
- Easy to move
- Low profile, allowing more passengers per plane
- Easy to clean
- Stain-resistant fabric
- Will not soak up spillages
- Moveable armrest
- Wide armrest
- Plentiful legroom
- Lumbar support for all body shapes
- Knees do not hit seat in front
- Seats do not hit passenger behind
- Seat back can be adjusted
- Seat back adjustment will not slip
- Seatbelt feels secure
- Seat feels stable and does not bend easily
- Pleasant color
- Clean
- Not stained
- Enough room to use laptop fully opened
- Tray is easy to pull out/push back in
- Magazines easy to remove/replace
- Place for water bottle
- Tray indent or hole for coffee
- Built-in entertainment for long haul flights
- Stream to own device (iPad, phone) for shorter flights
- Good selection of current movies, TV, and music
- Power for laptop
- USB power for phone/iPad
While it is great to have such a rich set of input from our customers, we also need some way to prioritize and assign how important each of these characteristics are to the customer, or else all will be treated as equal. Without some way to understand the relative importance of one item to another, we will end up allocating our resources like peanut butter, and ultimately, the customer will not get what he or she needs.
To do this, we will undertake an affinity process. During this process, we will place each requirement on a card and use the affinity process to group these requirements into like groups, and then create secondary requirements. This could include groupings for "Passenger comfort in the upright position", "Passenger comfort in the recline position", "Purchase price", "Entertainment", "Ergonomics", and so on.
Performing another affinity process on the secondary groupings would yield our primary groupings of "Passenger comfort", "Safety", "Human factors", "Technology", and "Cost".
In our example, this might look like the following:
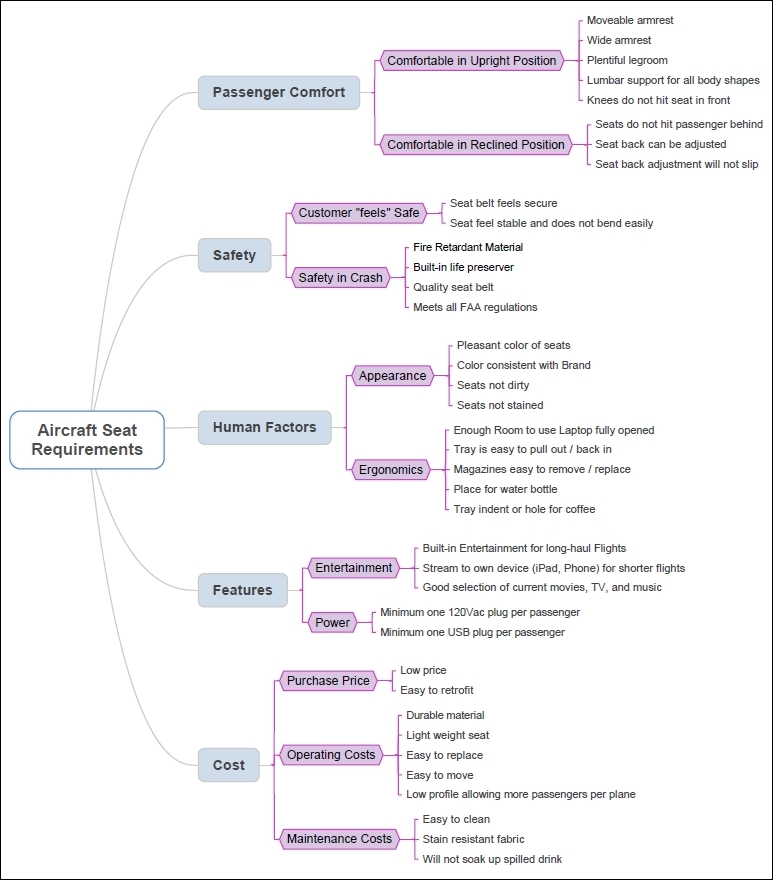
Figure 9.4: Aircraft seat primary, secondary, and tertiary requirements
The primary processes are shown in the blue boxes. The secondary features are illustrated in the purple boxes, and the tertiary features, which reflect our customer feedback, are illustrated on the right side of each of the secondary features.
To get the relative importance, we will deploy a technique similar to the process we described in chapter 4, Gathering the Customer Needs for Your Product by using a customer survey to help us weight each customer requirement. To do so, we will construct a sheet similar to Figure 9.5, where we will represent all the customer feedback showing the secondary and tertiary requirements. From this point, we will ask a group of customers to distribute 100 points over all the secondary items only. This forces the customers to think about the relative importance of each secondary requirement relative to each other. Once this is complete, we then ask the customers to allocate each of the secondary points to the associated tertiary requirements, which will give us the necessary granularity and priority we require. In the example that follows, I have only done the first two primary requirements, so you can understand the format. Normally, I would have included all five primary requirements. When you complete this work yourself, you should do all the primary requirements on one sheet, unless there is a specific reason not to do so:
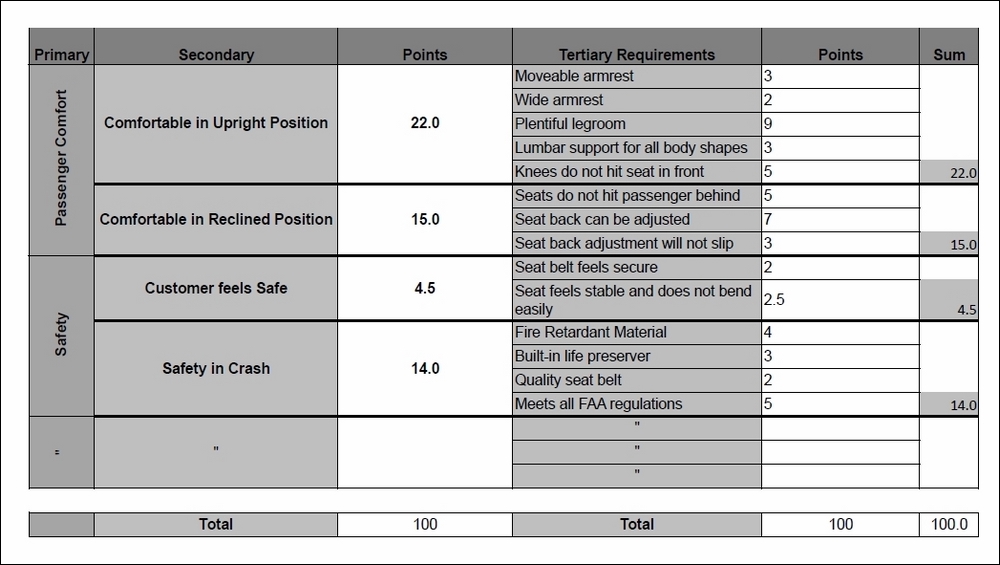
Figure 9.5: Customer requirements scoring
Once we complete this exercise, we can begin to build our QFD model. As you will see, the exercise we just performed will provide input to the engineers about what needs to be built, and also provides a baseline from which to measure when we do the competitive analysis section of the QFD matrix.
Taking the above information and transferring it to a QFD matrix would result in a customer requirements section as follows:
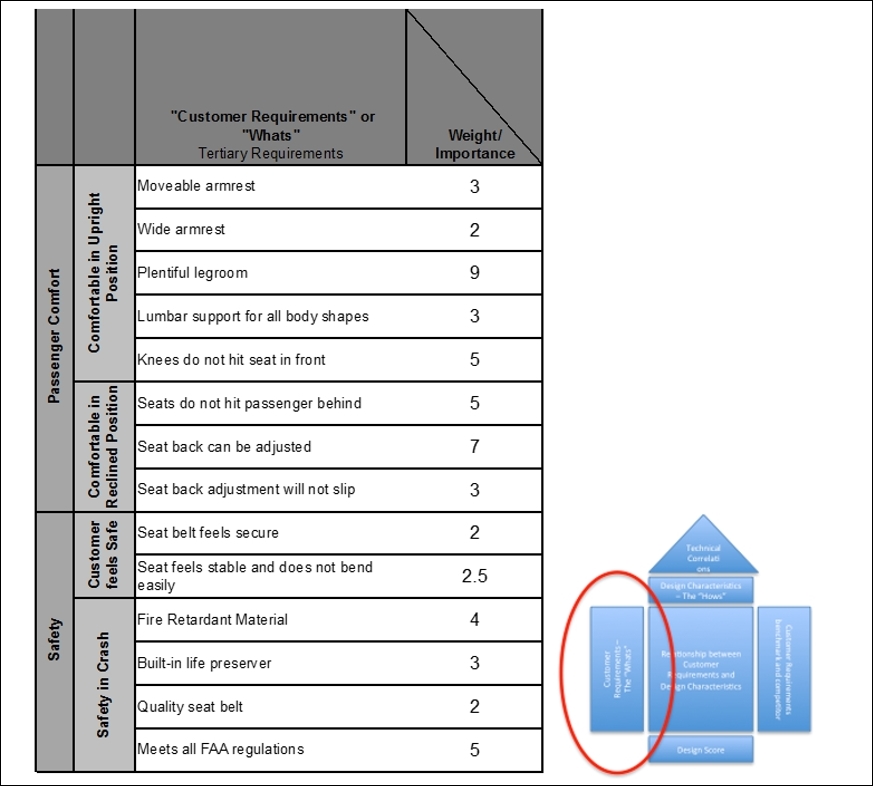
Figure 9.6: Customer requirements with importance
Now that we have a list of all the customer requirements, it is worthwhile for us to do a comparison regarding how well our current (or future) offering meets the needs of the customer, as well as how well each of our competitors meet those needs. For this example, I have ranked our current offering versus the competition on a scale from 1 to 5 for each customer requirement, as shown on Figure 9.7. To aid your understanding, you can also map the benchmarks for each competitor graphically, as shown. As before, if at all possible, it is far preferred to have users perform the competitive benchmarking, by allowing them to rank your current offering versus the competitor's offerings, themselves.
This can be done during the survey you used to get the importance scoring. Having the customers do this scoring also helps to ensure you are accurately reflecting the perception of the market:
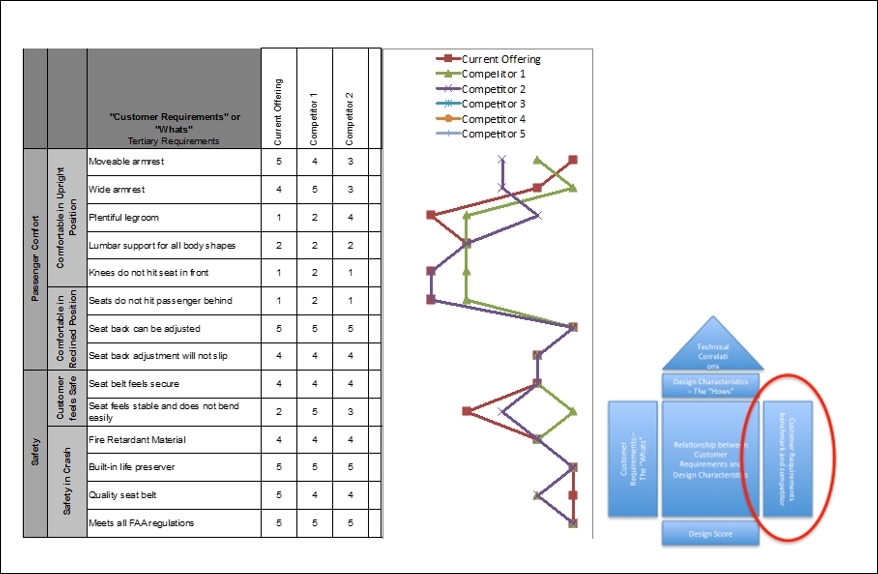
Figure 9.7: Competitive benchmark
Now we have both the customer requirement and the competitive benchmark. By placing both halves together, we can see the relationship between customer requirements and importance on the left, versus the competitive offerings on the right in our QFD matrix, as shown in Figure 9.8 (we have cut out the middle section of the QFD, as nothing exists there at this time):
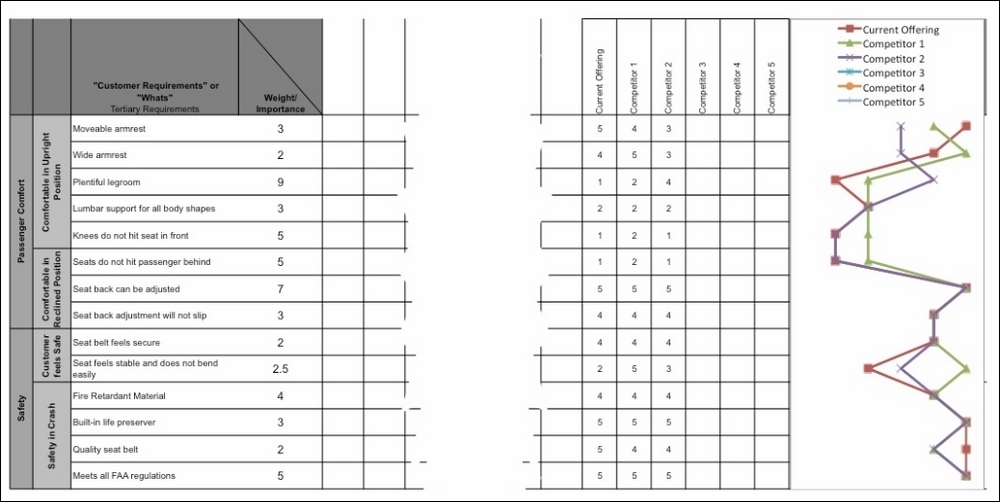
Figure 9.8: QFD requirements versus competition
Now that we have the customer requirements and the competitive benchmarks, we must determine the design characteristics that must be deployed in the product to ensure customer satisfaction. This is otherwise known as the "Hows", as this section tells us how the design team will address the needs outlined in the customer requirements section.
To develop the design characteristics, I recommend the VoC team and the engineering team sit together for a brainstorming session. To brainstorm the design characteristics, start with one secondary requirement and its associated tertiary requirements to brainstorm how the engineering group could fulfill the need for design characteristics. Try to generate as many ideas as possible that affect at least one of the tertiary requirements. But one rule must be strictly adhered to, and that is each design characteristic must be measurable in some form. If it is not measurable, it cannot be optimized and cannot be used to ensure customer satisfaction.
As an example, using our aircraft seat shows how we would start to brainstorm various parameters such as the height, width, hardness, space, and so on of the armrest, seat back, and seat cushion, to meet the defined customer need. Figure 9.9 shows a representative sample of what the output might look like after doing the first two secondary requirements, comfort in upright position, and comfort in the recline position. If you were actually doing this exercise in real life, you would need to do the remaining secondary and associated tertiary requirements:
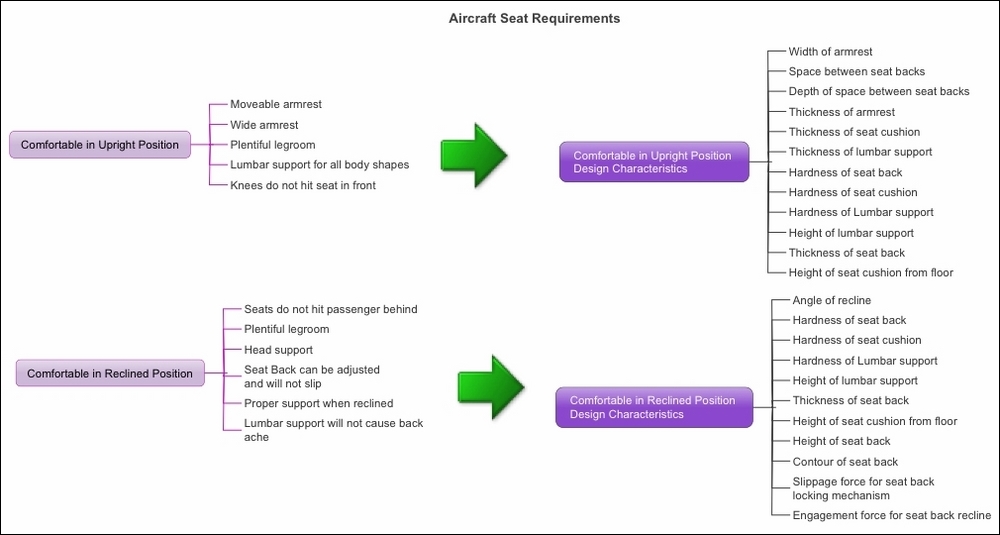
Figure 9.9: Design characteristics brainstorming
Once the brainstorming sessions are complete, you would have a similar list of design characteristics for each of the secondary requirements we defined earlier. From this point, we would gather all the design characteristics the team has generated and categorize them into like groupings, with a heading for each. In our example, we'd have groupings for such things as armrest, seat back, seat cushion, fabric, mounting hardware, seatbelts, services, and many more, when we are done.
The following figure shows a hypothetical result for the first two secondary requirements:
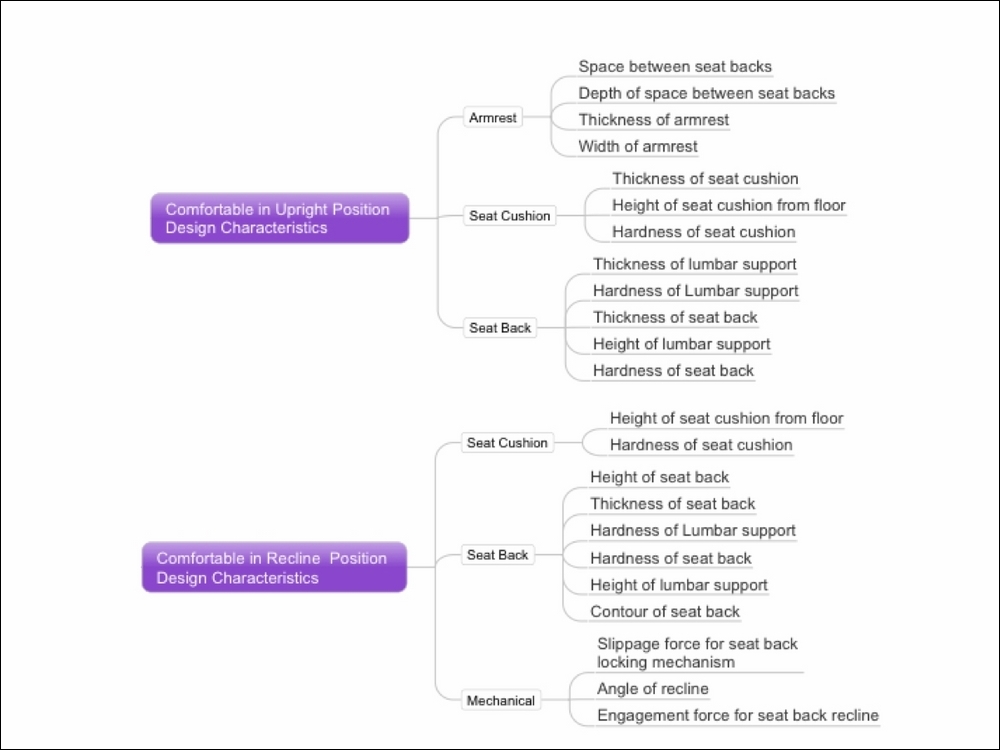
Figure 9.10: Design characteristics groupings
We would then take the various design characteristics from each of the secondary customer requirements, and group them together where the groupings are the same.
In our example, you can see that there are design requirements on the seat back and seat cushion for both secondary requirements shown in Figure 9.10, so we would group them together as shown in Figure 9.11, with all the design requirements for armrest together, all the requirements for seat cushion together, and so on:
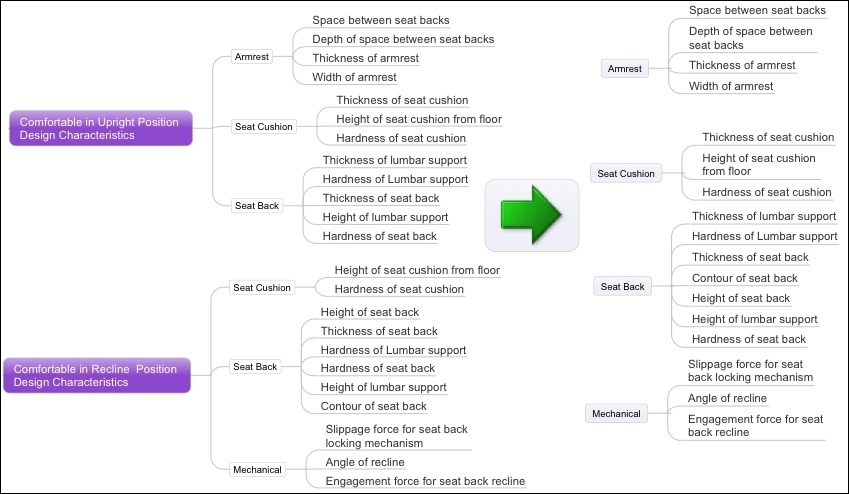
Figure 9.11: Merging the design requirements
From here, we would take the sum of all the requirements for armrest, seat cushion, seat back, mechanical, and so on, and move them to the top of our QFD matrix (the "Hows") as shown in Figure 9.12, with the secondary design requirements placed above the tertiary requirements:
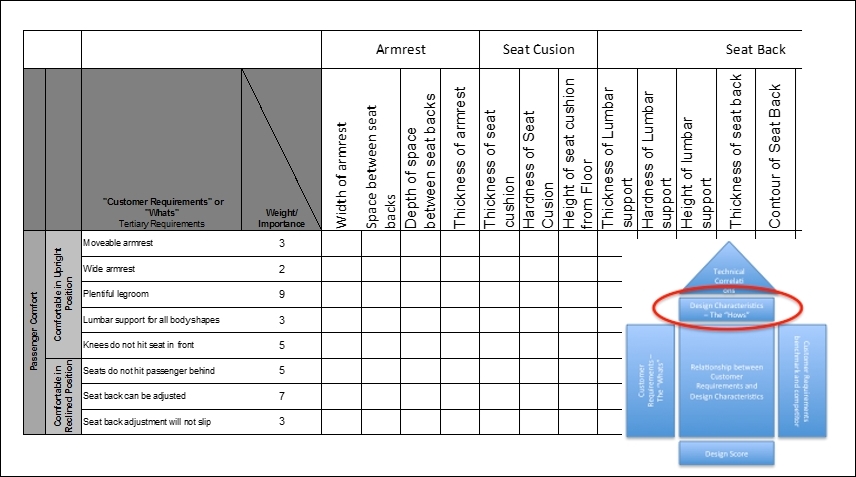
Figure 9.12: Adding the Hows to the top of our matrix
When this is complete for all the design requirements, we now have the structure to allow us to understand the relationship and the importance between all the customer requirements and the company's design requirements. This next section, the relationship matrix, is the meat of the QFD, and it is important that the team take the necessary time to discuss, understand, and build as much consensus as possible between the VoC interview team and the rest of the design team.
In this step, we will evaluate every intersection from the customer requirements and the design requirements, and determine how much of a relationship exists between the Whats and the Hows:
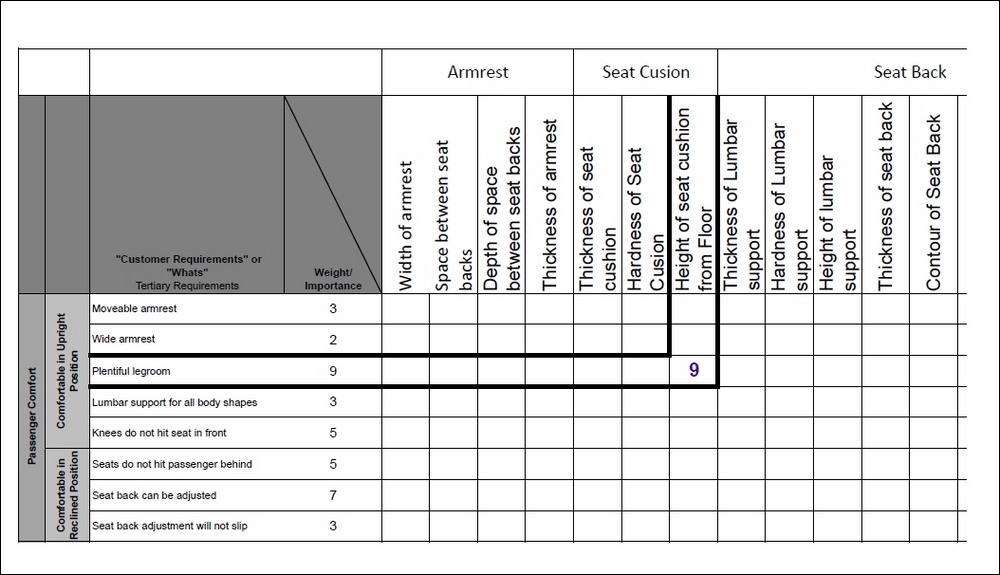
Figure 9.13: The relationship matrix
We then must provide a weighting to every intersection, to represent whether there is a strong relationship, a mediocre relationship, a weak relationship, or no relationship. If there is a strong relationship, we will give the intersection cell a value of 9. If there is a mediocre relationship, we will give it a 3. If there is a weak relationship, we will give it a 1, and if there is no relationship, we will leave it blank. As shown in Figure 9.13, there is a strong relationship between the customer requirement of "Plentiful legroom" and the design requirement of "Height of the cushion from floor". As such, we would place a 9 in this cell.
We can see what the upper-left side of our matrix might look like when it is completed in Figure 9.14. As you can see, it is not unusual that no more than 20–30% of the relationship matrix would have any values in the intersecting cells, and there should rarely be any instance where more than 50% of the relationship matrix has values:
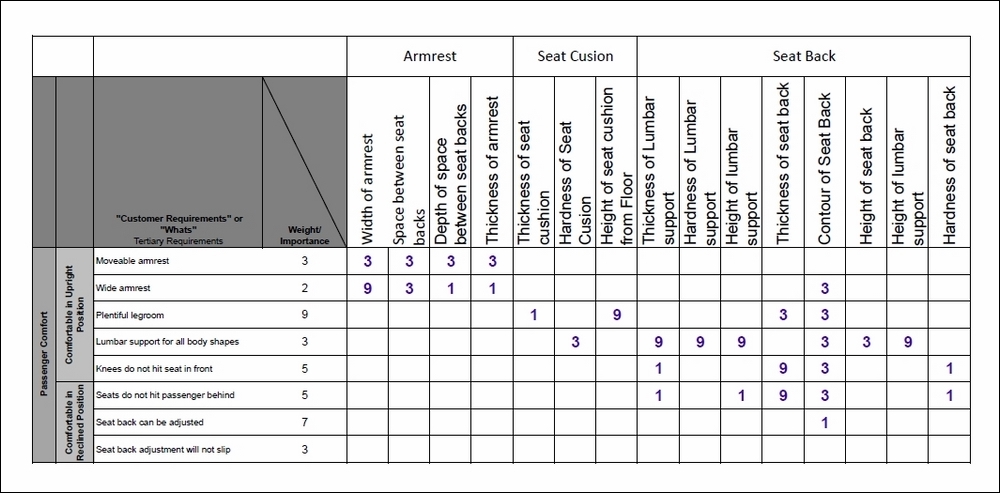
Figure 9.14: Completed relationship matrix
The next piece of the HoQ matrix is the technical correlations. This piece of the HoQ matrix serves to highlight relationships between the various design requirements. Symbols are used to show strong positive correlation, positive correlation, negative correlation, and strong negative correlation, as illustrated on the legend in Figure 9.15. This is the triangular piece on the top of the HoQ matrix, and helps to derive the "House of Quality" moniker. As before, the matrix is completed by moving along the intersections of the various design requirements and recording whether it has a positive or negative correlation with each of the other design requirements as shown.
As you perform the analysis, keep in mind whether the two design requirements have a positive or a negative correlation with each other. If we look at the far right of Figure 9.15, we can see Thickness of seat back and Contour of seat back. At first, you may think this is a strong positive correlation, but upon reflection you would see that the goal is to have as thin a seat back as possible, and the addition of adding contours for the seat back contradicts the goal of a thin seat back, so we have scored this a strong negative correlation:
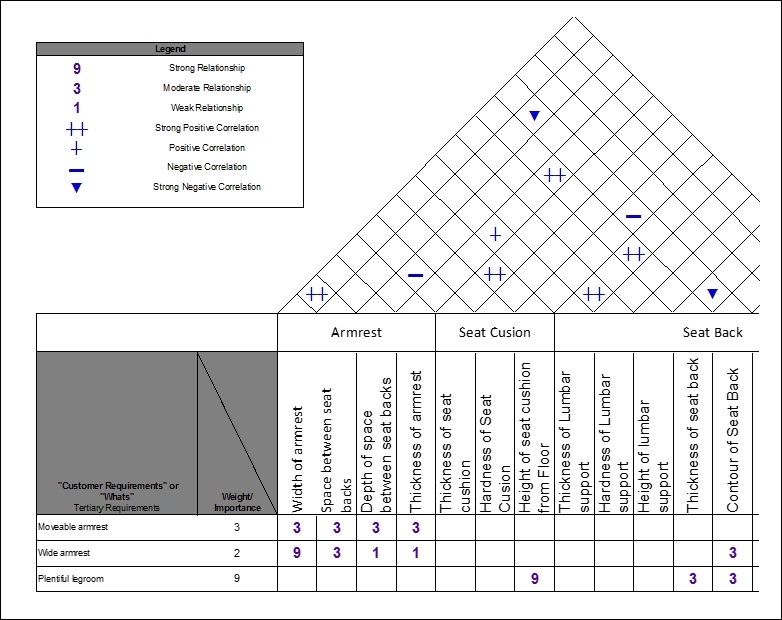
Figure 9.15: Technical correlations
While I do find this section of the HoQ interesting, I think that it does not add as much value as the other sections, and consider it an optional section when you are first getting started with your HoQ matrix.
The next section is the design score, and is one of the key outcomes of using the HoQ matrix. What we are really trying to do with the HoQ matrix is to understand the various inputs we have received from our customers, and then, with the assistance of our design team, attempt to ascertain the priority and impact of doing the various design efforts and how it will ultimately impact customer satisfaction. If done correctly, the design score should help you in creating that understanding.
To get our design score, we will need to multiply the customer importance rating times by the relationship matrix score for each of the design requirements. The formula would look like the following:
Design score = Sum (Customer importance x relationship matrix score)
Looking at the design requirement for width of armrest, we see in Figure 9.16 that moveable armrest had a customer importance ranking of 3, and wide armrest had an importance of 2. Multiplying those scores with the relationship matrix scores shows that our formula would look like the following for the width of armrest design requirement:
Design score = (3x3 + 2x9) = 27
If we continue this process for all the other cells in our example, we would see the following if all we were evaluating was the passenger comfort requirement. In an actual case, you would need to add the other customer requirements and design requirements as well, but they have been omitted here for clarity and understanding:
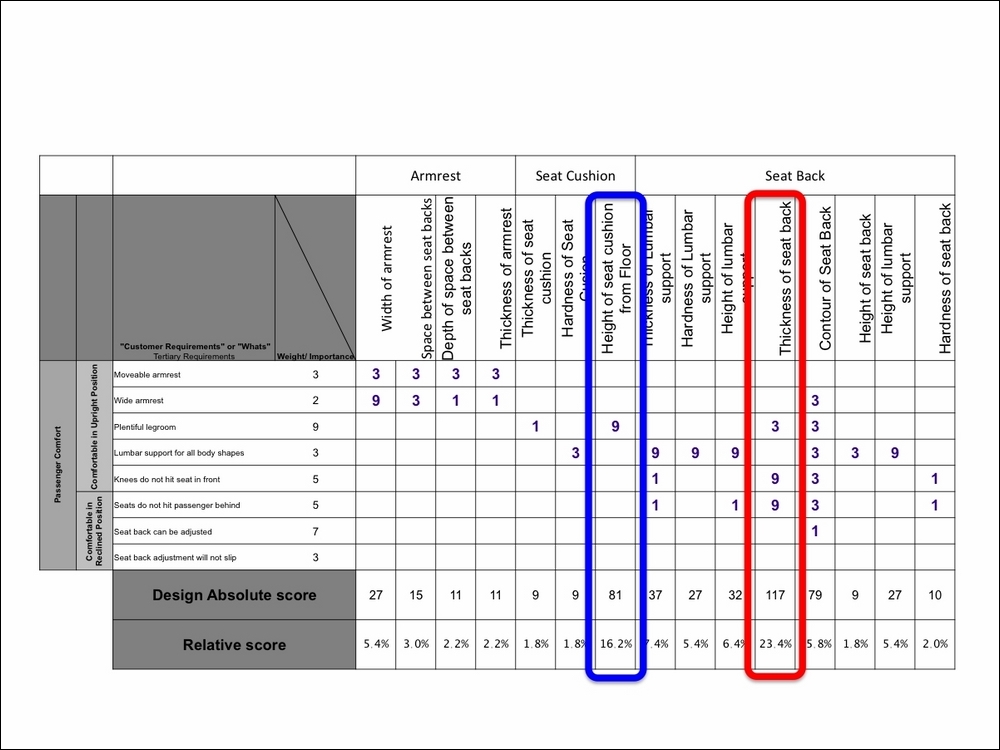
Figure 9.16: Design score
In this scaled-back example, we can see that Thickness of seat back scored a 117 and represents 23.4% relative to everything else, making this the number one design requirement we must address to provide the most satisfaction to our customers. Height of the seat cushion from floor scored an 81, and even though we see that a number of other design requirements would actually address more customer requirements, Plentiful legroom was such an important customer requirement that solving this need is our second most important design consideration.
In addition to translating customer requirements into design requirements, I hope you will see how powerful a tool this is for your organization. Most companies have no problem gathering requirements from customers, and most if not all companies have more requirements than their engineering and design teams have time for. This tool has the advantage of aiding teams both in translating customer requirements into design requirements, and also an understanding of a method to prioritize those design requirements to provide as much customer satisfaction as possible, as quickly as possible, with the limited resources of the organization.
In addition to the outcome of creating a customer-driven product based on the VoC analysis you have created, QFD also offers the following benefits to the organization:
- Competitive analysis: Analyzing other products in the marketplace against the customer identified needs and develops an understanding of which areas we hold the lead and must maintain our advantage, areas we lag and must improve, and areas where we can gain a competitive advantage
- Reduced development time: The likelihood of design requirements changing late in the development process are greatly minimized, and the amount of time on insignificant features is minimized
- Reduced development costs: Minimizing changes late in the development process reduces development time as well as warranty and product support costs
- Meeting market window: By minimizing development time and changes made late in the game, we also have a much higher likelihood of getting the product to market in time to meet the market window
- Documentation: A knowledge base is built during the QFD process, and a record of decisions and justification is recorded
While it is beyond the scope of this text, it should also be noted that additional QFD attributes such as competitive technical benchmarking, establishing engineering targets, engineering characteristics importance, and degree of technical difficulty are all components that can be added to aid in your analysis. The QFD tool can also help you develop product strategies by identifying where your product excels. Also, there are three additional Houses of Quality that can be deployed within your organization that help identify specific action items a company can take, and which processes and control variables must be identified and deployed.