5
Design of Geosynthetic Reinforced Soil (GRS) Walls
In this chapter we shall address the design of geosynthetic reinforced soil (GRS) walls, including design concepts, design methods, and related issues for both mechanically stabilized earth (MSE) walls with geosynthetics as reinforcement (referred to as GMSE walls) and geosynthetic reinforced soil (GRS) walls. The differences between GMSE and GRS have been explained in Chapter 3. Among current design methods for reinforced soil walls, most are applicable to GMSE walls with a handful of them being applicable specifically to GRS walls. Design methods for MSE walls with metallic reinforcement have been presented elsewhere, e.g., Schlosser and Segrestin (1979), Smith and Pole (1980), and Mitchell and Villet (1987), and will not be addressed here.
This chapter begins with a description of basic design concepts, followed by an overview of design methods. In addition, six recent advances related to the design of GRS walls are discussed in some detail, including:
- required reinforcement stiffness and strengths
- evaluation of pullout stability
- lateral movement of wall face
- required long‐term strength of geosynthetic reinforcement
- connection stability of concrete block facing
- required reinforcement length.
Step‐by‐step design procedures for four design methods are then given, including:
- the U.S. Forest Service (USFS) design method
- the AASHTO ASD design guidance for GMSE walls
- the NCHRP design method for GRS bridge abutment walls
- the GRS‐NLB design method for non‐load‐bearing GRS walls.
A few popular design methods, including the National Concrete Masonry Association (NCMA) method (2010), the FHWA‐NHI design method (Berg et al., 2009), the AASHTO LRFD design guidelines (2014), and the FHWA GRS‐IBS design method (Adams et al., 2011a), are not included in this book as they have been presented in a comprehensive manner in respective design guides.
It is noteworthy that, although not addressed specifically in any of the design methods, drainage design for surface and subsurface water, including seasonal change of drainage conditions, must be a component of design. Inadequate drainage has been identified as one of the leading causes of poor performance (especially excessive deformation) of reinforced soil walls.
5.1 Fundamental Design Concepts
Reinforced soil walls typically consist of two major components: a reinforced soil mass and facing (see Figure 3.23). Design of reinforced soil walls involves satisfying internal stability and external stability. Internal stability refers to stability within the reinforced soil wall, including the reinforced soil mass and the facing, if facing is present. External stability, on the other hand, refers to the stability of the reinforced soil mass and facing as a whole in relation to the soil beneath and behind them.
The internal stability of a reinforced soil wall is checked to ensure that the reinforced soil mass and facing in themselves are sufficiently stable so that they will behave as a coherent and stable unit. To ensure stability of the reinforced soil mass, stability analysis needs to be carried out to make sure that reinforcement in the reinforced soil mass is not overstressed or ruptured (referred to as tensile rupture failure, see Figure 5.1(a)), and that the bonding between soil and reinforcement is maintained (referred to as pullout failure, see Figure 5.1(b)). For GMSE, the internal stability check is performed by treating reinforcement layers as quasi‐tiebacks to stabilize potential failure wedges. Therefore, such design methods are collectively referred to as quasi‐tieback wedge methods. Generally speaking, the required minimum strength of reinforcement for a GMSE wall is governed by rupture failure, and the required minimum length of reinforcement for a GMSE wall is governed by pullout failure. Note that the required minimum reinforcement strength and length are determined in a rather different manner for GRS; this will be discussed toward the end of this section.

Figure 5.1 Potential failure modes for checking the internal stability of a GMSE wall: (a) tensile rupture failure of reinforcement and (b) pullout failure of reinforcement
Facing failure may occur within the facing or at the connection (if present) between the facing and the reinforced soil mass. Potential failure of discrete block facing may occur in three modes:
- rupture failure of reinforcement at the connection between the facing and the reinforced soil mass behind the facing (see Figure 5.2(a))
- slip‐out failure of the reinforcement between facing blocks (see Figure 5.2(b))
- interface shear failure of the block facing, either between block and block or between block and reinforcement (see Figure 5.2(c)).
Figure 5.2 Potential failure modes of discrete block facing: (a) rupture failure of reinforcement at connection, (b) slip out failure of reinforcement between facing units, and (c) interface shear failure between adjacent facing blocks
External stability of a reinforced soil wall, as noted earlier, is evaluated to ensure that the reinforced soil wall as a whole is stable. It is carried out by considering the reinforced soil mass along with the facing as a rigid soil wall with earth pressures acting behind and beneath the reinforced soil mass. The stability of the rigid soil wall is checked by methods similar to those for stability analysis of rigid earth retaining structures, namely, to check the stability against four potential failure modes (see Figure 5.3): lateral sliding failure, foundation bearing failure, eccentricity (lift‐off) failure, and overall rotational slide‐out failure. External stability has been found to be a major cause for most reinforced soil walls that experience either failure or poor performance.
Figure 5.3 Potential failure modes for checking the external stability of a reinforced soil wall: (a) lateral sliding failure, (b) bearing failure, (c) eccentricity (lift‐off) failure, and (d) overall rotational slide‐out failure
In addition to the external and internal failure modes shown in Figures 5.1–5.3, failure involving a combination of both types of failure mode, within and around a reinforced soil mass (see Figure 5.4), may also occur. This mode of failure, referred to as compound failure, should also be evaluated as part of the external stability check.
Figure 5.4 Examples of compound failure of a reinforced soil wall
It is important to point out that when a reinforced soil wall with closely spaced geosynthetic reinforcement is designed by considering the reinforced soil mass as a soil–geosynthetic composite (as opposed to a soil mass being stabilized by geosynthetic quasi‐tieback members), evaluation of the internal stability of a reinforced soil mass is very different from that described above for GMSE walls. For GRS walls designed with the concept of soil–geosynthetic composites, the required tensile stiffness and strength of geosynthetic reinforcement is typically governed by the load‐carrying capacity of the composite resulting from soil–reinforcement interaction (see Section 5.3.1), or by prescribed limiting lateral wall movement (see Section 5.3.3) whichever is greater. The required length of geosynthetic reinforcement, on the other hand, is typically governed by external stability checks for various modes of external failure and generally not by pullout of reinforcement (cf. Section 5.3.2).
5.2 Overview of Design Methods
All prevailing design methods for reinforced soil walls with geosynthetics as reinforcement are based on the limiting equilibrium method of analysis. The design methods require that both internal and external stability be checked. For evaluation of internal stability, most methods adopt an earth pressure approach, while a handful of others adopt a slope stability approach. Examples of design methods based on the earth pressure approach include the U.S. Forest Service (USFS) method (Steward et al., 1977, revised 1983), the Broms method (1978), the Bonaparte et al. method (1987), the GeoServices method (Giroud, 1989), the Christopher et al. method (1990), the FHWA‐NHI method (Berg et al., 2009), the NCMA method (2010), the AASHTO guidance (2002, 2014), and the K‐stiffness method (Allen et al., 2004; Bathurst et al., 2008). Examples of design methods based on the slope stability approach are the Schmertmann et al. method (1987) and the Leshchinsky–Perry method (1987).
The slope stability approach adopts the same procedure as that used in conventional slope stability analysis, but with modifications to account for the presence of tensile reinforcement. Different methods of the slope stability approach differ in the assumed shape of potential failure surfaces and orientation of reinforcement forces along a potential failure surface. For example, the Leshchinsky–Perry method assumes rotational (log‐spiral) and translational (planar) failure surfaces. The Schmertmann et al. method assumes straight‐line and bilinear failure surfaces. The simplified Bishop method and the Spencer method, commonly used for analysis of unreinforced soil slopes, have been modified for analysis of reinforced soil slopes. Because of the effort and time required for design computations, design methods based on the slope stability approach have to rely on either design software or design charts.
For design methods that are based on the earth pressure approach, a potential failure plane (which occurs through the reinforced soil mass) and an earth pressure diagram (which acts on the vertical plane along the back of the reinforced soil mass) are assumed. Two sets of safety factors (or variations) are determined for each layer of reinforcement, one against rupture failure and the other against pullout failure. The safety factors for every layer need to meet certain minimum criteria to ensure sufficient safety margins. The safety factor against rupture failure for a given reinforcement layer is evaluated as the ratio of reinforcement strength and the resultant force in the tributary zone of the layer. On the other hand, the safety factor against pullout failure for a given reinforcement layer is evaluated as the ratio of resisting (or stabilizing) force to driving (or destabilizing) force. The resisting force is the resultant of soil–reinforcement interface frictional resistance along the length of reinforcement extending beyond the assumed failure plane of the layer (see Figure 5.5); on the other hand, the driving force is the resultant of the assumed lateral earth pressure in the tributary zone of the layer. This method of stability analysis is very similar to the way a tieback system is designed. As noted earlier in Section 5.1, design methods that considered geosynthetic reinforcement as quasi‐tieback tension members are collectively referred to as quasi‐tieback wedge methods.
Figure 5.5 Commonly assumed failure plane in the earth pressure design methods, and frictional resistance against pullout failure in the anchored zone
Most earth pressure design methods assume that the failure plane of reinforced soil walls follows the Rankine active failure plane for an unreinforced soil mass under uniform vertical surcharge. The failure plane will initiate at the heel and slope upwards at an angle of ![]() from the horizontal, where ϕ is the angle of internal friction of the soil (in terms of effective stress, ϕ', for free‐draining backfill), as shown in Figure 5.5. The earth pressure design method proposed by the NCMA, a trade organization for masonry blocks, is the sole exception to the use of the Rankine active failure plane. It assumes the lateral earth thrust and failure plane follow the Coulomb theory (see Section 2.3), which accounts for soil–facing interface friction, and is less conservative than the Rankine theory (hence gives a smaller earth thrust on a wall).
from the horizontal, where ϕ is the angle of internal friction of the soil (in terms of effective stress, ϕ', for free‐draining backfill), as shown in Figure 5.5. The earth pressure design method proposed by the NCMA, a trade organization for masonry blocks, is the sole exception to the use of the Rankine active failure plane. It assumes the lateral earth thrust and failure plane follow the Coulomb theory (see Section 2.3), which accounts for soil–facing interface friction, and is less conservative than the Rankine theory (hence gives a smaller earth thrust on a wall).
Claybourn and Wu (1992) compared designs obtained from seven design methods (two slope stability methods and five earth pressure methods) with measured results of a field‐scale loading experiment for a timber‐facing GRS wall conducted under well‐controlled conditions (see Figure 5.6). The GRS wall in the experiment was constructed with granular backfill and a very weak nonwoven geotextile, and loaded vertically in increments until failure occurred in a plane‐strain condition (Wu, 1992). Table 5.1 lists the predictive failure surcharge obtained based on the seven design methods. All seven methods give much lower failure loads (ranging from 0 to 7.3 psi) than the measured failure load of 29 psi (200 kPa). The observed failure mode was excessive bulging of the facing as a result of failing nails in the forming elements of the wall face (cf. Section 6.1.4). It is important to point out that the predicted failure pressures shown in Table 5.1 are determined with all safety factors being set equal to 1.0, even though all the design methods stipulate safety factors greater than 1.0 should have been used in intermediate computation steps. Had the safety factors stipulated by the design methods been used, the failure load would have been much smaller than those given in Table 5.1. In other words, the differences between the measured and predicted failure loads as seen in Table 5.1 are a direct indication of the deficiencies of the design methods. They are not a reflection of any intended safety margins. The comparison indicates that all of those design methods are very conservative (with the closest predictive failure load being off by a factor of 4, and the lowest predictive value saying the wall could not be built).

Figure 5.6 A field‐scale timber facing GRS test wall in plane‐strain condition: (a) test bin and (b) excessive bulging of facing at failure, under a vertical surcharge load of 29 psi (200 kPa)
Table 5.1 Failure surcharge pressures predicted by various design methods with a safety factor of 1.0
| Design Method (with Fs = 1.0) | Surcharge Load at Failure (measured value = 29 psi) |
| U.S. Forest Service (Steward et al., 1977, revised 1983) | 0.7 psi |
| Broms (1978) | 6.2 psi |
| Collin (1986) | 7.3 psi |
| Bonaparte et al. (1987) | 0.9 psi |
| Leshchinsky and Perry (1987) | 5.2 psi |
| Schmertmann et al. (1987) | 6.0 psi |
| Giroud (1989) | 0 psi (cannot be built) |
Claybourn (1990) and Claybourn and Wu (1993) also reported a study to compare designs obtained from six earth pressure methods by incorporating recommended safety factors stipulated by the respective methods. The designed reinforcement layouts for a 12‐ft (3.6‐m) high wall are shown in Figure 5.7. The differences among the different methods are quite dramatic. Upon further investigation, it was found that in addition to differences in assumed lateral earth pressure diagrams for the different methods, a major source of the differences came from the safety factors. Figure 5.8 shows the design reinforcement layouts with all safety factors set to 1.0 for a 20‐ft (6.1‐m) high wall. It is seen that the differences for the six design methods are much smaller compared to those seen in Figure 5.7. The fact is that the values of the safety factors stipulated in all the design methods are somewhat arbitrary; they are not established based on sufficient empiricism or sound analysis of a reliable and sufficiently large database. Because of uncertainties associated with design parameters and computation procedure as well as a general desire to obtain a conservative design, different values of safety factors have been assigned. Some safety factors are applied to soil strength parameters, and others to calculated forces, moments, etc. Individual safety factors, ranging from 1.2 to 1.5, appears rather “innocent” and reasonable. However, they can be very different as a whole. The issue of the somewhat arbitrary safety factors remains an unresolved problem in all design methods of reinforced soil walls. Use of the load and resistance factor design (LRFD) approach attempts to resolve this issue in an analytical manner; however, a lack of reliable and sufficient database has made it a still unresolved issue.

Figure 5.7 Reinforcement layouts for a 12‐ft high reinforced soil wall, as obtained from six design methods, by incorporating recommended safety factors stipulated in respective design methods (Claybourn, 1990)

Figure 5.8 Reinforcement layouts for a 20‐ft high wall, as obtained from six design methods, by setting all safety factors = 1.0 (Claybourn, 1990)
Load‐bearing GRS walls (such as bridge abutment walls) face a unique challenge in that there are heavy bridge loads applied near the wall face. The National Cooperative Highway Research Program initiated a study on the subject, and a design method for GRS abutment walls has been developed (Wu et al., 2006). The design method was based on full‐scale experiments and extensive finite element analysis. Two performance criteria were established to determine allowable bearing pressure for GRS bridge sills: a sill settlement limit criterion and a critical shear strain distribution criterion in the reinforced soil mass. The allowable bearing pressures of bridge sills are a function of the friction angle of the fill, reinforcement vertical spacing, sill width, and type of sill (isolated sill or integrated sill). The default value for reinforcement vertical spacing was set as 0.2 m (8 in.), which was shown to offer significant benefits over the larger reinforcement spacing commonly used in GMSE. To ensure satisfactory performance and acquire an adequate margin of safety, reinforcement spacing greater than 0.4 m is not recommended for GRS abutments under any circumstances.
Realizing the significant benefits of closely spaced geosynthetic reinforcement, the U.S. Federal Highway Administration (FHWA) subsequently developed a comprehensive design and construction guidance for a GRS bridge abutment system, known as the geosynthetic reinforced soil – integrated bridge system (GRS‐IBS) (Adams et al., 2011a,b). The GRS‐IBS stipulates that geosynthetic reinforcement spacing should not exceed 0.3 m (12 in.). To date, hundreds of GRS‐IBS bridge abutments have been built. These bridge abutments have seen excellent performance.
Most reinforced soil walls with geosynthetics as reinforcement built in North America have been GMSE walls with concrete block facing. Approximately 60,000 GMSE walls have been constructed on U.S. highways. Most of these walls have been designed by following the AASHTO guides (2002, 2014), the FHWA‐NHI method (Berg et al., 2009), or the NCMA method (2010). Typical reinforcement spacing of GMSE walls is in the range of 0.3–1.0 m (or 12–40 in.). GMSE walls, however, have been found to experience an unusually high failure rate. Berg (2010) and Valentine (2013) have estimated a failure rate as high as 5%. The NCMA’s estimate of the failure rate is 2–8%. There appears to be no consensus about the causes for the very high failure rate, yet more and more walls are being constructed on a daily basis. In any case, the high rate of failure of GMSE, a few folds higher than conventional earth retaining walls, is unacceptable in civil engineering practice.
Holtz (2010) indicates that bulging of wall face is an issue for GMSE walls. In a recent survey, many state Departments of Transportation (DOTs) listed excessive bulging and deformation as a top concern for GMSE walls (Gerber, 2012). Koerner and Koerner (2013) reported a database of failed GMSE walls. Of the 171 walls reported, 44 were excessive deformation and 127 were at least partial collapse. Some main statistics for the 171 walls are as follows:
- 96% were private (as opposed to public) financed walls
- 78% were located in North America
- 71% were masonry block faced SRW walls
- 65% were 4–12 m high
- 91% were geogrid reinforced; the other 9% were geotextile reinforced
- 86% failed within 4 years after construction
- 61% used silt and/or clay backfill in the reinforced soil zone
- 72% had poor‐to‐moderate compaction
- 98% were caused by improper design or construction (none were caused by geosynthetic manufacturing failures)
- 60% were caused by internal or external water (the remaining 40% were caused by internal or external soil‐related issues).
GRS walls with closely spaced reinforcement have been proven to be a viable alternative to GMSE. The fundamental concept of GRS has been addressed in Section 3.1. Other than reinforcement spacing, which spells an obvious difference between GRS and GMSE, the two reinforced soil systems have different reinforcing mechanisms. As opposed to the quasi‐tieback stabilization mechanism for GMSE, nine different reinforcing mechanisms have been identified for GRS (see Section 3.3). GRS has seen a very low failure rate (zero, according to a prominent GRS wall builder of over two decades).
In recent years, there have been a number of major advances related to the design of closely spaced GRS. Six new advances are described in some detail in Section 5.3.
5.3 Recent Advances in the Design of GRS Walls
This section describes the six major advances related to the design of GRS walls:
- required reinforcement stiffness and strength
- evaluation of pullout stability
- lateral movement of wall face
- required long‐term strength of geosynthetic reinforcement
- connection stability of concrete block facing
- required reinforcement length.
5.3.1 Required Reinforcement Stiffness and Strength
In most prevailing design methods of reinforced soil walls and bridge abutments, the required minimum reinforcement strength, Trequired, at depth z (measured from the top of the wall) has been determined as:
where Trequired = the required minimum strength for reinforcement at depth z, σh = average horizontal stress at depth z, sv = vertical spacing of reinforcement at depth z, and Fs = safety factor.
In the prevailing design methods, σh has been assumed to be the same as that in an unreinforced soil (i.e., by following the Rankine active earth pressure theory). It is interesting to note that this assumption in fact goes against the mechanism of apparent confining pressure (Section 3.3.1) and the mechanism of restraining lateral deformation of soil (in Section 3.3.3) where geosynthetic inclusion is said to reinforce a soil through soil–reinforcement interface friction and results in increased confining pressure and lateral stress in the soil.
Eqn. (5‐1) states that the reinforcement in a reinforced soil mass needs to have a minimum strength which is equal to the lateral stress in the soil mass multiplied by reinforcement spacing and a safety factor. The equation appears to be quite reasonable (after all, that’s what force equilibrium is all about). However, if the values of σh and Fs are to remain unchanged for any reinforcement spacing, as has typically been assumed in the prevailing design methods of reinforced soil structures, Trequired is then linearly proportional to sv (i.e., the ratio ![]() a constant). This implies that reinforcement spacing and reinforcement strength will have exactly the same influence on the performance of a reinforced soil wall. In other words, larger reinforcement spacing can be fully compensated by using reinforcement of proportionally higher strength (e.g., if the reinforcement spacing is doubled, the same performance can be achieved simply by using a reinforcement of twice the strength). This fundamental design equation (Eqn. (5‐1)) has encouraged designers to use large reinforcement spacing along with high strength reinforcement because larger reinforcement spacing usually means shorter construction time.
a constant). This implies that reinforcement spacing and reinforcement strength will have exactly the same influence on the performance of a reinforced soil wall. In other words, larger reinforcement spacing can be fully compensated by using reinforcement of proportionally higher strength (e.g., if the reinforcement spacing is doubled, the same performance can be achieved simply by using a reinforcement of twice the strength). This fundamental design equation (Eqn. (5‐1)) has encouraged designers to use large reinforcement spacing along with high strength reinforcement because larger reinforcement spacing usually means shorter construction time.
Field‐scale experiments conducted to examine the effects of reinforcement spacing versus reinforcement strength have demonstrated convincingly that reinforcement spacing has a much stronger influence on the performance of a geosynthetic reinforced soil mass than reinforcement strength. Examples include the mini pier experiments by Adams et al. (2002, 2007), unconfined compression tests by Elton and Patawaran (2005), and the GSC tests by Pham (2009) and Wu et al. (2013). These experiments have been described in Section 3.2.
Wu et al. (2010) developed an analytical equation for calculating the ultimate load‐carrying capacity, qult , of a GRS mass with closely spaced reinforcement (or a soil–geosynthetic composite). With a cohesionless backfill, the ultimate load‐carrying capacity of a soil–geosynthetic composite can be expressed as:
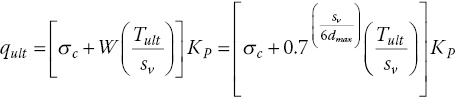
in which qult = ultimate load‐carrying capacity of a GRS mass, σc = lateral confining pressure, W = a factor signifying the comparative roles of reinforcement spacing and maximum particle size of fill material in a soil–reinforcement composite, sv = reinforcement spacing, dmax = maximum grain size of fill material, Tult = ultimate strength of reinforcement, and KP = coefficient of Rankine passive earth pressure.
To determine whether a given reinforcement meets the load–deformation requirements in a design, it will be prudent to check if reinforcement meets the following two criteria:
- Stiffness criterion: the stiffness of reinforcement must be sufficiently large to ensure satisfactory performance under service loads.
- Strength criterion: the ultimate strength of the reinforcement must be sufficiently large to provide a sufficient safety margin under the limiting condition over the lifetime of the earth structure.
To ensure adequate ductility, the ultimate strength needs to correspond to a sufficiently large strain to prevent sudden collapse (the smallest strain to ensure adequate ductility is herein referred to as “ductility strain”, εductility). To wit, two parameters are needed for prescribing reinforcement in design: reinforcement stiffness (T@ service ε) and reinforcement strength (Tult), with the latter being associated with a minimum value of ductility strain (εductility). For example, if T@ service ε and Tult shown in Figure 5.9 represent the minimum required values of stiffness and strength determined from design computations (after applying safety factors or reduction factors), and εductility is a prescribed value of ductility strain, then Reinforcement‐A would just meet both the stiffness and strength criteria, Reinforcement‐B would meet the stiffness criterion but fail the strength criterion, and Reinforcement‐C would meet the strength criterion but fail the stiffness criterion. In this example, only Reinforcement‐A meets both stiffness and strength criteria; neither Reinforcement‐B nor Reinforcement‐C can be selected.
Figure 5.9 Three reinforcements which meet or fail a set of reinforcement design criteria: required reinforcement strength Tult and reinforcement stiffness T@ service strain
The tensile stiffness is defined as the tensile resistance at a prescribed service strain level. It is recommended that a tensile strain of 2.0% be taken as the prescribed service strain for specification of the minimum required reinforcement stiffness of GRS bridge abutments (Wu et al., 2011; Adams et al., 2011b). For non‐load‐bearing applications, the recommended strain level is relaxed from 2.0% to 3.0% as the vertical and lateral displacements are not as critical to the intended function of the walls.
For conservatism in design, the required minimum reinforcement stiffness (in the direction perpendicular to wall face), Tult , calculated by Eqn. (5‐2), can be set equal to ![]() . In other words, the required minimum reinforcement stiffness,
. In other words, the required minimum reinforcement stiffness, ![]() , can be determined as:
, can be determined as:
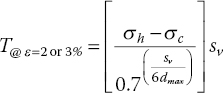
in which ![]() = required minimum tensile stiffness at ε = 2 or 3% (2% for load‐bearing applications; 3% for non‐load‐bearing applications), σh = horizontal stress at a depth where required stiffness is being sought, σc = lateral confining pressure of the GRS mass, sv = reinforcement spacing, and dmax = maximum grain size of the backfill.
= required minimum tensile stiffness at ε = 2 or 3% (2% for load‐bearing applications; 3% for non‐load‐bearing applications), σh = horizontal stress at a depth where required stiffness is being sought, σc = lateral confining pressure of the GRS mass, sv = reinforcement spacing, and dmax = maximum grain size of the backfill.
For a GRS wall or bridge abutment wall with dry‐stacked concrete block facing without any connection enhancement elements (such as pins, lips, or keys), the value of σc can be estimated as ![]() , where γb is the bulk unit weight of the facing block (bulk unit weight = total weight of a unit block divided by the exterior volume of the block), D is the depth of a unit block (in the direction perpendicular to the wall face), and δb is the friction angle between adjacent facing blocks (or between geosynthetic reinforcement and the facing block, if the geosynthetic is sandwiched between adjacent blocks). The value of σc is usually very small for dry‐stacked light‐weight block facing and can conservatively be assumed to be zero. The largest value of σh typically corresponds to the base of a wall and can be estimated by assuming that the Rankine active condition applies. Namely,
, where γb is the bulk unit weight of the facing block (bulk unit weight = total weight of a unit block divided by the exterior volume of the block), D is the depth of a unit block (in the direction perpendicular to the wall face), and δb is the friction angle between adjacent facing blocks (or between geosynthetic reinforcement and the facing block, if the geosynthetic is sandwiched between adjacent blocks). The value of σc is usually very small for dry‐stacked light‐weight block facing and can conservatively be assumed to be zero. The largest value of σh typically corresponds to the base of a wall and can be estimated by assuming that the Rankine active condition applies. Namely, ![]() , where γ is the unit weight of the compacted backfill, H is the total height of the wall, q is the uniform vertical surcharge pressure over the wall crest, and KA is the coefficient of Rankine active earth pressure.
, where γ is the unit weight of the compacted backfill, H is the total height of the wall, q is the uniform vertical surcharge pressure over the wall crest, and KA is the coefficient of Rankine active earth pressure.
To ensure sufficient ductility and satisfactory long‐term performance, the required minimum value of reinforcement strength (in the direction perpendicular to the wall face), Tult , can be determined by imposing a ductility and long‐term factor, Fdl, on ![]() determined from Eqn. (5‐3), i.e.,
determined from Eqn. (5‐3), i.e.,
The tensile strain corresponding to Tult on the load–deformation curve of the geosynthetic should be at least 5–7% to ensure sufficient ductility. The εductility = 5–7% is a suggested value from limited experience. The issue of long‐term design, including recommended values of Fdl (the ductility and long‐term factor) for different soils and geosynthetics, is further addressed in Section 5.3.4.
Validation of the analytical models for minimum required reinforcement strength (for Fs = 1.0 and Fdl = 1.0) has been carried out by comparing calculated reinforcement loads at failure with those obtained from field‐scale experiments, including the soil–geosynthetic composite (SGC) tests (see Section 3.2.3) and Elton and Patawaran’s tests (see Section 3.2.2). Note that these tests were selected for the validation because they use specimen sizes that are large enough to provide an adequate representation of soil–reinforcement composite behavior in actual field installation and were loaded to failure. Loads in reinforcement cannot be measured, however the reinforcement loads are known to equal the ultimate strengths when a reinforcement is at rupture failure.
Table 5.2 shows a comparison of results obtained from Eqns. (5‐1) and (5‐4) with “measured” results of the SGC tests. The largest difference in reinforcement loads at failure for Eqn. (5‐4) is 16%, whereas the difference for Eqn. (5‐1) is as high as 47%. A similar comparison for the Elton and Patawaran tests is shown in Table 5.3. The largest difference in reinforcement loads for Eqn. (5‐4) is 13%, whereas it is as high as 74% for Eqn. (5‐1). Note again that because loads in reinforcement cannot be measured (except at the extremities), the comparisons can only be made in an at‐failure state when the reinforcement loads are known to be the respective strength values. The analytical model (Eqn. (5‐4)) is clearly an improved tool over Eqn. (5‐1) for determination of required reinforcement strength.
Table 5.2 Comparisons of reinforcement loads at failure between Eqns. (5‐1) and (5‐4) and results of the SGC tests
| Parameter | Test Designation | |||
| Test 2 (Tf, sv) |
Test 3 (2Tf, 2sv) |
Test 4 (Tf, 2sv) |
Test 5 (Tf, sv) |
|
| Reinforcement Strength, Tf (kN/m) | 70 | 140 | 70 | 70 |
| Reinforcement Spacing, sv (m) | 0.2 | 0.4 | 0.4 | 0.2 |
| Vertical Pressure at Failure in Test (kPa) | 2,700 | 1,750 | 1,300 | 1,900 |
| Lateral Confining Pressure, σ3 (kPa) | 34 | 34 | 34 | 0 |
| Maximum Reinforcement Load (kN/m) at Failure, by Eqn. (5‐1) with Fs = 1.0 | 62.4 | 74.4 | 50.5 | 41.2 |
| Difference between Eqn. (5‐1) and Test Results* | –11% | –47% | –28% | –41% |
| Maximum Reinforcement Load (kN/m) at Failure, by Eqn. (5‐4) with Fdl = 1.0 | 79.4 | 124.1 | 75.4 | 58.8 |
| Difference between Eqn. (5‐4) and Test Results* | +13% | –11% | +8% | –16% |
Note:
Soil parameters: internal friction angle, ϕ = 50°; cohesion, c = 70 kPa; unit weight, γbackfill = 24 kN/m3; maximum grain size, dmax = 33 mm.
*negative value: smaller than measured; positive value: larger than measured.
Table 5.3 Comparisons of reinforcement loads at failure between Eqns. (5‐1) and (5‐4) and results of Elton and Patawaran’s unconfined compression tests
| Parameter | Reinforcement Designation | ||||||
| TG 500 | TG 500 | TG 600 | TG 700 | TG 800 | TG 1000 | TG 028 | |
| Reinforcement Strength, Tf (kN/m) | 9 | 9 | 14 | 15 | 19 | 20 | 25 |
| Reinforcement Spacing, sv (m) | 0.15 | 0.30 | 0.15 | 0.15 | 0.15 | 0.15 | 0.15 |
| Vertical Pressure at Failure in Test (kPa) | 230 | 129 | 306 | 292 | 402 | 397 | 459 |
| Maximum Reinforcement Load (kN/m) at Failure, by Eqn. (5‐1) with Fs = 1.0 | 4.47 | 2.35 | 6.95 | 6.49 | 10.08 | 9.91 | 11.94 |
| Difference between Eqn. (5‐1) and Test Results* | –50% | –74% | –50% | –57% | –47% | –50% | –52% |
| Maximum Reinforcement Load (kN/m) at Failure, by Eqn. (5‐4) with Fdl = 1.0 | 9.02 | 9.56 | 14.02 | 13.10 | 20.34 | 20.01 | 24.09 |
| Difference between Eqn. (5‐4) and Test Results* | 0% | +6% | 0% | –13% | +7% | 0% | –4% |
Note:
Soil parameters: internal friction angle, ϕ = 40°; cohesion, c = 27.6 kPa; unit weight, γbackfill = 18.8 kN/m3; maximum grain diameter, dmax = 13 mm.
*negative value: smaller than measured; positive value: larger than measured.
The load‐carrying capacity equation (Eqn. (5‐4)) for calculation of Tult of GRS composites has also been validated by available “measured” data from field‐scale experiments as of 2011 (Adams et al., 2011b). Figure 5.10 shows a comparison of the load‐carrying capacity equation and measured data compiled by the Federal Highway Administration. A good agreement between all measured test data and calculated values is seen.

Figure 5.10 Comparison between measured and calculated load‐carrying capacities of soil–geosynthetic composites, with the calculated values determined from Eqn. (5‐4) for Fdl = 1.0 (Adams et al., 2011b)
5.3.2 Evaluation of Pullout Stability
As noted at the beginning of this chapter, the design of GRS walls involves checking external stability and internal stability. External stability refers to the stability of the reinforced soil mass in relation to the surrounding soil. Internal stability, on the other hand, refers to stability within the body of the reinforced soil wall. To carry out an internal stability check, two modes of failure have commonly been examined: tensile rupture of reinforcement and pullout of reinforcement from the reinforced soil mass. A pullout stability check has routinely been performed in the design of GMSE walls.
The check of reinforcement pullout has traditionally been performed by requiring the reinforcement to be long enough that the resisting force (due to soil–reinforcement interface friction or interface bonding in general) behind an assumed failure plane of a reinforcement layer is sufficiently greater than the driving force (due to earth thrust in the tributary zone) of the reinforcement layer for each and every reinforcement layer in a reinforced soil mass. A minimum safety factor of 1.5 and a minimum anchored length of 0.9 m (3 ft) have commonly been specified to ensure pullout stability.
The safety factor against pullout failure for reinforcement layer‐i (at depth zi) has been evaluated as:
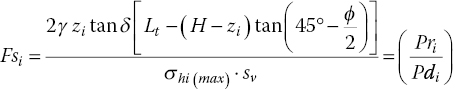
In Eqn. (5‐5), Pri is the resisting pullout force of layer‐i, Pdi is the driving pullout force of layer‐i, Lt is the total reinforcement length of layer‐i (as measured from the backface of the wall), σhi(max) is the maximum horizontal stress in the tributary zone of layer‐i, and δ is the angle of friction at the soil–reinforcement interface.
Let us consider a question: when performing a pullout stability check for a reinforced soil wall with closely spaced reinforcement, is it rational to require that each and every layer of reinforcement be safe against pullout failure? To address this question, we have to ask ourselves another question: can a single reinforcement layer in a closely spaced reinforced soil system experience pullout by itself while pullout of adjacent reinforcement layers does not occur? The answer has to be a resounding “no.” In other words, requiring each and every layer to be safe against pullout failure is overly conservative for the pullout stability check of a closely spaced reinforced soil mass. This may help explain why there has not been any pullout failure reported in actual GRS walls. If pullout failure is to occur, it will have to occur as a group of adjacent layers.
A group pullout safety factor is defined for more realistic evaluation of the pullout stability of walls with tight reinforcement spacing. To wit, the stabilizing and destabilizing forces in a pullout stability check should be evaluated for a group of reinforcement layers, rather than for any single layer. The next question that needs to be addressed is: how many layers would constitute a realistic group? To be conservative in design, the number of layers in a group should be kept to a minimum. The smallest group involving multiple layers of reinforcement is theoretically a group of two. However, for a group of two layers to experience pullout failure, both will be right next to an immobilized layer immediately above or below. This will still be overly conservative for walls with closely spaced reinforcement. Therefore, the smallest group that is reasonably conservative would be “a group of three”.
It is recommended that a group pullout safety factor against pullout failure be used to check pullout failure by following the rule of three, i.e., a group pullout safety factor for any three consecutive reinforcement layers must not be less than a certain limiting value to ensure pullout stability (see Figure 5.11). The group pullout safety factor, Fs(group), with depth of the mid‐layer zi , is defined as:
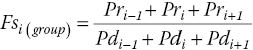
in which subscripts i – 1, i, and i + 1 denote three consecutive reinforcement layers at depths zi–1, zi, and zi+1, respectively.
Figure 5.11 Schematic diagram of group pullout failure evaluated by “the rule of three”
Assuming the critical slip surface is to follow the Rankine active failure theory, the pullout resisting forces (Pri) and driving forces (Pdi) for a GRS wall with a horizontal crest and a “vertical backslope” (i.e., with a vertical face in the back of the facing) while subjected to uniform vertical surcharge q, are (all other parameters are as defined for Eqn. (5‐5)):
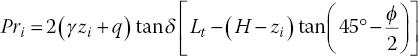

The parameter  in Eqn. (5‐8) was previously introduced in Eqn. (5‐2) to account for soil–reinforcement interaction (Wu et al., 2010). Due to frictional resistance at the soil–reinforcement interface, the lateral stress within a reinforced soil mass has been found to be higher than that in an unreinforced soil mass (described by the Rankine earth pressure theory as being equal to KAσv).
As noted above, the group pullout safety factor against reinforcement pullout, as expressed by Eqn. (5‐6), is the sum of the resisting pullout forces for any three consecutive layers divided by the sum of the driving pullout forces for the same three layers. Since there is no reinforcement layer above the very top reinforcement layer or beneath the bottom layer of a wall, the values of the “non‐existent” reinforcement layers (i.e., Pri–1 and Pdi–1 for the top layer, and Pri+1 and Pdi+1 for the bottom layer) should be taken as zero. A minimum group pullout safety factor of 1.5 is recommended. If the any of the Fs(group) in a GRS wall is less than 1.5, the reinforcement length should be increased until all values of Fs(group) of the wall are at least 1.5.
5.3.3 Lateral Movement of Wall Face
A GRS wall with concrete block facing is inherently a “flexible” wall system. A sound design method for GRS walls therefore should include determination of lateral movement to ensure that it does not deform excessively under service loads. The AASHTO (2002, 2014) and FHWA‐NHI (Berg et al., 2009) design guides adopt a simple chart proposed by Christopher et al. (1990) to give a rough estimate of the largest lateral wall movement. The chart is easy to use; however, it does not include the influence of some key factors such as the stress–strain–strength properties of the fill material, the load–deformation properties of reinforcement, and facing rigidity, all of which have been shown to influence significantly lateral deformation of GRS walls (e.g., Tatsuoka, 1992; Rowe and Ho, 1993; Helwany et al., 1999; Bathurst et al., 2006). Therefore, the chart is not useful, even for preliminary determination of the batter of a wall only.
A number of methods have been developed to estimate the lateral movement of reinforced soil walls, including those proposed by Giroud (1989), Wu (1994), Jewell and Milligan (1989), and Chew and Mitchell (1994). Among them, the Jewell–Milligan method has consistently been shown to provide the closest agreement with results of finite element methods of analysis (Macklin, 1994). The Jewell–Milligan method, however, ignores the effect of facing rigidity, hence is applicable only to reinforced soil walls with negligible facing rigidity (such as wrapped‐faced GRS walls). Wu and Pham (2010) modified the Jewell–Milligan method to include the influence of facing rigidity. The Wu–Pham method can be used to predict the lateral displacement profile of a reinforced soil wall with block facing during construction and under design loads. This method can also be used to determine the required reinforcement stiffness and strength for a specified allowable maximum lateral wall movement in design.
In the Wu–Pham method, the value of Δi, the lateral displacement of a GRS wall at depth zi, is determined by the following equation:
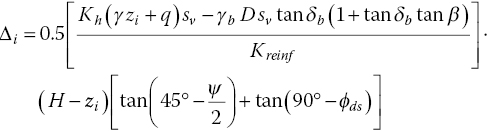
where Kh = lateral stress coefficient of reinforced fill (for simplicity, Kh can be taken as being equal to KA), Kreinf = stiffness of reinforcement (![]() , see Figure 4.19), H = wall height, γ = unit weight of reinforced fill, γb = bulk unit weight of facing block, ϕds = effective direct shear friction angle of soil, ψ = angle of dilation of soil, β = friction angle between the soil and backface of the wall, and δb = friction angle between vertically adjacent blocks (or between reinforcement and block, if the reinforcement is sandwiched between blocks). If frictional resistance between backface of the wall and reinforced fill is ignored (i.e., set β = 0) for conservatism, Eqn. (5‐9) reduces to:
, see Figure 4.19), H = wall height, γ = unit weight of reinforced fill, γb = bulk unit weight of facing block, ϕds = effective direct shear friction angle of soil, ψ = angle of dilation of soil, β = friction angle between the soil and backface of the wall, and δb = friction angle between vertically adjacent blocks (or between reinforcement and block, if the reinforcement is sandwiched between blocks). If frictional resistance between backface of the wall and reinforced fill is ignored (i.e., set β = 0) for conservatism, Eqn. (5‐9) reduces to:

Wu and Pham (2010) compared (Eqn. 5‐10) with the Jewell–Milligan method. As to be expected, when ![]() (no facing resistance), the lateral displacement profiles determined by the Wu–Pham method are identical to those obtained by the Jewell–Milligan method. As γb increases, the differences between the two methods become increasingly pronounced.
(no facing resistance), the lateral displacement profiles determined by the Wu–Pham method are identical to those obtained by the Jewell–Milligan method. As γb increases, the differences between the two methods become increasingly pronounced.
Measured lateral displacements data of a field‐scale experiment (Hatami and Bathurst, 2005, 2006) has been used to validate the Wu–Pham method. The wall, as shown in Figure 5.12, is a modular block facing reinforced soil wall. Figure 5.13 shows comparisons of lateral displacements of the wall under surcharge pressures of 50 kN/m and 70 kN/m, including measured displacements (Hatami and Bathurst, 2006), displacements calculated by the Jewell–Milligan method (1989), and displacements calculated by the Wu–Pham method (2010). It is seen that the lateral movement under both surcharge pressures calculated by the Wu–Pham method is in good agreement with the measured values, and the agreement is better than that of the Jewell–Milligan method. Note that the measured data indicate the wall has a higher bending stiffness than that indicated by both analytical methods.
Figure 5.12 Schematic diagram of a field‐scale modular block facing reinforced soil wall experiment (modified after Hatami and Bathurst, 2006)
Figure 5.13 Comparisons of measured lateral displacements with those predicted by the Jewell–Milligan method and the Wu–Pham method, under two surcharge pressures: (a) q = 50 kN/m and (b) q = 70 kN/m (Wu and Pham, 2010)
If the calculated maximum lateral displacement of a wall is found to be greater than a certain prescribed tolerable value, the lateral movement can be reduced by choosing a reinforcement of higher stiffness or by employing smaller reinforcement spacing.
5.3.4 Required Long‐Term Strength of Geosynthetic Reinforcement
In the prevailing design methods of reinforced soil walls with geosynthetics as reinforcement (e.g., AASHTO guidelines, 2002, 2014; FHWA‐NHI manual; Berg et al., 2009; NCMA manual, 2010), the required strength of geosynthetic reinforcement is determined by applying three reduction factors to account for installation damage, creep, durability, together with a safety factor to the ultimate strength of geosynthetic reinforcement. In the form of an equation, the allowable reinforcement strength, Ta, is
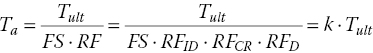
in which Tult is the ultimate wide‐width strip tensile strength of the geosynthetic, as per ASTM D4595 for geotextiles and D6637 for geogrids, based on the minimum average roll value (MARV) of the product (Note: MARV is the strength that is two standard deviations below the mean tensile strength); FS is the overall safety factor to account for various uncertainties; RF is a combined reduction factor to account for possible loss of strength during design life, which is equal to RFID ∙ RFCR ∙ RFD , where RFID is a reduction factor for installation damage; RFCR is a reduction factor for creep; and RFD is a reduction factor for chemical and biological degradation.
For the FHWA‐NHI method, RFID = 1.1–3.0, RFCR = 1.6–5.0, RFD = 1.15–2.0, and FS = 1.0 are recommended, resulting in k = 3–50%. Different states’ Departments of Transportation have adopted variations for the reduction factors and safety factor, hence different k‐values. Take the Colorado State Department of Transportation, for example, the following values have been employed: for preapproved geosynthetic products, FS = 1.78, RFID = 1.1–1.5, RFCR = 2.2–2.7, and RFD = 1.1, resulting in k = 13.6–17.0%; for non‐preapproved geosynthetic products, k = 2.8–6.6%. In other words, the allowable design strength is on the order of 15% of MARV for preapproved products and 5% of MARV for non‐preapproved products. These very low k‐values have excluded nearly all geotextiles in design of reinforced soil walls. Many privately financed GRS walls have ignored the recommended k‐values and have used geotextiles in design and construction. Most of these walls, many constructed over two decades ago, have performed satisfactorily.
In the following, we shall begin with a discussion of studies and findings of the three reduction factors in Eqn. (5‐11), namely, long‐term degradation reduction factor, installation damage reduction factor, and creep reduction factor. A discussion on long‐term design strength along with some recommendations then follows.
(A) Long‐Term Degradation
Studies conducted by Elias (2000) and Allen and Bathurst (2003) have indicated that long‐term degradation of geosynthetics in the in‐soil environment in typical reinforcement applications is very small. Of particular interest is a field‐scale experiment described in Section 4.2.3 and shown in Figure 4.29. The experiment conducted by the Public Research Institute (PWRI) of Japan is enlightening especially in regard to the influence of long‐term degradation of geosynthetic reinforcement. The experiment was initially designed to examine the failure surface of a 6.0‐m high GRS wall. After the wall was constructed, layers of geogrid reinforcement embedded in the wall were severed at preselected sections. The horizontal movement of the wall due to cutting of the reinforcements was essentially zero until the cutting approached approximately 0.2H from the wall face (H = wall height), at which time lateral movement increased by about 10 mm. The PWRI experiment suggests that stress relaxation in geosynthetic reinforcement might have completed at the time of cutting (within three days after construction). If stress relaxation is to reduce reinforcement loads to a very small value or zero, the geosynthetic reinforcement would no longer be serving any reinforcing function shortly after construction, hence long‐term degradation of the reinforcement will no longer be an issue. Cutting of reinforcements in the experiment can be viewed as an extreme form of degradation, in that the reinforcement is degraded into pieces.
(B) Installation Damage
Studies performed to investigate installation/construction damage of geosynthetics (e.g., Hufenus et al., 2005) have indicated that most installation damage does not severely affect the load–deformation behavior of woven geotextiles and geogrids, if at all, until damage levels become quite high. In applications where tensile resistance of reinforcement at low elongations is relevant (typical in GRS walls), the effects of moderate installation damage has been found to be very small. It has been suggested that RFID in Eqn. (5‐11) be designated as being close to unity, on the order of 1.0 to 1.1.
Allen and Bathurst (1996) have provided convincing evidence that installation damage would have little, if any, effect on creep strains and creep rates for typical levels of installation damage in full‐scale geosynthetic reinforced retaining walls. They concluded that in many cases, installation damage will have a negligible effect on the long‐term strength at working stress levels (i.e., the geosynthetic behaves as if it is not damaged).
(C) Creep
Geosynthetics, being polymeric materials, are generally considered susceptible to creep under sustained loads. Stress level, polymer type, manufacturing method, and temperature have been known to affect the creep potential of geosynthetics. When evaluating the creep potential of geosynthetic reinforcement in reinforced soil structures, however, it can be misleading to evaluate the creep potential based on laboratory tests performed by applying a sustained load directly to a geosynthetic specimen, as has been stipulated in the prevailing design guides. This is because the interaction between geosynthetic reinforcement and the time‐dependent deformation behavior of the confining soil must be taken into account when evaluating the long‐term creep behavior of geosynthetic reinforced soil structures. If the confining soil has a tendency to deform faster than the geosynthetic reinforcement (in isolation or subject to a confining pressure for pressure‐sensitive geosynthetics), the geosynthetic reinforcement will impose a restraining effect on the time‐dependent deformation of the soil through interface bonding forces. Conversely, if the confining soil tends to deform slower than the geosynthetic reinforcement (in isolation or subject to a confining pressure for pressure‐sensitive geosynthetics), the confining soil will then restrain the creep deformation of the reinforcement. This restraining effect is a direct result of soil–reinforcement interaction wherein redistribution of stresses in the confining soil and changes in tensile loads in the reinforcement will occur over time in an interactive manner (Wu and Helwany, 1996).
Creep of geosynthetics and geosynthetic reinforced soil mass has been discussed in some detail in Section 4.2.2. Field measured data have strongly suggested that creep deformation of geosynthetic reinforcement will not be a design issue when well‐compacted granular fill is used as backfill in the reinforced soil zone (Crouse and Wu, 2003; Allen and Bathurst, 2003).
(D) Discussion on Long‐Term Design Strength and Recommendations
To account for installation damage, creep, and durability of geosynthetic reinforcement, the prevailing design guides have suggested that the design strength be obtained by applying a combination of reduction factors to the short‐term strength (Eqn. (5‐11)). The value of the combined reduction factor typically depends on whether a geosynthetic is on a preapproved list; this value is typically about 5% of short‐term strength for non‐preapproved geosynthetics, and 15% for preapproved geosynthetics. This is hardly a sound approach, for three reasons.
- Soil–reinforcement interaction is known to be critical to creep of geosynthetic reinforcement, yet the approach is based on tests where loads are applied directly to geosynthetics specimens without any regard to soil–geosynthetic interaction (see Sections 4.2.1(B) and 4.2.2).
- There is no evidence that a compounding effect of installation damage and creep would occur. In fact there is evidence to the contrary (e.g., Allen and Bathurst, 1996; Greenwood, 2002), hence multiplication of individual reduction factors in Eqn. (5‐11) is not justified.
- Creep is a deformation problem resulting from soil–geosynthetic interaction, yet the approach employs simplistic reduction factors, of which the values are not based on a reliable and sufficiently large database, to account for influences of these factors on complicated long‐term creep deformation.
It is an indisputable fact that creep of geosynthetic reinforcement in a GRS is strongly influenced by time‐dependent deformation behavior of the soil surrounding the geosynthetic reinforcement. A rational assessment of long‐term design strength, therefore, must take the confining soil into account. If the time‐dependent behavior of a given backfill is in question, a laboratory test such as the SGIP test (Wu and Helwany, 1996; Ketchart and Wu, 2002), shown in Figures 4.23 and 4.25, is recommended for evaluation of the potential creep deformation of a GRS structure.
When a GRS wall is constructed with well‐compacted granular backfill, long‐term deformation and stability are generally not major design concerns. In this case, the use of a single combined factor to account for long‐term effects, uncertainty, and ductility is recommended. The value of this combined factor needs to be a function of soil properties and, to a lesser extent, geosynthetic type. Moreover, as noted in Section 5.3.1, when designing a GRS wall, the required minimum values of reinforcement stiffness, reinforcement strength and ductility strain still need to be specified.
For GRS walls with well‐compacted granular fill, the required minimum tensile stiffness in the direction perpendicular to the wall face (![]() ) can be determined by Eqn. (5‐3) (Note: Use 2% for bridge abutments and 3% for non‐load‐carrying walls are recommended). On the other hand, the required minimum reinforcement strength (Tult) can be obtained by imposing a ductility and long‐term factor Fdl on the required minimum tensile stiffness to ensure sufficient ductility and satisfactory long‐term performance, i.e.,
) can be determined by Eqn. (5‐3) (Note: Use 2% for bridge abutments and 3% for non‐load‐carrying walls are recommended). On the other hand, the required minimum reinforcement strength (Tult) can be obtained by imposing a ductility and long‐term factor Fdl on the required minimum tensile stiffness to ensure sufficient ductility and satisfactory long‐term performance, i.e., ![]() (Eqn. (5‐4)). In addition, the tensile strain corresponding to Tult on the load–deformation curve of the geosynthetic needs to be greater than the ductility strain (5–7% for most applications, based on a limited database) to ensure sufficient ductility.
(Eqn. (5‐4)). In addition, the tensile strain corresponding to Tult on the load–deformation curve of the geosynthetic needs to be greater than the ductility strain (5–7% for most applications, based on a limited database) to ensure sufficient ductility.
The following values for ductility and long‐term factor Fdl in Eqn. (5‐4) are recommended for design of GRS walls constructed with well‐compacted granular fill materials:
- Plasticity index (PI) is 3 or less:
- Fdl = 3.5 for all geosynthetics
- Plasticity index (PI) is between 4 and 6:
- Fdl = 5.5 for polypropylene geosynthetics
- Fdl = 5.0 for polyethylene geosynthetics
- Fdl = 4.0 for polyester geosynthetics
5.3.5 Connection Stability of Concrete Block Facing
Tatsuoka (1992) has provided strong evidence that facing rigidity has a significant effect on wall performance and the distribution of tensile loads in the reinforcement. For a reinforcement layer that is securely connected to rigid facing, the largest tensile load in the reinforcement layer will occur at the wall face. On the other hand, if the facing rigidity is low, the largest tensile load will occur away from the wall face.
This section focuses on concrete block facing of a GRS wall, particularly the requirements for connection stability. The facing connection requirements are influenced by lateral earth pressure exerted on the facing, which is reflected by tensile loads in the geosynthetic reinforcement at the wall face. For a concrete block GRS wall, if light‐weight dry‐stacked blocks (e.g., concrete masonry units, CMU) are employed, the global bending rigidity is rather low, hence the reinforcement load at the facing will be rather small and connection requirements will be little to none. On the other hand, if heavy modular blocks or strong facing connection enhancement elements (e.g., pins, lips, or keys) are employed, the lateral earth pressure on the wall face will be significantly higher.
Speaking of lateral earth pressure, an explanation of the difference between lateral pressure and lateral stress is in order. According to Webster’s dictionary, the term pressure is used to describe the intensity of forces exerted against an opposing body, whereas the term stress is used to describe the intensity of an applied force or system of forces that tends to strain or deform a body. For a gravity wall or a cantilever wall, the lateral stress in the soil mass is considered equal to the lateral soil pressure on the wall. However, lateral stress within a reinforced soil mass can be quite different from lateral earth pressure exerted by a reinforced soil mass on the wall face. The difference between pressure and stress is especially relevant for closely spaced GRS walls. Due to the constraints to lateral deformation in a reinforced soil mass (resulting from frictional resistance at the soil–reinforcement interface), the lateral earth pressure against the wall face can be much smaller than the lateral stress within a reinforced soil mass (Wu, 2001, 2007). This point is elaborated below.
For a hypothetical reinforced soil wall of which the reinforced soil mass experiences no lateral deformation, the lateral earth pressure on the facing at all depths will be zero. The lateral soil stress within the reinforced soil mass however is not zero; it will typically increase with depth, much like in an unreinforced earth retaining wall. We shall begin the discussion on lateral earth pressure and lateral stress in a GRS wall by examining some analysis results. Chou and Wu (1993) conducted a study to investigate the behavior of GRS walls on 0.3 m reinforcement spacing by the finite element method of analysis. The lateral pressures/stresses along three sections of a GRS wall were examined: lateral earth pressure against the wall face, lateral earth pressure behind a reinforced soil mass, and lateral stresses within the reinforced soil mass along the plane of maximum reinforcement tensile loads, as shown in Figure 5.14. It is seen that the pressures/stresses in those three sections are quite different. The lateral earth pressure against the wall face, the smallest of the three, is nearly constant with depth except near the base of the wall where there is greater constraint to deformation. The lateral stress along the plane of maximum reinforcement tensile loads is roughly parallel to the lateral earth pressure profile on the facing, but greater in magnitude. The earth pressure behind the reinforced soil mass, which is commonly used to evaluate the external stability of reinforced soil walls, is seen to be rather close to the Rankine active earth pressure.
Figure 5.14 Lateral stress/pressure profiles along three different sections of a GRS wall: lateral pressure on wall face, lateral pressure on the back of reinforced soil mass, and lateral stress along the plane of maximum tensile loads (Chou and Wu, 1993)
In an idealized situation where every reinforcement layer in a reinforced soil wall is able to restrain perfectly lateral deformation of the soil, the lateral pressure on the wall face will be zero at the exact depth of the reinforcement layer. Between any two adjacent reinforcement layers, the lateral earth pressure will vary from zero at one layer, increase somewhat with depth due to gravity, and decrease back to zero at the other layer. We can therefore picture the condition between “any” two adjacent reinforcement layers as that of a bin. Since reinforcement in an actual wall is not perfectly rigid, a bin pressure diagram (see Figure 5.15) has been recommended for design by Wu (2001, 2007). The lateral earth pressure within any bin would increase approximately linearly with depth to a limiting value of ![]() before decreasing to a small value at the next reinforcement layer. The bin pressure diagram shown in Figure 5.15 is a reasoned pressure diagram and is applicable when the following four conditions are met:
before decreasing to a small value at the next reinforcement layer. The bin pressure diagram shown in Figure 5.15 is a reasoned pressure diagram and is applicable when the following four conditions are met:
- The facing offers insignificant restraint to lateral movement of the reinforced soil mass.
- The fill material behind the facing is free‐draining so that there is little or no hydraulic pressure involved.
- The soil–reinforcement interface bonding is maintained under the design load.
- The reinforcement is sufficiently stiff.
Figure 5.15 The bin pressure diagram (Wu, 2001)
Note that the bin pressure is independent of wall height, and is only a function of reinforcement spacing and the strength parameters of the soil. The resultant lateral thrust of a bin (Tbin) increases with the square of reinforcement spacing, i.e., ![]() (sv = reinforcement spacing), and is independent of depth. The bin pressure “postulate” has been found to collaborate well with field‐scale experiments of GRS where the lateral earth pressure was measured by fatback pressure cells (Iwamoto et al., 2015) and field measurement data of GRS–IBS abutments in Louisiana (Saghebfar et al., 2017).
(sv = reinforcement spacing), and is independent of depth. The bin pressure “postulate” has been found to collaborate well with field‐scale experiments of GRS where the lateral earth pressure was measured by fatback pressure cells (Iwamoto et al., 2015) and field measurement data of GRS–IBS abutments in Louisiana (Saghebfar et al., 2017).
For concrete block GRS walls in non‐load‐bearing applications, the bin pressure diagram is applicable to walls with light‐weight block facing. For GRS bridge abutments, the bin pressure diagram is applicable only up to a certain load level (available data have suggested the limiting surcharge pressure is about 200 kPa). A safety factor of 2.0 is recommended for checking connection requirements when the bin pressure diagram is employed. For concrete block GRS walls with tight reinforcement spacing (say, spacing ≤ 0.3 m) and reinforcement is placed at every course of facing blocks, the lateral earth thrust has been found to be always smaller than the frictional resistance between facing blocks, hence no special design provisions for facing connection stability are needed for walls in these conditions.
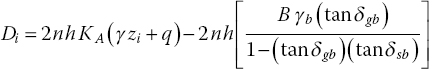
To be on the conservative side, Wu and Payeur (2015) ignored the bin effect and assumed that the lateral earth pressure against the facing follows the Rankine active earth pressure (i.e., the pressure increases with depth along the wall height). Wu and Payeur derived a set of connection force equations based on force equilibrium to evaluate the stability of block facing. The driving (de‐stabilizing) force Di and the resisting (stabilizing) force Ri at the geosynthetic–block interface at depth zi are:
Geosynthetic–block interface:
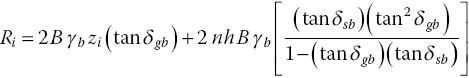
If the number of facing blocks between adjacent reinforcement layers, denoted by n, is 2 or more, connection failure at the block–block interface should also be checked. The driving force Di and resisting forced Ri at the block–block interface at depth zi become (applicable only to n ≥ 2):
Block–block interface:
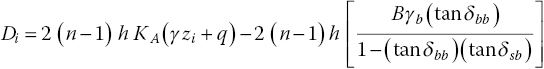

in which n = number of courses of facing blocks between adjacent reinforcement layers, h = height of each facing block (use the largest h‐value if more than one block height is employed), γ = unit weight of soil, ϕ = friction angle of soil, KA = coefficient of Rankine active earth pressure ![]() , B = equivalent depth of facing block unit (see explanation below), γb = bulk unit weight of facing block (see also explanation below), δbb = block–block friction angle, δgb = geosynthetic–block friction angle, δsb = soil–block friction angle, and q = uniform vertical surcharge on the wall crest. The equivalent depth of a facing block is equal to the total horizontal surface area of the facing block divided by the width of the facing block. For a block containing hollow cells on its surface, the equivalent depth will be smaller than the exterior depth of the block. Similarly, the bulk unit weight of a facing block is the total weight of the block divided by the exterior volume of the block. For a block containing hollow cells, the bulk unit weight will be smaller than the unit weight of the block material.
, B = equivalent depth of facing block unit (see explanation below), γb = bulk unit weight of facing block (see also explanation below), δbb = block–block friction angle, δgb = geosynthetic–block friction angle, δsb = soil–block friction angle, and q = uniform vertical surcharge on the wall crest. The equivalent depth of a facing block is equal to the total horizontal surface area of the facing block divided by the width of the facing block. For a block containing hollow cells on its surface, the equivalent depth will be smaller than the exterior depth of the block. Similarly, the bulk unit weight of a facing block is the total weight of the block divided by the exterior volume of the block. For a block containing hollow cells, the bulk unit weight will be smaller than the unit weight of the block material.
Since geosynthetic reinforcement can only resist tensile force, when driving force Di determined from Eqn. (5‐12) or (5‐14) turns out to be a negative value (i.e., compressive), it should be set equal to zero. Connection failure is said to occur whenever Di ≥ Ri.
Using the connection force equations (i.e., Eqns. (5‐12) to (5‐15)), Wu and Payeur (2015) examined driving and resisting forces for block walls under some common conditions. The following are highlights of their findings:
- For reinforced soil walls on 0.2 m and 0.4 m reinforcement spacing (i.e., n = 1 and n = 2), the net connection forces (Note: Net connection force = resisting force – driving force) are found to be always positive (i.e., stable) for reinforced soil walls with light‐weight facing blocks and without any connection enhancement elements. Figure 5.16 shows the profiles of net connection forces at the geosynthetic–block interface, which is typically more critical than at the block–block interface for reinforcement spacing of 0.2 m, 0.4 m, and 0.6 m (i.e., n = 1, n = 2, and n = 3). The net connection forces in the top 0.5 m of GRS walls are, however, rather small for all values of reinforcement spacing. This suggests that the common practice of adding concrete mix in the cells of the top 2–3 courses of light‐weight blocks to tie these blocks together (see Section 6.1.1 and Figure 6.1) is a sensible measure.
- For reinforced soil walls on 0.6 m reinforcement spacing (i.e., n = 3), the net connection force is quite sensitive to the frictional angle at the geosynthetic–block interface; unless the geosynthetic–block interface friction is sufficiently high (35° or higher in most cases), facing connection failure will likely occur.
- Tight reinforcement spacing (say, spacing ≤ 0.3 m) is very beneficial for improving the safety margin of concrete block GRS walls against facing failure.
- For reinforced soil walls with friction‐connected light‐weight concrete block facing on reinforcement spacing of 0.2 m and 0.4 m (i.e., n = 1 and n = 2), the net connection forces would increase with depth (see Figure 5.16) and there is no limit to wall height in terms of connection failure. The satisfactory performance of a 16.7‐m high wall (with sv = 0.2 m) as shown in Figure 5.17 (cf. Figure 3.28(b), photo taken in late spring) is therefore of no surprise. Note that this is not the case for reinforcement spacing of 0.6 m (i.e., n = 3), see Figure 5.16. The common perception that a higher wall is more susceptible to connection failure (e.g., Dallaire, 2001) is true only for walls on larger reinforcement spacing.
- As can be expected, the stability of facing connections can be improved appreciably by increasing the bulk unit weight of facing blocks, the equivalent depth of facing blocks, and/or the friction angle of the backfill (e.g., with better fill compaction).
Figure 5.16 Net connection forces (sum of resisting forces minus driving forces) at geosynthetic–block interface with 1, 2 and 3 blocks between successive reinforcement layers under a surcharge load of 10 kPa (Wu and Payeur, 2015)
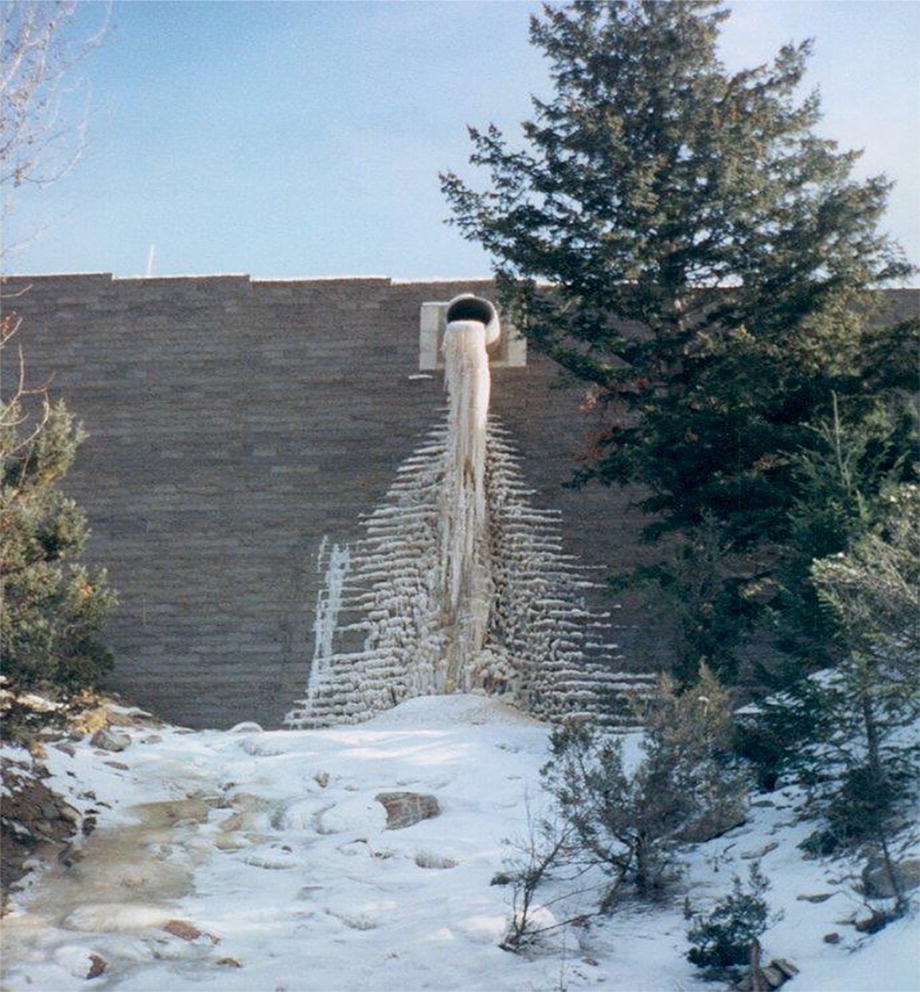
Figure 5.17 A 16.7‐m (55‐ft) high GRS wall with light‐weight frictionally connected concrete block facing, seen is an ice cliff that builds and recedes all winter long (courtesy of Bob Barrett)
Many builders of concrete modular block geosynthetic walls have routinely opted for using pins, blocks with lips or keys, and/or heavy‐weight blocks to presumably improve facing stability. These measures, while increasing the resisting forces of the facing, also attract more loads to the wall face (and to the connection between blocks), hence increase the earth thrust exerted on the wall face (i.e., larger than Rankine thrust). As a result, the resisting and driving forces at the facing connections are both increased. The use of facing connection enhancement measures may not necessarily improve facing stability. The net effect can be evaluated by the connection force equations, Eqns. (5‐12) to (5‐15). Note again that the driving forces in these equations were derived conservatively based on Rankine earth pressure theory; the bin effect was not accounted for in the derivation.
5.3.6 Required Reinforcement Length
A uniform reinforcement length of 0.6H to 0.7H (where H = total wall height at face), with a minimum length of 2.4 m (8 ft), is common for reinforced soil walls and abutments. This is a result of three major design guidelines: the AASHTO Bridge Design Specifications, later AASHTO LRFD Bridge Design Specifications (AASHTO, 2002, 2014), the FHWA NHI manual (Berg et al., 2009), and the NCMA manual (NCMA, 2010). The NCMA design manual, widely used in the private sector, requires a minimum reinforcement length of 0.6H. A minimum length of 0.7H, on the other hand, has been specified in the FHWA and AASHTO guides that are used routinely in the public sector. The standard of practice in Europe and Asia uses a similar criterion for minimum reinforcement length: 0.7H for routine applications and 0.6H for low lateral load applications with a minimum length of 3 m (BSI, 1995; GEO, 2002). Brazilian guides, perhaps the most conservative of all, require a minimum reinforcement length of 0.8H.
Despite the popularity of the 0.6–0.7H rule, uniform reinforcement lengths as small as 0.3–0.4H have been employed with good success for construction of GRS walls. Shorter reinforcement length is considered a worthy subject because it can result in significant cost savings, especially in situations where construction involves excavation of existing ground. Another important design concern is with short reinforcement lengths in the lower part of a GRS wall (referred to as truncated‐base walls). In situations where excavation into rock or stiff deposits to allow for a uniform reinforcement length would involve significantly higher costs, use of shorter reinforcement lengths in the lower part of a wall usually proves to be very cost‐beneficial. There are, however, design concerns with such a measure.
The following begins with a review of research and case histories on short reinforcement lengths and concludes with a discussion of related issues. Both uniform reinforcement length walls and truncated base walls are addressed. GRS walls involving a constrained fill zone (i.e., walls where rock, heavily overconsolidated soil, or a nailed wall is present within a short distance from the wall face) are also discussed.
(A) Research and Case Histories
- Reinforced Soil Walls with Uniform Reinforcement Length
When it comes to short reinforcement lengths, the research by Fumio Tatsuoka and the Japan Railway (Tatsuoka et al., 1992, 1997; Tatsuoka, 2008) was among the first. Beginning in the mid‐1980s, Tatsuoka and his associates at the Japan Railway Technical Research Institute developed a GRS wall system with full‐height rigid facing, referred to as the CIP‐FHF (cast‐in‐place full‐height facing) system (Section 3.4.3). Due to its superior performance in resisting strong earthquakes and heavy rainfalls over conventional cantilever walls and metallic reinforced earth walls, the CIP‐FHF system became the “default” wall type for retaining walls constructed by the Japan Railway. To date, over 120 km of CIP‐FHF GRS walls have been built all over Japan with great success.
As noted in Section 3.4.3, the CIP‐FHF system involves a two‐stage construction procedure. In the first stage, a GRS wall with geosynthetic reinforcement of 0.3–0.4H in length and typical spacing of 0.3 m is constructed using stacked gravel gabions as facing. The wall is allowed to deform under its self‐weight before starting the second stage of construction, which involves installing full‐height rigid concrete facing (cast‐in‐place) over the gabion face GRS wall. The rigid concrete facing is attached to the reinforced soil mass via protruded steel bars that are embedded in the GRS mass during the first stage. Despite the short reinforcement lengths of 0.3–0.4H, none of the walls have ever experienced failure. Both granular and cohesive backfills have been used in the construction of CIP‐FHF wall systems. Tatsuoka and his associates suggested that overturning may be the most critical mode of failure for reinforced soil walls with short reinforcement lengths of 0.3–0.4H, whereas lateral sliding is typically the governing failure mode for walls with reinforcement lengths of 0.6–0.7H.
In a rebuttal to Tatsuoka’s comments regarding CIP‐FHF GRS walls vs. reinforced earth walls (with steel strips as reinforcement), Segrestin (1994), of Terre Armée International, stated that a number of reinforced earth walls with reinforcement length as low as 0.45H had been constructed successfully. Segrestin also stated that a very tall (10.5‐m high) reinforced earth wall with reinforcement length of 0.48H had demonstrated satisfactory performance. Segrestin maintained that the basic mechanism and behavior of reinforced soil structures with reinforcement lengths between 0.4H and 0.7H were identical, and this had been validated by a finite element parametric study conducted by Terre Armée.
Bastick (1990) conducted finite element analysis of MSE walls undergoing changes due to reduced reinforcement length. It was found, similar to Terre Armée’s finding, that the performance of an MSE wall would remain practically the same as long as the reinforcement lengths were kept above 0.4–0.5H and the reinforcement spacing stayed the same. The finding was confirmed by a full‐scale experiment with reinforcement length of 0.48H loaded to an average surcharge of 840 kPa.
There are two distinct situations when very short reinforcement lengths find their way into reinforced soil walls: (a) walls with a constrained fill zone, where a rock or heavily overconsolidated soil outcrop or an existing nailed wall is present in the back of the reinforced soil wall, in which the space constraint makes the commonly used reinforcement length of 0.6–0.7H impractical (Lawson and Yee, 2005), and (b) walls with the end of reinforcement being anchored by metal plates or geosynthetic loops (Fukuoka et al., 1986; Brandl, 1998). Situation (a) is in line with the scope of this subject and will be elaborated further.
Lawson and Yee (2005) proposed a design‐and‐analysis method for reinforced soil retaining walls involving a constrained fill zone. Within the constrained reinforced fill zone, the full active failure wedge is unable to develop because of the close proximity of the rigid zone behind the reinforced fill. In this method, the magnitude of horizontal thrust acting on the wall face, Ph , is evaluated as
 . Lawson and Yee concluded that for walls with reinforcement lengths greater than 0.5H, the Rankine active wedge can fully develop within the granular fill zone, hence the lateral earth pressure coefficient, K, is equal to KA. However, if reinforcement length is less than 0.5H, the full active wedge cannot develop fully and the magnitude of the lateral earth pressure coefficient will decrease with decreasing reinforcement lengths.
A glaring example of reduced lateral thrust for walls with a constrained fill zone is a very tall wall constructed by Lin et al. (1997) in Taiwan, a country where very heavy seasonal rainfall occurs annually. The wall was 39.5 m high, constructed in six tiers (three 8‐m tall tiers and three shorter tiers). The geogrid reinforcement length was 1.5 m, or 0.19H. All tiers, despite having to carry the soil weight from upper tiers, performed satisfactorily even with the very short reinforcement length. It is interesting to note that the reinforcement length of 0.19H happens to coincide with the finding of a numerical study (Vulova, 2000; Vulova and Leshchinsky, 2003). The numerical study also agreed well with Tatsuoka’s assertion that overturning will be the control failure mode for a MSE wall with short reinforcement lengths.
Morrison et al. (2006) performed centrifuge tests on shored MSE walls where a constrained fill zone is present due to the shoring and reported the following:
- Reinforcement lengths in the range of 0.25–0.6H generally produce stable wall systems.
- Reinforcement lengths of 0.25H or smaller generally produce outward deformation followed by an overturning collapse of the MSE mass under increasing gravitational levels.
- For reinforcement lengths less than 0.6H, deformation produced a “trench” at the shoring interface, interpreted to be the result of tension; the trench was not observed with reinforcement lengths of 0.6H or greater.
- A conventional MSE wall with retained fill and a reinforcement length of 0.3H was observed to be stable up to an acceleration level of 80g, which represents a prototype height of approximately 27 meters.
It has been suggested that a shorter reinforcement length may result in larger lateral displacements and likely larger settlement as well. A finite element study conducted by Chew et al. (1991) showed that reducing reinforcement length from 0.7H to 0.5H caused about a 50% increase in lateral deformation. Ling and Leshchinsky (2003) reported that, with a reinforcement length of 0.5H, a reinforced soil wall would produce satisfactory performance considering the maximum displacement mobilized in the reinforcement layers. A study by Liu (2012) suggested that the larger lateral displacement when shorter reinforcement is used may be a result of larger lateral deformation of the soil behind the reinforced zone.
It is of interest to note that a reinforced soil mass with closely spaced reinforcement and well‐compacted fill tends to behave as a coherent mass. This behavior was observed in two loading experiments of full‐scale concrete block facing GRS bridge abutment walls, referred to as the NCHRP GRS test abutments (Wu et al., 2006, 2008). Two different woven geotextiles of different values of stiffness and strength were used as reinforcement, each 3.15 m long and on 0.2 m spacing. The backfill was a non‐plastic silty sand, and the abutment was loaded by applying increasing vertical loads onto a strip footing near the front face. A tension crack was observed on the wall crest in both experiments. The tension crack was located exactly at the extent of the reinforced zone (i.e., 3.15 m from the backface of the facing blocks) under an applied pressure between 150 and 200 kPa. The location of the tension cracks suggests that the reinforced soil mass behaves as a coherent mass for GRS walls with closely spaced reinforcement. This also explains why eccentricity (lift‐off) has been the most critical failure mode with short reinforcement lengths of 0.3–0.4H, especially for walls with closely spaced reinforcement. The only exception is when a constrained fill zone is present.
- Reinforced Soil Walls with a Truncated Base
A reinforced soil wall with shortened reinforcement lengths in the lower part of the wall, known as a truncated‐base wall, is often used when excavation to allow for uniform reinforcement lengths is cost prohibitive. The reduction in reinforcement lengths commonly takes one of two forms: stepped truncation (reducing lengths in groups of 2 to 4 reinforcement layers) and trapezoidal truncation (reducing lengths approximately linearly with depth).
A truncated base for MSE walls is allowed in the FHWA NHI manual. The manual provides general guides for a truncated base, and states that this provision should only be considered if the base of the MSE wall is founded on rock or competent soil; competent soil is a soil which exhibits minimal post‐construction settlement. For foundation soil less than competent, a ground improvement technique may be used prior to construction.
The British Standard BS 8006 design manual (BSI, 1995) for MSE walls also allows use of a truncated base. It states that a truncated base (or trapezoidal) wall should only be considered where foundations are formed by excavation into rock or other competent foundation conditions exist. The manual prescribes a minimum reinforcement length of 0.4H for the lower portion of the wall. Hong Kong’s Geoguide 6 (GEO, 2002) essentially follows the FHWA NHI manual, except it stipulates that soil arching needs to be accounted for in the design.
Japan Railway allows reinforcement with truncated lengths in the lower part of a GRS wall be used when the costs of excavation to allow for full‐length reinforcement are high (Tatsuoka et al., 1992, 2005; Morishima et al., 2005). The walls constructed with a truncated base have been reported to have performed satisfactorily during heavy rainfall and severe earthquake events.
Segrestin (1994) of Terre Armée International reported on the applications of truncated‐base walls with steel‐strip reinforcement in situations where constrained fill is present. It has been reported that wider metal strips, or more often an increased number of strips, have been employed in truncated base reinforced earth walls.
The Colorado Department of Transportation constructed a 7.6‐m high GRS wall with a truncated base in the DeBeque Canyon along Interstate Highway 70 (Wu, 2001). For comparison purposes, a 10‐m long control section was also constructed with full‐length reinforcement throughout (termed “the control wall”). A road base material was used as backfill, and the wall was situated over a firm foundation. Lateral displacements of the control wall (reinforcement length = 5 m) and the truncated‐base wall (reinforcement length at base = 1.1 m, or 0.14H), taken 6 months after construction, were found to be very similar, both on the order of 3–6 mm, with the maximum displacement being 8 mm. Adams et al. (2011a) of the Federal Highway Administration also reported a number of GRS abutments with a truncated base. The GRS abutments have been reported to have performed satisfactorily.
Lee et al. (1994) conducted a forensic study on a series of failed walls founded on rock and concluded that the resistance against sliding failure is reduced by the truncated base due to a smaller base area. They noted that soil arching due to the rock behind the fill would reduce vertical stress above the back of the lower reinforcements, hence can lead to overestimation of resistance to pullout failure.
Thomas and Wu (2000) conducted a finite element study on the behavior of GRS walls with a truncated base. The major findings of the study are as follows:
- When designing a GRS wall with a truncated base, external stability should be thoroughly checked; truncated base walls are more likely to experience lateral sliding failure and lift‐off failure. The length of reinforcement at the lowest level of a truncated base wall should be at least 0.35H or 0.9 m.
- Fill type and fill compaction play an especially important role in the performance of GRS walls with a truncated base. The use of cohesive backfill should be completely avoided for truncated base walls.
- The foundation soil needs to be sufficiently stiff (with little post‐construction settlement) to permit construction of truncated‐base walls.
(B) Discussions and Concluding Remarks
A minimum reinforcement length of 0.6–0.7H (H = height of the wall at the wall face) has been used in most design guides for GRS/GMSE walls with a uniform reinforcement length throughout. However, walls with uniform reinforcement lengths as small as 0.3–0.4H have consistently been shown to be stable, and studies have suggested that GRS walls with reinforcement length between 0.4H and 0.7H behave approximately the same. For situations where a uniform reinforcement length is employed, a minimum reinforcement length of 0.6H is well justified. A minimum reinforcement length of 0.7H is overly conservative, especially for closely spaced reinforcement (spacing not more than 0.3 m). Care must be exercised to prevent tension crack on the wall crest if the wall is to carry significant vertical loads near the wall face (e.g., bridge abutments). Extending the top 1 to 2 layers of reinforcement well beyond the assumed failure plane would help in eliminating the tension cracks.
Use of shorter reinforcement for reinforced soil walls, with a uniform reinforcement length of 0.35–0.5H, will result in larger lateral movement than those with a uniform reinforcement length of 0.6H, and is recommended only if the following four conditions are met:
- The wall will not be subject to heavy edge loads, such as a bridge abutment wall.
- Free‐draining granular backfill is employed and well compacted.
- The foundation is competent (little post‐construction settlement).
- External stability, especially against lift‐off (eccentricity) failure and lateral sliding failure, is thoroughly checked.
Use of a truncated base is a viable measure when the cost of excavation to allow for uniform reinforcement length is impractical. There is strong evidence based on a large number of case histories and research studies that a truncated base wall will perform satisfactorily as long as the base of a reinforced soil wall is founded on competent foundation, and external stability, especially sliding and eccentricity (i.e., lift‐off) stability, is ensured. The reinforcement length at the lowest level should generally be at least 0.3H. However, it can be significantly smaller (as small as 0.1H has been used routinely by the Japan Railway) if a constrained fill is involved (i.e., there is firm existing overconsolidated soil within a short distance behind the wall).
5.4 The U.S. Forest Service (USFS) Design Method
This section describes a design method, known as the U.S. Forest Service (USFS) method (developed in 1977 and revised in 1983). The method was the very first design method developed for reinforced soil walls with geosynthetics as reinforcement, and laid the groundwork for all subsequently developed design methods. A design example is given to illustrate how to use the USFS design method. The method assumes the wall is with a wrapped geotextile face. However, the design concept is applicable to geosynthetic reinforced soil walls of different types of flexible facing. The method is known to be very conservative and is very reliable for routine designs.
5.4.1 Design Procedure: The U.S. Forest Service Method
Step 1: Establish wall profile and check design assumptions
A wall profile should be established from the grading plan of the wall site. The following design assumptions should be verified:
- wall face is vertical or near vertical; i.e., no more than 10° off the vertical, or steeper than a batter of 1 (horizontal) to 7 (vertical)
- wall crest is essentially horizontal
- backfill is granular and free‐draining
- wall is constructed over a firm foundation; i.e., very small post‐construction settlement
- live loads are essentially vertical
- no concern for seismic loads
If any of the design assumptions are not satisfied or if the wall geometry cannot be approximated as an equivalent system that satisfies the design assumptions, the design method should not be used.
Step 2: Determine backfill properties ϕ and γ
The drained friction angle of the fill material, ϕ (more precisely ϕ'), can be estimated conservatively by an experienced soils engineer or determined by performing appropriate direct shear or triaxial tests. The unit weight, γ, can be estimated or determined by a test. Generally, the unit weight at 95% Standard Proctor relative compaction (i.e., 95% of AASHTO T‐99 maximum unit weight) is specified. However, other densities may also be specified as long as the friction angle ϕ is consistent with the density.
Step 3: Develop a lateral earth pressure diagram due to overburden plus surcharge
The friction angle ϕ determined in Step 2 can be used to calculate the coefficient of earth pressure at rest, ![]() , and determine the lateral earth pressure diagram along the height of the wall due to overburden (soil self‐weight) plus surcharge (see Figure 5.18). The lateral earth pressure at depth z (measured from the crest) is:
, and determine the lateral earth pressure diagram along the height of the wall due to overburden (soil self‐weight) plus surcharge (see Figure 5.18). The lateral earth pressure at depth z (measured from the crest) is:
where K0 is the coefficient of earth pressure at rest, and q is the vertical surcharge pressure uniformly applied on the wall crest.
Figure 5.18 Combined lateral earth pressure on facing due to soil self‐weight plus surcharge and live loads, the USFS design method
Step 4: Develop a lateral earth pressure diagram due to live loads
Boussinesq theory allows determination of stress at any point within a semi‐infinite elastic soil mass due to a single point vertical load applied on the crest (the top surface of the soil mass). Boussinesq theory also allows lateral stress within a soil mass to be determined, which can be regarded as being equal to lateral earth pressure on a virtual wall face. Boussinesq theory is used in the USFS design method to determine lateral earth pressure due to loads applied on the crest of a reinforced soil wall.
For a concentrated vertical live load P applied on the crest, the lateral earth pressure at depth z on the wall face can be evaluated by the Boussineq equation:
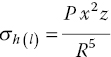
where σh(l) is the lateral earth pressure on the wall face at depth z due to a concentrated vertical live load P applied at a point with a horizontal distance x from the wall face (distance measured in the orientation perpendicular to wall face), and R is the radial distance from the point where P is applied to the point where σh(l) is being calculated. The lateral pressure profile due to live loads, σh(l) , is commonly evaluated at 0.6‐m (2‐ft) vertical intervals (i.e., z = 0.6 m, 1.2 m, or 2 ft, 4 ft, etc.) along the height of the wall. The lateral pressure profile due to live loads (see Figure 5.18) can be obtained from the influence diagram shown in Figure 2.11. The diagrams are conservative (see Section 2.2.6) for evaluation of σh(l). When multiple live loads are present, σh(l) can be obtained by superimposing earth pressure due to each live load. An example for calculating lateral earth pressure due to an eight‐wheel 40‐kip (178 kN) dual tandem axle truck can be found in Steward et al. (1977) and Koerner (2005), and is given (with modifications) in Section 5.4.2. Normally, more than one section along the wall should be checked to determine the most critical section. The values of live loads P can be determined as the larger value between 1.5 × (legal loads) and 1.2 × (heavy loads).
Step 5: Develop a combined lateral earth pressure diagram
The lateral earth pressure diagrams determined from Steps 3 and 4 are superimposed to form a combined lateral earth pressure diagram, similar to that shown in Figure 5.18.
Step 6: Determine the vertical spacing of reinforcement layers
The vertical spacing between reinforcement layers, sv, is determined as:

where Tult is the ultimate strength of the reinforcement; Fs is the factor of safety, which should at least be 1.2–1.5, depending on the confidence level in the value of Tult ; and σh is lateral earth pressure at the mid‐depth of a layer, as obtained from the combined pressure diagram (Step 5). The value of Tult may be specified by either Method A, the wide cut strip tensile test, or Method B, a combination of grab tensile and 25‐mm (1‐in.) cut strip tests. The tests should be performed with the reinforcement in its weakest principal direction, and Method A is generally preferred over Method B.
To account for long‐term creep potential, a reduction factor should be applied to the tensile strength obtained from the tests. The value of the reduction factor depends on the test method, the polymer type, and style of the reinforcement, as follows:
| Polymer Type and Style | Method A | Method B |
| Polyester needled | 0.7 | 1.0 |
| Polypropylene needled | 0.55 | 0.8 |
| Polypropylene bonded | 0.4 | 0.6 |
| Polypropylene woven | 0.25 | 0.4 |
When Method A is used for determination of Tult , the following conditions should be observed:
- The aspect ratio (the ratio of width to gauge length) of the test specimen should be 2 or greater. The minimum gauge length (between grips of test specimen) should be 100 mm (4 in.).
- The test should be performed at a constant strain rate of 10% per minute.
- The test should be performed at 65 + 2% relative humidity and 21 ± 1°C (70 ± 2°F) temperature.
- The test specimen should be soaked in water for at least 12 hours and maintained surface damp during the test.
- The grips used in the test should not weaken the specimen and should be able to hold the specimen without slippage. Tests which fail at the grips should be disallowed. If slippage cannot be sufficiently limited, elongation must be measured between points on the specimen rather than between the grips.
- Test results should include applied tensile force per unit width of specimen vs. strain curve, failure load per unit width, and strain at failure.
When using Method B to determine Tult , the smaller value of the following two strengths should be used: (i) 90% of the 25‐mm (1‐in.) cut strip strength or (ii) 33% of the grab tensile strength.
Step 7: Determine the length of reinforcement required to develop pullout resistance
As shown in Figure 5.19, the total length of reinforcement, L, required to prevent pullout failure from occurring is equal to the sum of the anchored length behind the potential failure plane, Le , and the length within the potential failure zone, Lf . For a reinforcement located at depth z below the crest,
in which
where H is the wall height and z is the depth of the reinforcement layer being considered. The safety factor against pullout failure, Fs , should be at least 1.5–1.75. A minimum value of ![]() should be used.
should be used.
Figure 5.19 Notations for describing the USFS design method
When different soils are used above and below a reinforcement layer, the equation for calculating Le is modified as:
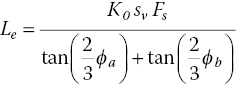
where ϕa and ϕb are the friction angles of the soils above and below the reinforcement layer, respectively.
Following the equations above, the reinforcement layers near the base can be shorter than near the top to satisfy the internal stability requirement of a reinforced soil structure. However, due to external stability considerations (Step 9), particularly with respect to sliding and bearing capacity, and to avoid confusion in the actual reinforcement placement sequence in the field, all reinforcement layers are usually taken as being of a uniform length.
Step 8: Determine the wrapped length of reinforcement into the wall face
The wrapped length of reinforcement into the wall face, Lo (see Figure 5.19) can be determined as:
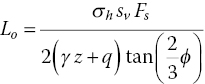
The minimum value of safety factor, Fs, is 1.2–1.5. The minimum value of Lo is 0.9 m (3 ft). It is very important to abide by this minimum Lo value.
Step 9: Check external stability
The external stability of the reinforced soil wall against overturning failure, base sliding, bearing failure, and overall slope failure should be checked. The checks should be carried out by treating the reinforced soil mass as a rigid wall.
- For overturning failure check, stabilizing and destabilizing overturning moments about the toe of the wall should be calculated to determine the safety factor against overturning failure. Typically, a minimum safety factor of 1.5 is needed.
- For base sliding failure check, stabilizing and destabilizing forces along the base of the wall should be calculated to determine the safety factor against sliding failure. Typically, a minimum safety factor of 1.5 is needed.
- For bearing failure check, the applied resultant load (typically an inclined resultant load) at the base of the wall (due to self‐weight of the wall, externally applied loads on the crest, and lateral earth thrust against the reinforced soil mass) and the load‐carrying capacity of the ground beneath the base of the wall should be calculated (by using the bearing capacity equations for shallow foundation, e.g., NAVFAC, 1986; Terzaghi et al., 1996) to determine the safety factor against bearing failure. Typically, a minimum safety factor of 3.0 is needed.
- For overall slope failure check, slope stability software is usually needed to evaluate the safety factors of the different assumed slip planes of the wall, involving soil behind and below the reinforced soil mass, and determine the minimum safety factor against overall slope failure. Typically, a minimum safety factor of 1.3 is needed.
If any of the required minimum safety factors are not met, one of the following two measures (or combination of the measures) could be taken to achieve required safety margins: (i) revise the design, such as decrease reinforcement spacing, increase reinforcement length, decrease wall height, etc., or (ii) improve the soil, including use of better reinforced fill material, improve fill compaction, improve the foundation soil, etc.
5.4.2 Design Example: The U.S. Forest Service Method
Given Conditions:
A typical cross‐section of a wrapped‐faced geotextile‐reinforced soil retaining wall is shown in Figure 5.20.
Figure 5.20 Cross‐section of a wrapped‐faced GRS wall and loads involved, design example of the USFS design method
Features of wall:
- uniform wall height: H = 12 ft
- near‐vertical wall
- all geosynthetic reinforcement layers have the same length
- no concern for erosion or other unfavorable events at the wall base during design life, no embedment (wall constructed directly on the ground surface).
Features of fill material:
- same soil to be used in reinforced zone and retained earth (i.e., same soil in and behind the reinforced zone)
- soil is granular and free‐draining, with moist unit weight γ = 115 lb/ft3, c = 0, and ϕ = 37° at 95% of AASHTO T‐99 maximum density; placement density and moisture of the backfill in the reinforced zone are similar to those in retained earth
- surface drainage and subsurface drainage are to be properly provided.
Features of foundation soil:
- dense sandy gravel with a uniform blow count (N) of 45
- deep free water level.
Features of trial reinforcement type:
- polyester needled geotextile with ultimate strength, Tult = 2,520 lb/ft, determined by the wide cut strip tensile test (Method A, Step 6 of Section 5.4.1).
Features of loading:
- vertical surcharge is uniformly distributed over the crest, q = 200 lb/ft2
- 40‐kip live load on the crest due to a dual‐tandem‐axle truck whose wheel dimensions and positions with respect to the wall face are shown in Figure 5.21
- no concern for seismic loads.
Figure 5.21 Footprint of live loads on a wall crest due to a 40‐kip dual‐tandem‐axle truck (modified after Koerner, 2005)
Design Computations:
Step 1: Establish wall profile and check design assumptions
A typical cross‐section of the wall is shown in Figure 5.20. The design assumptions listed in Step 1 of Section 5.4.1 are verified, including granular backfill and a firm foundation.
Step 2: Determine backfill properties ϕ and γ
The backfill is granular, with moist unit weight γ = 115 lb/ft3, c' = 0 and ϕ' = 37° at 95% of AASHTO T‐99 maximum density.
Step 3: Develop a lateral earth pressure diagram due to soil self‐weight plus surcharge
The coefficient of earth pressure at‐rest, ![]()
The lateral earth pressure at depth z due to self‐weight and surcharge is:
This lateral earth pressure is tabulated under σh (o) in Table 5.4 and plotted in Figure 5.22.
Table 5.4 Calculations of required reinforcement length for the design example of the USFS design method
| Depth (ft) | σh(o) (psf) |
σh(l)* (psf) |
σh** (psf) |
sv (ft) |
Le (ft) |
Lf (ft) |
L*** (ft) |
Lo (ft) |
| 0 | 80 | 0 | 80 | 14.7 | 3.0 | 6.0 | 9.0 | 0.8 |
| 2 | 172 | 137 | 309 | 3.8 | 3.0 | 5.0 | 8.0 | 1.4 |
| 4 | 264 | 181 | 445 | 2.6 | 3.0 | 4.0 | 7.0 | 1.3 |
| 6 | 356 | 134 | 490 | 2.4 | 3.0 | 3.0 | 6.0 | 1.1 |
| 8 | 448 | 85 | 533 | 2.2 | 3.0 | 2.0 | 5.0 | 0.9 |
| 10 | 540 | 46 | 586 | 2.0 | 3.0 | 1.0 | 4.0 | 0.9 |
| 12 | 632 | 24 | 656 | 1.8 | 3.0 | 0 | 3.0 | 0.8 |
Note:
* Obtained from Table 5.5 (Section A in Figure 5.21).

Figure 5.22 Profiles of lateral earth pressures, design example of the USFS design method
Step 4: Develop a lateral earth pressure diagram due to live loads
The lateral earth pressure due to the eight‐wheel live load of 40 kips can be determined conservatively with the aid of the lateral earth pressure influence diagram shown in Figure 2.11. The earth pressure due to the live load in 2‐ft increments of the wall height is evaluated at two selected vertical sections: Sections A and B (see Figure 5.21; Table 5.5). The earth pressure is found to be larger in Section A than in Section B, thus the pressure at Section A is used in the design. The earth pressure due to the live load is tabulated under σh(l) in Table 5.4 and plotted in Figure 5.22.
Table 5.5 Lateral earth pressure due to live load for the design example of the USFS design method
| Depth (ft) | Wheel Number | σh(l) (psf) | |||||||
| 1 | 2 | 3 | 4 | 5 | 6 | 7 | 8 | ||
| 0 | 0 | 0 | 0 | 0 | 0 | 0 | 0 | 0 | 0 |
| 2 | 45.1 | 9.9 | 45.1 | 18.0 | 6.9 | 5.3 | 3.5 | 2.8 | 136.6 |
| 4 | 55.5 | 12.2 | 59.0 | 23.6 | 10.4 | 7.9 | 6.9 | 5.6 | 181.1 |
| 6 | 34.7 | 7.6 | 34.7 | 13.9 | 13.8 | 10.5 | 10.4 | 8.4 | 134.0 |
| 8 | 20.8 | 4.6 | 20.8 | 8.3 | 10.4 | 7.9 | 6.9 | 5.6 | 85.3 |
| 10 | 10.4 | 2.3 | 10.4 | 4.2 | 6.9 | 5.2 | 3.5 | 2.8 | 45.7 |
| 12 | 3.5 | 0.8 | 5.2 | 2.1 | 3.4 | 2.6 | 3.5 | 2.8 | 23.9 |
|
|||||||||
| Depth (ft) | Wheel Number | σh(l) (psf) | |||||||
| 1 & 2 | 3 & 4 | 5 & 6 | 7 & 8 | ||||||
| 0 | 0 | 0 | 0 | 0 | 0 | ||||
| 2 | 23.4 | 31.6 | 6.4 | 3.3 | 129.4 | ||||
| 4 | 28.9 | 41.3 | 9.7 | 6.4 | 172.6 | ||||
| 6 | 18.0 | 24.3 | 12.8 | 9.7 | 129.6 | ||||
| 8 | 10.8 | 14.6 | 9.7 | 6.4 | 83.0 | ||||
| 10 | 5.4 | 7.3 | 6.4 | 3.3 | 44.8 | ||||
| 12 | 1.8 | 3.6 | 3.2 | 3.3 | 23.8 | ||||
Step 5: Develop a combined lateral earth pressure diagram
A combined earth pressure diagram is obtained by superimposing the earth pressures obtained in Steps 3 and 4. The combined earth pressure along the wall height is tabulated under σh in Table 5.4 and plotted in Figure 5.22.
Step 6: Determine the vertical spacing of reinforcement layers
For the trial reinforcement (a polyester needled geotextile), the ultimate strength is reduced by a factor of 0.7, per Step 6 of Section 5.4.1, thus ![]() . Using a safety factor Fs of 1.5, the vertical spacing, sv , is:
. Using a safety factor Fs of 1.5, the vertical spacing, sv , is:
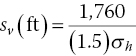
The required minimum vertical spacing along the wall height is tabulated in Table 5.4. A uniform vertical spacing of 1.5 ft (or 18 in.) is selected.
Step 7: Determine the length of reinforcement
With Fs = 1.5, the required anchored length behind the potential failure plane, Le , and the length within the potential failure wedge, Lf , are:
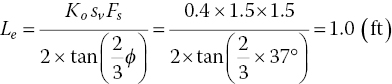
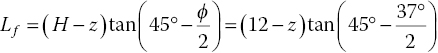
Note that the length Le must at least be 0.9 m (3 ft), thus ![]() is selected. The values of Le and Lf as well as the total reinforcement length L (
is selected. The values of Le and Lf as well as the total reinforcement length L (![]() ) along the wall height are listed in Table 5.4. A uniform length of 2.7 m (9 ft) is selected for all reinforcement layers.
) along the wall height are listed in Table 5.4. A uniform length of 2.7 m (9 ft) is selected for all reinforcement layers.
Step 8: Determine the wrapped length of reinforcement
The wrapped length, Lo, into the wall face is:
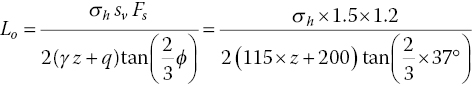
The values of Lo along the wall height are also listed in Table 5.4. All the Lo values are found to be less than the minimum required length of 0.9 m (3 ft), therefore Lo of 0.9 m (3 ft) is selected for all reinforcement layers.
Step 9: Check external stability
External stability against overturning failure, base sliding, bearing failure, and overall slope failure need to be checked before accepting the design.
5.5 The AASHTO Allowable Stress Design (ASD) Method
The Standard Specifications for Highway Bridges published by the American Association of State Highway and Transportation Officials (AASHTO) provides design guidelines for mechanically stabilized earth (MSE) walls (AASHTO 2002). Different assumptions of earth pressure distribution are made for extensible (polymeric) and inextensible (metallic) reinforcements. For walls with extensible reinforcements such as geosynthetics, the earth pressure distribution is assumed to follow the active Rankine theory. Other than the earth pressure distribution, the allowable stress design (ASD) approach in the AASHTO design guidelines is similar to the U.S. Forest Service method described in Section 5.4. Of note is that the AASHTO Standard Specifications give only general design guidelines, rather than clearly defined design procedure. The design procedure is to some extent subject to the user’s interpretation. The method presented in this section should be considered as a design method that is based on the AASHTO guidelines. The design method presented here is of the ASD approach.
5.5.1 Design Procedure: The AASHTO ASD Method
Step 1: Determine the friction angle (ϕ) and unit weight (γ) of the fill in and behind the reinforced zone
The friction angle (ϕ) should be estimated conservatively by an experienced soils engineer or determined by performing direct shear tests (AASHTO T236‐72) or triaxial tests (AASHTO T234‐74) on project‐specific fill materials. The soil strength should be evaluated at residual stress levels. In the absence of reliable project‐specific soil data, maximum friction angles of 30° and 34° should be used for external stability analysis and internal stability analysis, respectively.
Step 2: Determine the depth of embedment
Minimum embedment at the front face of the wall (measured from the adjoining finished ground surface to the bottom of footings) should be at least 2 ft (0.6 m), and greater than the maximum frost penetration depth at the wall site. In addition, the following requirements must be satisfied (H = wall height, measured from the bottom of the lowest block to the top of the fill behind the facing):
- For a horizontal ground surface in front of the wall: minimum embedment = H(ft)/20 (for walls) and H(ft)/10 (for abutments).
- For a sloping ground surface in front of the wall: minimum embedment = H(ft)/10 for a 3H:1V slope, H(ft)/7 for a 2H:1V slope, and H(ft)/5 for a 1.5H:1V slope, and there needs to be a minimum horizontal bench of 4 ft (1.2 m) in front of the wall.
For walls constructed along rivers and streams, the foundation depth must be at least 2 ft (0.6 m) below the potential scour depth.
Step 3: Select a tentative reinforcement length
A tentative reinforcement length of at least 0.7H (H = wall height measured from the bottom of the lowest block to the top of the fill behind the facing near the top of the wall) should be selected, and no less than 8 ft (2.4 m) for strip‐ or grid‐type reinforcement. Unless substantial evidence is presented to justify variation in reinforcement length, the length of reinforcement should be uniform throughout the entire wall.
Step 4: Determine the forces acting on the reinforced soil mass
The reinforced soil mass is treated as a rigid body for external stability computations. All forces acting on the reinforced soil mass, including body force due to self‐weight of the reinforced mass and forces acting on the reinforced soil mass, should be determined. The forces for walls with a level crest and an inclined crest are shown in Figures 5.23(a) and (b), respectively.
Figure 5.23 Forces acting on the reinforced soil mass for (a) a wall with a level crest and (b) a wall with an inclined crest (modified after AASHTO, 2002)
Step 5: Check stability against overturning
For walls with a level crest, the safety factor against overturning (about point O, Figure 5.23(a)) is calculated as:
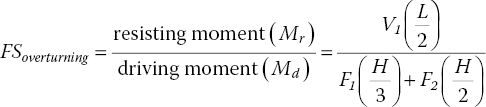
As shown in Figure 5.23(a), L is the length of the reinforced zone, H is the wall height, V1 is the body force (self‐weight) of the reinforced soil mass, F1 is lateral force due to the fill behind the reinforced mass, and F2 is lateral force due to a uniform traffic surcharge load, q, which is assumed to act only beyond the reinforced zone in computations involving resisting forces/moments for external stability check.
For walls with an inclined crest, the safety factor against overturning (about point O) can be calculated as:
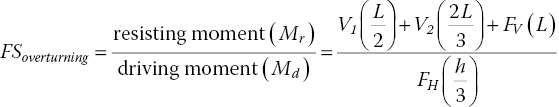
As shown in Figure 5.23(b), L is the length of the reinforced zone, H is the wall height, h is the height of the fill above the end of the reinforcement, V1 and V2 are body forces of the reinforced soil mass, and FH and FV are, respectively, the horizontal and vertical components of the lateral thrust F due to fill behind the reinforced mass.
The minimum value of FSoverturning should be at least 2.0 for all walls. If the safety margin is found insufficient, the safety factor may be increased by increasing the reinforcement length.
Step 6: Check stability against base sliding
For walls with a level crest, the safety factor against sliding is calculated as:
Note that the uniform traffic surcharge load, q, is assumed to act only beyond the reinforced zone in the computation of resistance to base sliding in the external stability check.
For walls with an inclined crest, the safety factor against sliding is calculated as:
where parameter δ is the friction angle between the backfill and foundation. The value of δ can be assumed to be the internal friction angle of the backfill or the foundation soil, whichever is smaller. The value of FSsliding must be at least 1.5. If the safety margin is found to be insufficient, the safety factor may be increased by increasing the roughness at the base of the wall (i.e., at the backfill–foundation contacting surface) or by increasing the reinforcement length.
Step 7: Check overall stability of slopes in the vicinity of the wall
Overall slope stability encompassing the entire wall and the stability of the inclined sloping crest (if present) should be checked by using the limiting equilibrium methods of analysis, such as the modified Bishop, simplified Janbu, or Spencer methods of analysis. The recommended minimum factors of safety are listed in Table 5.6. If the safety margin is found to be insufficient, the slope should be stabilized by an appropriate method (e.g., TRB, 1996).
Table 5.6 Minimum factors of safety for overall stability of slopes in the vicinity of the wall
| Determination of Soil and Rock Parameters and Ground Water Levels | Minimum Safety Factor | |
| Retaining Wall | Abutment Wall | |
| Determined based on In Situ and/or Laboratory Tests | 1.3 | 1.5 |
| Not Determined Based on In Situ and/or Laboratory Tests | 1.5 | 1.8 |
Step 8: Check bearing capacity of wall foundation
Bearing capacity of the wall foundation should be checked by considering the bottom of the reinforced soil mass as a rigid footing. The footing has a width of L, which is the length of the reinforcement at the foundation level, and is subjected to a concentrated eccentric load. The eccentricity, e, measured from the centerline of the reinforced soil mass (see Figure 5.23), can be calculated as:
where Mr and Md are, respectively, resisting moment and driving moment for overturning of the reinforced soil mass (as determined in Step 5), and RV is the resultant of vertical forces (![]() ; for walls with a level crest,
; for walls with a level crest, ![]() ). The eccentricity must stay within the middle third of the reinforced soil mass, i.e.,
). The eccentricity must stay within the middle third of the reinforced soil mass, i.e.,
The bearing pressure, ![]() , must have a safety factor of at least 2, i.e.,
, must have a safety factor of at least 2, i.e.,
If the safety margin is found to be insufficient, the safety factor may be increased by improving the foundation soil (using techniques such as compaction, staged construction, preloading, wick drain, grouting, etc.) or by increasing the reinforcement length.
Step 9: Select reinforcement and determine the limit state tensile load and serviceability tensile load
Upon selecting a particular reinforcement for the wall, a series of controlled laboratory creep tests will need to be conducted. The tests should be performed for a minimum duration of 10,000 hours for a range of load levels on samples of the selected reinforcement. The samples should be tested in the anticipated loading direction, in either a confined or an unconfined condition, and typically at an assumed in‐ground temperature of 70°F. The test results are to be extrapolated over the required design life using the procedures outlined in ASTM D2837.
From the laboratory creep tests, two tensile loads may be determined: limit state tensile load (Tlimit) and serviceability state tensile load (Tservice). The limit state tensile load is the highest load level at which the log time vs. creep‐strain rate relationship continues to decrease with time within the design life without inducing either brittle or ductile failure. The serviceability state tensile load, on the other hand, is the load level at which total strain will not exceed 5% within the design life. The design life is typically 75 years. Designated critical walls, however, may be designed for a 100‐year service life.
Step 10: Determine the allowable tensile load of reinforcement
The allowable tensile load in the reinforcement, Ta , is the lesser of two allowable tensile loads at limit state (Tal) and at serviceability state (Tas). The allowable limit state tensile load, Tal , is determined as:
where Tlimit is the limit state tensile load determined in Step 9; FD is a durability safety factor to account for such effects as aging, chemical degradation, biological degradation, temperature variations, environmental stress cracking, and plasticization; FC is a construction damage safety factor; and FS is an overall safety factor to account for uncertainties in structure geometry, fill properties, reinforcement manufacturing variations, and externally applied loads. The minimum value of FS is 1.5, whereas FD and FC should be determined by tests simulating the anticipated field conditions. If the facing of a wall is composed of dry stacked concrete blocks and facing connection strength is lower than Tal , the allowable tensile load at limit state (Tal) should be reduced further to account for possible connection failure.
On the other hand, the allowable serviceability state tensile load, Tas , is determined as:
where Tservice is determined in Step 9, FD is the durability safety factor, and FC is the construction damage safety factor.
Step 11: Develop a combined lateral earth pressure diagram due to overburden pressure, surcharge, and live loads
Similar to Step 5 of the U.S. Forest Service method (Section 5.4.1), the lateral earth pressure diagrams due to gravity, uniform normal surcharge, and live loads are superimposed to form a combined lateral earth pressure diagram.
Step 12: Determine vertical spacing of reinforcement layers
Vertical spacing between reinforcement layers, sv , is determined as:

where Ta is the allowable tensile load determined in Step 10 and σh is the lateral earth pressure at the mid‐depth of the reinforcement layer, obtained from the combined pressure diagram determined in Step 11.
For walls of low to medium height (say, 10–15 ft or 3.0–4.5 m), a uniform vertical spacing is generally selected for all reinforcement layers. In such a case, the value of sv only needs to be evaluated at the depth where σh is largest. If the value of sv turns out to be too small (say, less than the typical block height of 8 in. or 0.2 m), a different reinforcement with a larger allowable tensile load may be selected.
Step 13: Check stability against pullout failure
Similar to the USFS method shown in Figure 5.19, the anchored length behind the potential failure plane (Le) needed to prevent pullout failure from occurring is equal to the total reinforcement length (L) minus the length within the potential failure zone. For a reinforcement layer at depth z below the crest,
where H is wall height and z is the depth of the reinforcement layer being considered.
The safety factor against pullout failure for the reinforcement layer being considered is evaluated as:
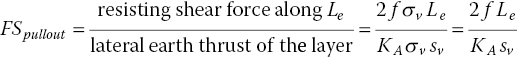
where σv is the vertical stress at the depth of the reinforcement and f is the friction coefficient between backfill and reinforcement; ![]() , in which δ = friction angle at the backfill–reinforcement interface. In the absence of reliable test data, δ can be taken as 2/3 of the internal friction angle of the backfill, ϕ. The safety factor against pullout for every reinforcement layer as determined from Eqn. (5‐35) must be at least 1.5, and the anchored length Le must be at least 3 ft. If the safety factor is less than 1.5, the reinforcement length may be increased.
, in which δ = friction angle at the backfill–reinforcement interface. In the absence of reliable test data, δ can be taken as 2/3 of the internal friction angle of the backfill, ϕ. The safety factor against pullout for every reinforcement layer as determined from Eqn. (5‐35) must be at least 1.5, and the anchored length Le must be at least 3 ft. If the safety factor is less than 1.5, the reinforcement length may be increased.
5.5.2 Design Example: The AASHTO ASD Method
Given Conditions:
A geotextile reinforced soil wall is situated near Chicago, Illinois. The cross‐section of the wall is shown in Figure 5.24.
Figure 5.24 Cross‐section of a reinforced soil wall, design example of the AASHTO ASD method, for calculations of resisting forces/moments
Features of wall:
- uniform wall height of 12 ft above finished ground surface
- vertical wall
- all geosynthetic reinforcement layers are to have the same length
- ground surface is horizontal in front of the wall.
Features of backfill and retained earth:
- same soil to be used for the reinforced zone and the retained earth (the soil behind reinforced zone)
- soil is granular, with moist unit weight γ = 115 lb/ft3, c' = 0, and ϕ' = 37° at 95% of AASHTO T‐99 maximum density; placement density and moisture of the backfill in the reinforced zone are similar to those in the retained earth
- surface drainage on top of the wall and subsurface drainage behind and beneath fill material will be properly provided during construction and during service life.
Features of foundation soil:
- dense sandy gravel with a uniform blow count (N) of 30
- deep free water level
- maximum frost penetration depth = 4 ft.
Features of a trial reinforcement:
- polypropylene woven geotextile
- for a design life of 75 years, the geotextile reinforcement has a limit state tensile load of 2,500 lb/ft and a serviceability state tensile load of 1,500 lb/ft, as determined from a series of laboratory creep tests.
Features of loading:
- surcharge load (including traffic load), q = 250 lb/ft2
- no concern for seismic loads.
Design Computations
Step 1: Determine friction angle, ϕ′, and unit weight, γ, for the fill in and behind the reinforced zone
The fill has a moist unit weight γ = 115 lb/ft3 and c' = 0, ϕ' = 37°.
Step 2: Determine depth of embedment
Consider the following three conditions: (i) minimum embedment depth, measured from the finished ground surface to the bottom of the wall footings, should be at least 2 ft; (ii) minimum embedment for horizontal ground surface in front of the wall = H/20, i.e., 0.6 ft; and (iii) the embedment depth of the wall, measured from the finished ground surface to the bottom of the wall footings, should not be less than the maximum frost penetration depth at the wall site (4 ft). For 1‐ft thick footings, the wall height (H), measured from the leveling pad of the footings, will be 12 + 4 – 1 = 15 (ft).
Step 3: Select a tentative reinforcement length
A tentative length of 0.7H, or 10.5 ft, is selected for the entire wall.
Step 4: Determine the forces acting on the reinforced soil mass
As depicted in Figure 5.25, the reinforced soil mass is subjected to three resultant forces: (i) weight of the reinforced soil mass, V1 = 18,100 lb/ft, (ii) lateral earth thrust due to retained earth, F1 = 3,234 lb/ft, and (iii) lateral force due to traffic surcharge, F2 = 938 lb/ft.
Figure 5.25 Forces acting on the reinforced soil mass, design example of the AASHTO ASD method
Step 5: Check stability against overturning
The factor of safety against overturning is calculated as:

The safety factor is greater than the minimum required value of 2.0 (OK).
Step 6: Check stability against base sliding
The safety factor is greater than the minimum required value of 1.5 (OK).
Step 7: Check overall stability of slopes in the vicinity of the wall
Using the simplified Bishop method for stability analysis of slopes encompassing the entire wall, the minimum safety factor against overall slope failure can be determined. The safety factor needs to be at least 1.5.
Step 8: Check the bearing capacity of wall foundation
The eccentricity measured from the centerline of the reinforced soil mass is:
Alternatively,
The value e is less than L/6 = 1.75 ft (OK).
The applied bearing pressure σv = 18,100/[10.5/2 – 2(1.60)] = 2,480 (lb/ft2). For blow count (N) = 30, ϕ = 36°, hence Nγ = 50 and Nq = 32. Therefore, the ultimate bearing capacity is:

Thus,
The bearing capacity safety factor is greater than the minimum required value of 2.0 (OK).
Step 9: Select reinforcement and determine the limit state tensile load and serviceability tensile load
A polypropylene woven geotextile is selected as the reinforcement. For a design life of 75 years, the geotextile reinforcement has a limit state tensile load Tlimit = 2,500 lb/ft and a serviceability state tensile load Tservice = 1,500 lb/ft, as determined from a series of controlled laboratory creep tests.
Step 10: Determine the allowable tensile load of reinforcement
The allowable limit state tensile load, Tal , is determined as:
The allowable serviceability state tensile load, Tas, is determined as:
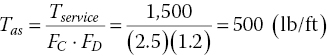
Thus, the allowable tensile load, Ta = 500 lb/ft.
Step 11: Develop a combined lateral earth pressure diagram due to overburden pressure, surcharge, and live loads
The lateral earth pressure at depth z is:
where the coefficient of active earth pressure, 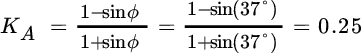 .
.
In the absence of live loads, the maximum lateral earth pressure will occur at the base of the wall (i.e., at z = 15 ft), which is equal to 494 lb/ft2.
Step 12: Determine the vertical spacing of reinforcement layers
Select uniform spacing for all reinforcement layers,
Step 13: Check stability against pullout failure
The smallest anchored length behind the potential failure surface is at the uppermost reinforcement layer, for which ![]() . This Le value is greater than the minimum required value of 3.0 ft (OK).
. This Le value is greater than the minimum required value of 3.0 ft (OK).
The minimum safety factor against pullout failure is:
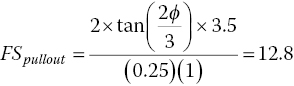
The safety factor is greater than the minimum required value of 1.5 (OK).
Design Summary:
Reinforcement: a polypropylene woven geotextile with Tlimit = 2,500 lb/ft and Tservice = 1,500 lb/ft
Reinforcement length (at all depths) = 10.5 ft
Reinforcement vertical spacing = 1.0 ft
Total height of wall measured from leveling pad (from the top of footing) = 15 ft
Embedment depth (to the bottom of footing) = 4 ft
5.6 The NCHRP Design Method for GRS Bridge Abutments
The NCHRP design method is specifically for design of GRS bridge abutments with flexible facing (Wu et al., 2006). It was developed by using the FHWA NHI reference manual (Elias et al., 2001) as the basic framework, and modified for GRS abutments. The modifications were based on the results of finite element analysis as well as experience gained from actual construction of GRS abutments. The finite element model used in the study was calibrated and validated by measured results of two full‐scale experiments conducted for the study. Measured results of a number of other full‐scale loading experiments of GRS structures were also used for validation of the analytical model.
The allowable load‐carrying pressure of GRS bridge sills in the NCHRP design method (Design Procedure Step 4, Section 5.6.1) were developed based on results of finite element analyses with two performance criteria. One criterion involves a limiting sill settlement, where the allowable bearing pressure is corresponding to a sill settlement of 1.0% of the load‐carrying wall height (i.e., 1.0% × H). The other criterion involves distribution of critical shear strain in the reinforced soil mass, where the allowable bearing pressure is corresponding to a limiting condition in which a triangular critical shear strain distribution reaches the heel of the sill. The allowable load‐carrying pressures were also validated by full‐scale experiments.
The NCHRP design method is applicable only to GRS abutments that satisfy the following conditions:
- Total abutment wall height is not greater than 10 m.
- Facing may comprise dry‐stacked concrete blocks, timber, natural rocks, wrapped geosynthetic sheets, or gabions—with or without facing connection enhancement elements (pins, lips, or keys) between vertically adjacent facing units.
- No prop or any temporary bracing is used during construction of the abutment wall.
- The backfill meets the following criteria: 100% passing 10 cm (4 in.) sieve, 0–60% passing 0.425 mm (No. 40) sieve, and 0–15% passing 0.075 mm (No. 200) sieve, free from organic material, plasticity index (PI) not greater than 6.
- The backfill has an internal friction angle of at least 34°, as determined by the standard direct shear test on the portion finer than 2 mm (No. 10) sieve, using soil samples compacted to 95% of AASHTO T‐99, Method C or D, with oversize correction, at the optimum moisture content.
- The backfill in construction is compacted to at least 100% of AASHTO T‐99 (i.e., 100% of standard Proctor maximum dry density) or 95% of AASHTO T‐180 (i.e., 95% of modified Proctor maximum dry density), and the placement moisture is within ±2% of the optimum.
- The foundation soil is competent. The term competent is relative to the abutment height and loads on the sill. For a medium height GRS abutment (say, with a total height of 5–8 m) under a maximum allowable sill pressure defined in Step 4 of the design procedure (Section 5.6.1), the foundation is considered competent if the in situ undrained shear strength is at least 140 kPa (3,000 lb/ft2) for a clayey foundation, or the standard penetration blow count is 25 or greater for a non‐prestressed granular foundation. A specific check of foundation bearing pressure for a given bridge abutment is performed in Step 7 of the design procedure in Section 5.6.1.
5.6.1 Design Procedure: The NCHRP Method for GRS Abutments
Before using the design method, the conditions described above (immediately before this section) should be checked.
Step 1: Establish design parameters
- Establish abutment geometry and loads (ref. Figure 5.26):
- the wall is composed of a lower wall (load‐bearing wall) and an upper wall (back wall), with concrete block facing
- total abutment height, H', is the sum of lower wall height and upper wall height
- load‐bearing wall (lower wall) height, H1, is measured from the base of the embedment to the top of the load‐bearing wall
- back wall (upper wall) height, H2
- equivalent traffic surcharge, q
- bridge vertical dead load, DL
- bridge vertical live load, LL
- bridge horizontal load
- bridge span and type (simple or continuous span)
- length of approach slab
- If there is a strong likelihood that erosion or other untoward events at the wall base will not be an issue throughout the design life, embedment of a GRS abutment wall needs only be a nominal depth (say, one block height, typically 8 in.). If the foundation contains frost susceptible soils (i.e., silts, silty tills, etc.), they should be excavated to at least the maximum frost penetration line and replaced with a non‐frost susceptible soil. If the GRS abutment is situated in a stream environment, scour/abrasion/channel protection measures should be undertaken.
- Establish trial design parameters:
- sill width, B (a minimum sill width of 0.6 m (12 in.) is recommended)
- clear distance between the backface of facing and the front edge of sill, d (a clear distance d = 0.3 m (6 in.) is recommended; the fill compaction within the clear distance is generally less than the rest of the fill)
- sill type (isolated sill or integrated sill, the former refers to a sill that is a separate unit from the upper wall of the abutment, whereas the latter refers to a sill that is integrated with the upper wall as a combined unit)
- facing type (dry‐stacked concrete blocks, timber, natural rocks, wrapped geosynthetics, or gabions) and facing block size (for concrete block facing)
- vertical facing is recommended, although batter of facing with a minimum front batter of 1/35 to 1/40 is commonly used (if a batter is employed, a typical minimum setback of 5–6 mm between successive courses of facing blocks is common for block height of 200 mm (or 8 in.))
- reinforcement spacing (the default value of reinforcement spacing is 0.2 m (8 in.). For wrapped‐faced geotextile walls, temporary walls or walls where facing may be added subsequently, a reinforcement spacing of 0.15 m (6 in.) is recommended. Reinforcement spacing greater than 0.4 m (16 in.) is not recommended under any circumstances).
Figure 5.26 Abutment geometry and notations, the NCHRP design method for GRS bridge abutments
Step 2: Determine geotechnical engineering properties
- Check to ensure that the selected fill satisfies the following criteria: 100% passing 100 mm (4 in.) sieve, 0–60% passing No. 40 (0.425 mm) sieve, and 0–15% passing No. 200 (0.075 mm) sieve; and plasticity index (PI) ≤ 6.
- Determine reinforced fill parameters, including:
- moist unit weight of the reinforced fill
- the design friction angle of the reinforced fill, ϕdesign, should be taken as one (1) degree lower than the friction angle obtained from direct shear tests,
 , where ϕtest is determined by a single set of the standard direct shear tests performed on the portion passing 2 mm (No. 10) sieve, with the specimen compacted to 95% of AASHTO T‐99, Methods C or D, at the optimum moisture content. If multiple sets of direct shear tests are performed, the smallest friction angle could be used in design. For instance, if two sets of tests are performed; one showing a friction angle of 35° and the other 37°, the design friction angle will be 35°. On the other hand, if a single set of tests shows that a soil has a friction angle of 35°, then the design friction angle will be taken as 34°.
- Determine retained earth parameters:
- friction angle of the retained earth
- moist unit weight of the retained earth
- coefficient of active earth pressure of the retained earth.
- Determine foundation soil parameters:
- friction angle of the foundation soil
- moist unit weight of the foundation soil
- allowable bearing pressure of the foundation soil, qaf .
- Determine allowable bearing pressure of the reinforced fill:
The allowable bearing pressure of the reinforced fill, qallow, can be determined by a 3‐step procedure as follows:
- Use Table 5.7 to determine the allowable bearing pressure for an abutment in the following conditions: (i) the sill is an integrated sill, (ii) sill width = 1.5 m, (iii) a sufficiently strong reinforcement is employed (with minimum required values of stiffness and strength to be determined in Step 9, below), and (iv) the abutment is constructed over a competent foundation (satisfying the bearing pressure requirement in Step 7, below).
- Select a sill width for the abutment and use Figure 5.27 to determine a sill width correction factor for the selected sill width. Calculate a corrected allowable bearing pressure, which is equal to the allowable pressure determined in Step 1 above, and multiply by the correction factor. A minimum sill width of 0.6 m is recommended.
- If an isolated sill is used, a reduction factor of 0.75 should be applied to the corrected allowable bearing pressure in Step 2, above. No correction is needed for an integrated sill.
Table 5.7 Recommended allowable bearing pressures of a GRS abutment with an integrated sill of sill width = 1.5 m on a competent foundation (Wu et al., 2006)
| Design Friction Angle of Fill Material*,** | |||||||
| ϕ = 34° | ϕ = 35° | ϕ = 36° | ϕ = 37° | ϕ = 38° | ϕ = 39° | ϕ = 40° | |
| Reinforcement Spacing = 0.2 m (8 in.) | 180 kPa (26 psi) |
190 kPa (27.5 psi) |
200 kPa (29 psi) |
220 kPa (32 psi) |
235 kPa (34 psi) |
255 kPa (37 psi) |
280 kPa (40.5 psi) |
| Reinforcement Spacing = 0.4 m (16 in.) | 125 kPa (18 psi) |
140 kPa (20 psi) |
155 kPa (22.5 psi) |
175 kPa (25 psi) |
195 kPa (28 psi) |
215 kPa (31 psi) |
240 kPa (34.5 psi) |
* The internal friction angle should be determined by the standard direct shear test on the portion finer than 2 mm (No. 10) sieve, using specimens compacted to 95% of AASHTO T‐99, Methods C or D, at optimum moisture content.
** If multiple sets of direct shear tests are performed, the lowest friction angle judged as reasonable should be used as the design friction angle. If a single set of shear tests is performed, the design friction angle will be 1° lower than the value obtained from the tests.
Figure 5.27 Relationship between sill width and correction factor, the NCHRP design method for GRS bridge abutments (Wu et al., 2006)
The 3‐step procedure for determination of allowable bearing pressure is illustrated in Example 1 and Example 2 below. Note that the allowable bearing pressure determined by the procedure described above is applicable only to GRS abutments founded on a competent foundation and with a sufficiently strong reinforcement.
Step 3: Establish design requirements
- Establish external stability design requirements:
- factor of safety against reinforced fill base sliding ≥ 1.5
- eccentricity ≤ L/6 (L = length of reinforcement at base of reinforced zone)
- average sill pressure ≤ allowable bearing pressure of the reinforced fill, qallow
- average contact pressure at the foundation level ≤ allowable bearing pressure of the foundation soil, qaf
- Establish internal stability design requirements:
- factor of safety against reinforcement pullout, FSpullout, of every reinforcement layer should be no less than 1.5
- connection strength is not a design concern if (i) the reinforcement spacing is kept no greater than 0.2 m, (ii) the fill is compacted to the specified value (see Section 6.2.3), and (iii) the average applied pressure on the sill does not exceed the recommended allowable pressure determined in Step 2 above
- for reinforcement spacing of 0.4 m, facing connection failure should be checked to ensure facing stability (see Section 5.3.5); moreover, for walls with light‐weight concrete block facing, the contact surfaces of the top 2 to 3 courses of the facing block should be bonded together by pouring concrete mix through the course or using adhesives to improve facing stability (see Section 6.2.4 and Figure 6.1)
- studies have suggested that concrete reinforced soil walls will be much stronger if the facing blocks are interconnected through the hollow cells (by use of rebar and cement) after all facing units are in place.
Step 4: Choose facing type and reinforcement spacing
Facing type, including wrapped geotextile facing, dry‐stacked concrete block facing, timber facing, natural rock facing and gabion facing, may be selected. Reinforcement spacing between 0.15 m (6 in.) and 0.4 m (16 in.) can be selected. However, smaller reinforcement spacing is highly recommended. For concrete block facing, reinforcement spacing should be a multiple of a single block height.
Step 5: Determine a trial reinforcement length
- A trial reinforcement length, L, can be taken as 0.7 × total abutment wall height (
 , see Figure 5.26).
 - The reinforcement length may be truncated in the bottom portion of the wall (see Section 5.3.6) provided that the foundation is competent (as defined earlier in this section). The recommended configuration for the truncated base is: reinforcement length = 0.35H' (H' = total abutment height) at the foundation level and increases upward at about a 45° angle.
- The allowable bearing pressure of the sill (reinforced fill), as determined in Step 2, should be reduced by 10% for a wall with a truncated base.
- When reinforcement is truncated in the bottom portion, the external stability of the wall (i.e., sliding failure, overall slope failure, eccentricity failure, and foundation bearing failure) in Steps 6 and 7 must be thoroughly examined.
Step 6: Size abutment footing/sill
- Establish a trial sill configuration (e.g., establish the value of B, d, H2 , t, b, fw and fh, Figure 5.28).
- Determine the forces acting on the sill (e.g., see Figure 5.28) and calculate the factor of safety against sliding, FSsliding , which needs to be ≥ 1.5.
- Check the sill eccentricity requirement: The load eccentricity at the base of the sill, e', needs to be ≤ B/6 (B = width of sill).
- Check the allowable bearing pressure of the reinforced fill; the applied contact pressure on the base of the sill (reinforced fill) should be ≤ qallow , as determined in Step 2.
Figure 5.28 Geometry and forces of a bridge sill, the NCHRP design method for GRS bridge abutments
Step 7: Check external stability of reinforced fill (for the trial reinforcement length selected in Step 5)
- Determine the forces needed for evaluating the external stability of the abutment, e.g., V4 , V5 , Vq , F3 , F4 (see Figure 5.29) and l1, the influence depth due to the horizontal forces in the upper wall (see Figure 5.30).
- Calculate the factor of safety against sliding of the reinforced zone, FSsliding , which needs to be ≥ 1.5.
- Check the eccentricity requirement for the reinforced volume, e, which needs to be ≤ L/6 (L = length of reinforcement).
- Check the allowable bearing pressure of the foundation soil:
- Determine the influence length D1 at the foundation level (
 , see Figure 5.30) and compare it to the effective reinforcement length,
  .
. - Determine the contact pressure on the foundation level, pcontact , calculated by dividing the total vertical load in the reinforced volume by D1 or L', whichever is smaller.
- The contact pressure pcontact needs to be ≤ qaf .
- Determine the influence length D1 at the foundation level (
Figure 5.29 Forces involved in the evaluation of the external stability of a GRS abutment, the NCHRP design method for GRS bridge abutments
Figure 5.30 Assumed distribution of vertical stress from sill load and definitions of influence depth l1 and influence length D1 , the NCHRP design method for GRS bridge abutments
If the bearing pressure of the foundation soil supporting the bridge abutment is only marginally acceptable or slightly unacceptable, a reinforced soil foundation (RSF) may be employed to increase the bearing capacity and reduce potential settlement. A typical RSF is formed by excavating a pit at the planned location of bridge abutment and backfilled with compacted road base material that is reinforced by the same reinforcement for the reinforced abutment wall on 0.3 m vertical spacing. The pit should typically be 0.5L deep (L = reinforcement length), and at least cover the footprint of the reinforced fill, and should extend no less than 0.25L in front of the wall face. A generic design protocol for RSF has recently been proposed by Wu (2018).
Step 8: Determine internal stability at each reinforcement level
The internal stability is evaluated by computing the factor of safety against the reinforcement pullout failure at each reinforcement level. Rupture failure is addressed later in Step 9. The factor of safety against pullout failure, FSpullout , at a given reinforcement level is equal to pullout resistance at the reinforcement level divided by Tmax, which is the reinforcement tensile thrust at the reinforcement level where the pullout safety factor is being evaluated.
The value of Tmax can be calculated as the product of the average Rankine active lateral earth pressure of the reinforcement level and reinforcement vertical spacing. The pullout resistance, on the other hand, derives from the frictional resistance at the soil–reinforcement interface along the portion of reinforcement beyond the potential failure plane. The potential failure plane is taken as the active Rankine failure plane with a uniform vertical surcharge. FSpullout at all reinforcement levels need to be ≥ 1.5.
Step 9: Determine the required minimum reinforcement stiffness and strength
A required minimum ultimate tensile stiffness and a required minimum tensile strength are needed for specifying the geosynthetic reinforcement to be used in the design of a GRS abutment to ensure sufficient tensile resistance at the service load and a sufficient safety margin against rupture failure.
The tensile stiffness is defined as the tensile resistance at a working strain, namely, the secant modulus of reinforcement at a selected strain under in‐service condition. It is recommended that a tensile strain of 1.0% be taken as the working strain for GRS abutment walls. The required minimum reinforcement stiffness in the direction perpendicular to abutment wall face, ![]() , is determined as:
, is determined as:
where σh(max) is the largest lateral stress in the reinforced fill and sv is the vertical reinforcement spacing. For non‐uniform reinforcement spacing, sv = (½ distance to reinforcement layer above) + (½ distance to reinforcement layer below).
The required minimum value of the ultimate reinforcement strength in the direction perpendicular to abutment wall face, Tult , is determined by imposing a combined safety factor on ![]() , i.e.,
, i.e.,
The combined safety factor Fs is used to (i) ensure satisfactory long‐term performance, (ii) ensure sufficient ductility of the abutment, and (iii) account for various uncertainties. Recommended values for the combined safety factor are: Fs = 5.5 for reinforcement spacing ≤ 0.2 m and Fs = 3.5 for reinforcement spacing of 0.4 m (Note: Fs is smaller for sv = 0.4 m than for sv ≤ 0.2 m because the influence of spacing is compensated for in Eqn. (5‐36)). These combined safety factors are applicable only to the condition where the backfill material and placement conditions satisfy those given in Section 6.2.3.
Step 10: Design the back/upper wall
If the back wall (upper wall) of a bridge abutment is to be a reinforced soil wall, it should be designed in a manner similar to the load‐bearing wall (lower wall). In most cases, the same fill, same reinforcement, and same fill placement conditions as those of the load‐bearing wall should be employed in the back wall, although the default reinforcement spacing in the approach fill may be increased somewhat, say from 0.2 m to 0.3 m. The length of all the layers of reinforcement should be extended approximately 1.5 m beyond the end of the approach slab to produce a smoother subsidence profile over the design life of the abutment and help eliminate potential bridge bumps. If there is serious space constraint, it is recommended that at least the top two to three layers of reinforcement should undertake this measure.
Step 11: Check angular distortion between abutments or piers
Angular distortion between any two bridge supporting structures (abutments or piers) should be checked to ensure ride quality and structural integrity. Angular distortion = (difference in total settlements between bridge supporting structures)/(span between the bridge supporting structures). The angular distortion should be limited to 0.005 (or 1:200) for simple span structures, and 0.004 (or 1:250) for continuous span structures.
The total settlement of a bridge supporting structure is the sum of foundation settlement (i.e., settlement occurs beneath the abutment) and settlement within the bridge supporting structure. Foundation settlement due to the self‐weight of a GRS abutment/pier and subjected to bridge loads can be estimated by conventional settlement computation methods in soils engineering textbooks or reports (e.g., Terzaghi et al., 1996; Perloff, 1975; Poulos, 2000). Settlement of bridge supporting structures, under the recommended allowable bearing pressure determined in Step 2 (above), can be conservatively estimated as 1.5% of H1 (H1 = height of the load‐bearing wall).
In situations where the heights of two load‐bearing walls at the two ends of a bridge are significantly different, preloading or prestressing the load‐bearing walls may be an effective measure to alleviate problems associated with differential settlement. The level of preloading/prestressing and probable reduction in differential settlement due to preloading of a reinforced soil mass can be evaluated by a procedure proposed by Ketchart and Wu (2001, 2002).
If differential settlement is due to differences in foundation settlement, a number of remedial measures (e.g., vibroflotation for granular deposits, wick drain with surcharge for cohesive deposits) for reducing foundation settlement can be employed to mitigate the problem.
5.6.2 Design Example: The NCHRP Method for GRS Abutments
Given Conditions:
A design example is given here to illustrate how to carry out design computations for the NCHRP design method. A spreadsheet‐based software named BAWFF (bridge abutments with flexible facing) has been prepared to help with design of bridge abutments by the NCHRP method.
Design Computations:
Step 1: Establish design parameters
Wall heights and external loads (ref. Figure 5.31):
|
9.7 m |
|
7.5 m |
|
2.2 m |
|
9.4 kN/m2 |
|
45 kN/m |
|
50 kN/m |
|
2.25 kN/m |
|
4.25 m |
Figure 5.31 Configuration of abutment and forces involved in the evaluation of external stability, design example of the NCHRP design method for GRS bridge abutments
Trial design parameters (ref. Figure 5.31):
|
1.5 m |
|
0.3 m |
|
integrated sill |
|
dry‐stacked concrete blocks |
|
200 mm × 200 mm × 400 mm |
|
1/35 (6 mm setback for each block) |
Note: Since a batter of 1/35 corresponds to an angle of 1.6°, which is far less than 10°, the abutment wall can be designed as a vertical wall and the coefficient of earth pressure is to follow the Rankine active earth pressure theory for walls with a vertical backface.
Step 2: Determine geotechnical engineering properties
Reinforced fill:
- The selected fill satisfies the following criteria: 100% passing 100 mm (4 in.) sieve, 0–60% passing No. 40 (0.42 mm) sieve, and 0–15% passing No. 200 (0.074mm) sieve; PI ≤ 6, and maximum soil particle size = 20 mm (3/4 in.).
- The friction angle of the fill is 35°, as determined by one set of standard direct shear test on the portion finer than 2 mm (No. 10) sieve, using a specimen compacted to 95% of AASHTO T‐99, Methods C or D, at optimum moisture content.

Note: The design friction angle is taken as one degree lower than ϕtest, i.e.,
 (see Design Procedure Step 2, Section 5.6.1).
Determine allowable bearing pressure of the reinforced fill, qallow, for following conditions:
- Reinforcement spacing = 0.2 m (uniform reinforcement length with no truncation)
- Integrated sill, sill width = 1.5 m
- From Table 5.7, for ϕ = 34° and reinforcement spacing = 0.2 m, allowable bearing pressure is 180 kPa.
- From Figure 5.27, correction factor for sill width of 1.5 m is 1.0, thus corrected allowable bearing pressure
 .
. - No reduction for an integrated sill, thus
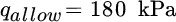
Retained earth:
Foundation soil:
Step 3: Establish design requirements
External stability design requirements:
- Design life = 75 years
- Factor of safety against sliding, FSsliding ≥ 1.5
- Eccentricity ≤ L/6
- Sill pressure ≤ allowable bearing pressure of the reinforced fill, qallow = 180 kPa
- Average contact pressure at the foundation level ≤ allowable bearing pressure of the foundation soil, qa = 300 kPa
Internal stability design requirements:
- Factor of safety against pullout, FSpullout ≥ 1.5
- Facing connection strength is OK with reinforcement spacing = 0.2 m (see Step 3, Section 5.6.1)
Step 4: Choose facing type and reinforcement spacing
- Concrete blocks, 200 mm (depth) × 200 mm (height) × 400 (width)
- Reinforcement spacing in the load‐bearing wall (the lower wall) = 0.2 m
Step 5: Determine a trial reinforcement length
Trial reinforcement length = 0.7 × total abutment height
Step 6: Size abutment footing/sill
Preliminary sill configuration and forces acting on the sill are shown in Figure 5.32. The dimensions of the sill are:
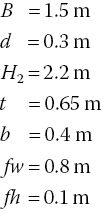
With the unit weight of concrete, ![]() , the forces acting on the sill are determined as:
, the forces acting on the sill are determined as:
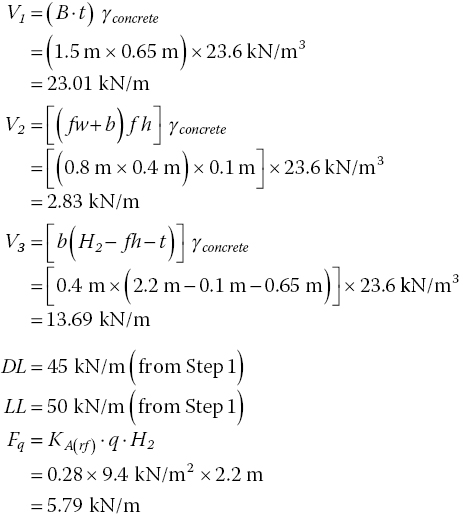

Check factor of safety against sliding:
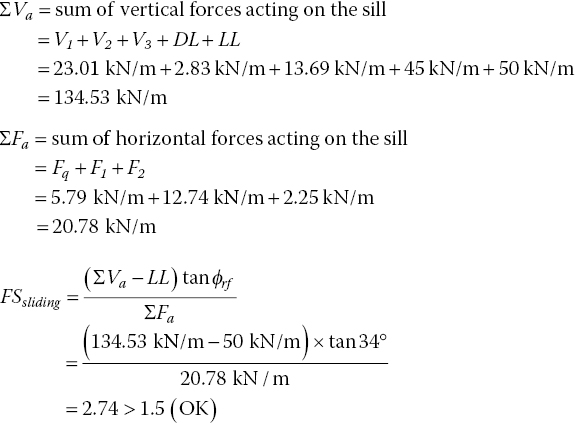
Figure 5.32 Configuration of a bridge sill and loads on a bridge sill, design example of the NCHRP design method for GRS abutments
Check eccentricity requirement:
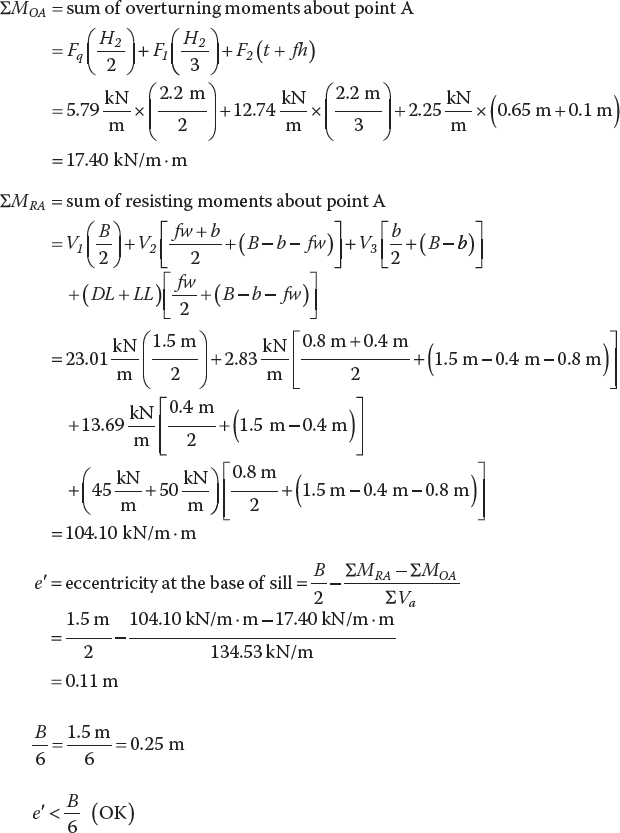
Check allowable bearing pressure of the reinforced fill:
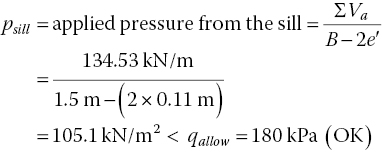
Step 7: Check external stability of reinforced fill (for the trial reinforcement length selected in Step 5)
The forces involved in evaluation of external stability of the abutment are shown in Figure 5.31. These forces are calculated as follows.

l1 is the influence depth due to the horizontal forces in the back wall (see Figure 5.33, cf. Figure 5.30):
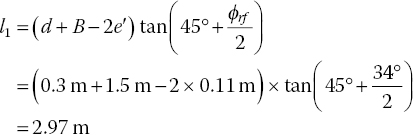
Check the factor of safety against sliding for the reinforced volume:

Check the eccentricity requirement for the reinforced volume:
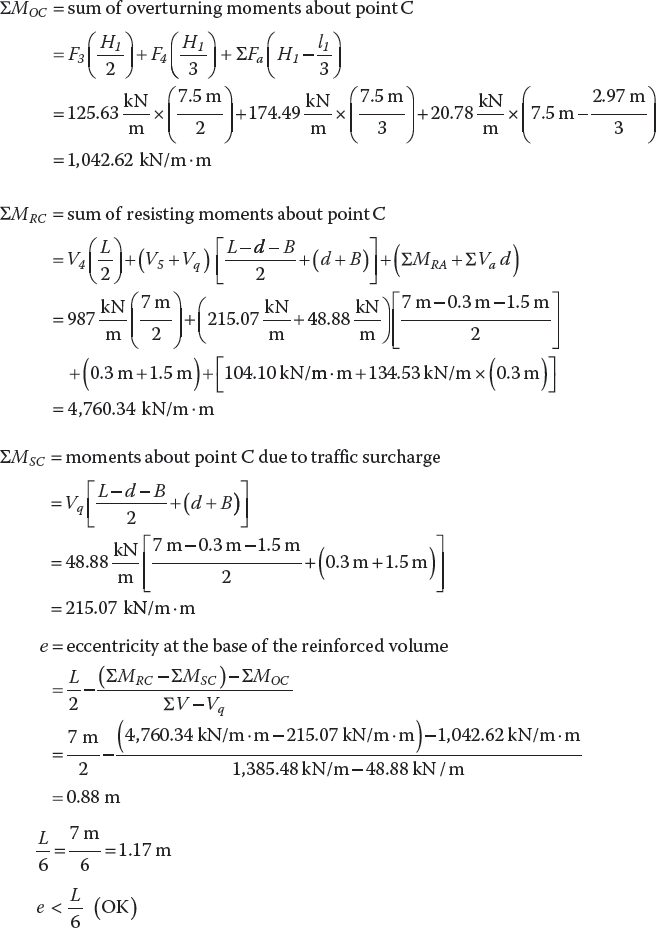
Check the allowable bearing pressure of the foundation soil:
Figure 5.33 Parameters involved in evaluating the internal stability of an abutment, design example of the NCHRP design method for GRS abutments
Calculate the effective length D1 at the foundation level and compare with the effective reinforcement length, L'.
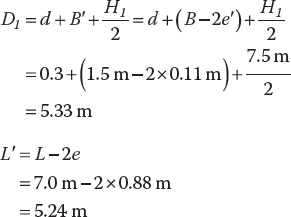
As D1 at the foundation level is greater than L' ![]() , the contact pressure on the foundation level, pcontact , is calculated as follows.
, the contact pressure on the foundation level, pcontact , is calculated as follows.
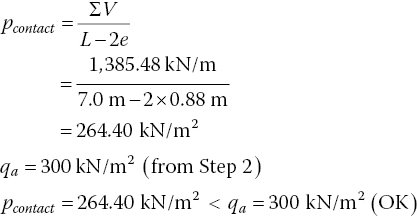
Step 8: Determine internal stability at each reinforcement level
With geosynthetic reinforcement, the coefficient of lateral earth pressure is constant for the entire wall height. The internal stability is evaluated by checking stability against reinforcement pullout failure (Note: rupture failure is to be addressed later in Step 9).
Check reinforcement pullout failure:
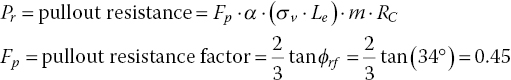
- α is a scale effect correction factor, ranging from 0.6 to 1.0 for geosynthetic reinforcement; for geotextile, α is defaulted to 0.6.
- σv ∙ Le is the normal force at the soil–reinforcement interface at depth z (excluding traffic surcharge).
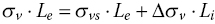
- Le = length of reinforcement in the resistant zone behind the failure surface at depth z =

- La = length of reinforcement in the active zone at depth z =

- Li = length of reinforcement within the influence area inside the resistant zone; this length can be measured directly from the design drawing
- m = reinforcement effective unit perimeter; m = 2 for strips, grids, and sheets
- Rc = coverage ratio; Rc = 1.0 for 100% coverage of reinforcement
- σh = horizontal pressure at depth z =

- σvs = vertical soil pressure at depth z =
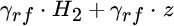
- Δσv = distributed vertical pressure from sill = ΣVa/D
- D = effective width of applied load at depth z
- For z ≤ z2 ,
- Δσh = supplement horizontal pressure at depth z
- For z ≤ l1,
- For z > l1,

- For z ≤ l1,
- Tmax = maximum tensile force in the reinforcement at depth z =

- sv = vertical reinforcement spacing
- FSpullout = factor of safety against reinforcement pullout
- FSpullout =

Let depth z be the depth measured from the top of the load‐bearing wall. We will use reinforcement layer no. 25 at z = 2.5 m (see Figure 5.33) as an example for determination of FSpullout.
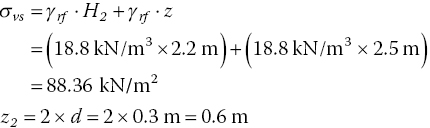
Since ![]() , therefore
, therefore ![]()

Since ![]() , therefore
, therefore 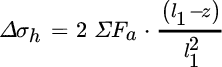
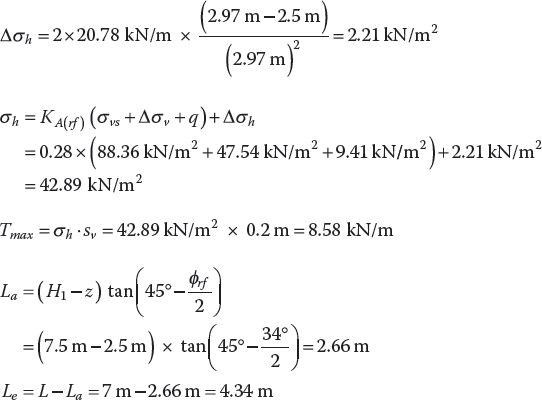
Calculate the normal force at z = 2.5 m:
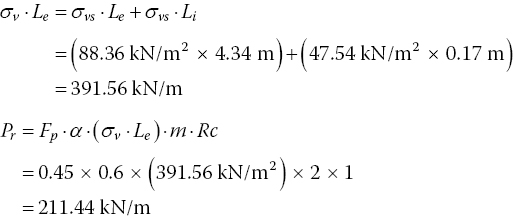
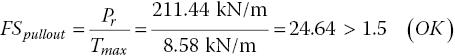
The values of FSpullout for all reinforcement layers in the load‐bearing wall are summarized in Table 5.8.
Table 5.8 Design example for the NCHRP design method: FSpullout at each reinforcement level
| No. | Depth z (m) | sv (m) | σvs (kN/m2) | D (m) | Δσv (kN/m2) | Δσh (kN/m2) | σh (kN/m2) | Tmax (kN/m) | La (m) | Le (m) | Li (m) | (σv • Le) (kN/m) | Pr (kN/m) | fspullout |
| 1 | 7.3 | 0.2 | 178.6 | 5.2 | 25.7 | 0.0 | 59.8 | 12.0 | 0.1 | 6.9 | 5.1 | 1,363 | 735 | 61.5 |
| 2 | 7.1 | 0.2 | 174.8 | 5.1 | 26.2 | 0.0 | 58.9 | 11.8 | 0.2 | 6.8 | 4.9 | 1,316 | 710 | 60.2 |
| 3 | 6.9 | 0.2 | 171.1 | 5.0 | 26.8 | 0.0 | 58.0 | 11.6 | 0.3 | 6.7 | 4.7 | 1,267 | 685 | 59.0 |
| 4 | 6.7 | 0.2 | 167.3 | 4.9 | 27.3 | 0.0 | 57.1 | 11.4 | 0.4 | 6.6 | 4.5 | 1,223 | 660 | 57.8 |
| 5 | 6.5 | 0.2 | 163.6 | 4.8 | 27.9 | 0.0 | 56.2 | 11.3 | 0.5 | 6.5 | 4.3 | 1,178 | 635 | 56.5 |
| 6 | 6.3 | 0.2 | 159.8 | 4.7 | 28.4 | 0.0 | 55.3 | 11.1 | 0.6 | 6.4 | 4.1 | 1,133 | 611 | 55.2 |
| 7 | 6.1 | 0.2 | 156.0 | 4.6 | 29.1 | 0.0 | 54.5 | 10.9 | 0.7 | 6.3 | 3.9 | 1,089 | 588 | 54.0 |
| 8 | 5.9 | 0.2 | 152.3 | 4.5 | 29.7 | 0.0 | 53.6 | 10.7 | 0.9 | 6.2 | 3.7 | 1,046 | 564 | 52.7 |
| 9 | 5.7 | 0.2 | 148.5 | 4.4 | 30.4 | 0.0 | 52.7 | 10.5 | 1.0 | 6.0 | 3.5 | 1,003 | 541 | 51.3 |
| 10 | 5.5 | 0.2 | 144.8 | 4.3 | 31.1 | 0.0 | 51.9 | 10.4 | 1.1 | 5.9 | 3.3 | 961 | 518 | 50.0 |
| 11 | 5.3 | 0.2 | 141.0 | 4.2 | 31.8 | 0.0 | 51.0 | 10.2 | 1.2 | 5.8 | 3.1 | 919 | 496 | 48.6 |
| 12 | 5.1 | 0.2 | 137.4 | 4.1 | 32.6 | 0.0 | 50.2 | 10.0 | 1.3 | 5.7 | 2.9 | 879 | 474 | 47.2 |
| 13 | 4.9 | 0.2 | 133.5 | 4.0 | 33.4 | 0.0 | 49.4 | 9.9 | 1.4 | 5.6 | 2.7 | 838 | 452 | 45.8 |
| 14 | 4.7 | 0.2 | 129.7 | 3.9 | 34.2 | 0.0 | 48.5 | 9.7 | 1.5 | 5.5 | 2.4 | 798 | 431 | 44.4 |
| 15 | 4.5 | 0.2 | 126.0 | 3.8 | 35.1 | 0.0 | 47.7 | 9.6 | 1.6 | 5.4 | 2.2 | 759 | 410 | 42.9 |
| 16 | 4.3 | 0.2 | 122.2 | 3.7 | 36.1 | 0.0 | 47.0 | 9.4 | 1.7 | 5.3 | 2.0 | 721 | 389 | 41.4 |
| 17 | 4.1 | 0.2 | 118.4 | 3.6 | 37.1 | 0.0 | 46.2 | 9.2 | 1.8 | 5.2 | 1.8 | 682 | 368 | 39.9 |
| 18 | 3.9 | 0.2 | 114.7 | 3.5 | 38.1 | 0.0 | 45.4 | 9.1 | 1.9 | 5.1 | 1.6 | 645 | 345 | 38.3 |
| 19 | 3.7 | 0.2 | 110.9 | 3.4 | 39.2 | 0.0 | 44.7 | 8.9 | 2.0 | 5.0 | 1.4 | 608 | 328 | 36.7 |
| 20 | 3.5 | 0.2 | 107.2 | 3.3 | 40.4 | 0.0 | 44.0 | 8.8 | 2.1 | 4.9 | 1.2 | 571 | 308 | 35.0 |
| 21 | 3.3 | 0.2 | 103.4 | 3.2 | 41.7 | 0.0 | 43.3 | 8.7 | 2.2 | 4.8 | 1.0 | 534 | 288 | 33.3 |
| 22 | 3.1 | 0.2 | 99.6 | 3.1 | 43.0 | 0.0 | 42.6 | 8.5 | 2.3 | 4.7 | 0.8 | 498 | 269 | 31.6 |
| 23 | 2.9 | 0.2 | 95.9 | 3.0 | 44.4 | 0.3 | 42.3 | 8.5 | 2.5 | 4.6 | 0.6 | 463 | 250 | 29.5 |
| 24 | 2.7 | 0.2 | 92.1 | 2.9 | 45.9 | 1.3 | 42.6 | 8.5 | 2.6 | 4.5 | 0.4 | 427 | 230 | 27.1 |
| 25 | 2.5 | 0.2 | 88.4 | 2.8 | 47.5 | 2.2 | 42.9 | 8.6 | 2.7 | 4.3 | 0.2 | 392 | 211 | 24.6 |
| 26 | 2.3 | 0.2 | 84.6 | 2.7 | 49.3 | 3.2 | 43.3 | 8.7 | 2.8 | 4.2 | 0.0 | 358 | 193 | 22.3 |
| 27 | 2.1 | 0.2 | 80.8 | 2.6 | 51.2 | 4.1 | 43.7 | 8.7 | 2.9 | 4.1 | 0.0 | 334 | 180 | 20.6 |
| 28 | 1.9 | 0.2 | 77.1 | 2.5 | 53.2 | 5.0 | 44.2 | 8.8 | 3.0 | 4.0 | 0.0 | 310 | 167 | 19.0 |
| 29 | 1.7 | 0.2 | 73.3 | 2.4 | 55.4 | 6.0 | 44.7 | 8.9 | 3.1 | 3.9 | 0.0 | 287 | 155 | 17.4 |
| 30 | 1.5 | 0.2 | 69.6 | 2.3 | 57.7 | 6.9 | 45.2 | 9.0 | 3.2 | 3.8 | 0.0 | 265 | 143 | 15.8 |
| 31 | 1.3 | 0.2 | 65.8 | 2.2 | 60.3 | 7.9 | 45.8 | 9.2 | 3.3 | 3.7 | 0.0 | 244 | 131 | 14.4 |
| 32 | 1.1 | 0.2 | 62.0 | 2.1 | 63.2 | 8.8 | 46.5 | 9.3 | 3.4 | 3.6 | 0.0 | 223 | 120 | 13.0 |
| 33 | 0.9 | 0.2 | 58.3 | 2.0 | 66.3 | 9.8 | 47.3 | 9.5 | 3.5 | 3.5 | 0.0 | 203 | 110 | 11.6 |
| 34 | 0.7 | 0.2 | 54.5 | 1.9 | 69.7 | 10.7 | 48.1 | 9.6 | 3.6 | 3.4 | 0.0 | 185 | 100 | 10.4 |
| 35 | 0.5 | 0.2 | 50.8 | 1.8 | 75.6 | 11.6 | 49.6 | 9.9 | 3.7 | 3.3 | 0.0 | 166 | 90 | 9.0 |
| 36 | 0.3 | 0.2 | 47.0 | 1.6 | 85.2 | 12.6 | 52.2 | 10.4 | 3.8 | 3.2 | 0.0 | 149 | 80 | 7.7 |
| 37 | 0.1 | 0.2 | 43.2 | 1.4 | 97.5 | 13.5 | 55.6 | 11.1 | 3.9 | 3.1 | 0.0 | 133 | 72 | 6.4 |
Step 9: Determine the required minimum reinforcement stiffness and strength
The required minimum working reinforcement stiffness is determined as:
The required minimum ultimate reinforcement strength is determined as:
The recommended combined safety factor is Fs = 5.5 for reinforcement ≤ 0.2 m, and Fs = 3.5 for reinforcement spacing of 0.4 m.
From Table 3.2, σh(max) is 59.84 kN/m2, at reinforcement no. 1 at depth z = 7.3 m and with sv = 0.2 m.
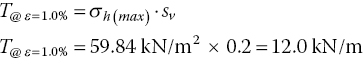
The uniform reinforcement spacing is 0.2 m, hence Fs = 5.5.
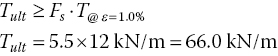
A reinforcement with minimum working stiffness, ![]() = 12.0 kN/m and minimum ultimate strength (per ASTM D4595 for geotextiles and D6637 for geogrids), Tult = 66.0 kN/m is required.
= 12.0 kN/m and minimum ultimate strength (per ASTM D4595 for geotextiles and D6637 for geogrids), Tult = 66.0 kN/m is required.
Step 10: Design of back/upper wall
| Reinforced fill: | same as that of the load‐bearing wall |
| Reinforcement: | same as that of the load‐bearing wall |
| Reinforcement length: | 4.25 m (length of approach slab) + 1.5 m = 5.75 m (see Step 10, Section 5.6.1 ) |
| Reinforcement layout: | vertical spacing = 0.3 m |
| Wrapped‐face with wrapped return at least 0.5 m (18 in.) in the horizontal direction and anchored in at least 100 mm of fill material. | |
| A compressible layer of approximately 50‐mm in thickness installed between the wrapped face and the rigid back wall is recommended. |
Step 11: Check angular distortion between abutments or piers
If the magnitude of settlement between any span of a bridge (i.e., between any adjacent abutments or piers) is expected to be different, angular distortion will need to be checked. For demonstration purposes, the following calculations for angular distortion are made with an assumed value of foundation settlement.

δ foundation = foundation settlement (as determined by conventional settlement computation methods)
Assume ![]()
Assuming the other end of the bridge segment is zero,angular distortion = (δtotal – 0)/span length = 0.1225 m/24 m = 0.0051
Largest tolerable angular distortion for simple span = 0.005
Angular distortion = 0.0051 ≈ 0.005 (OK)
Design Summary:
The configuration for the final design is shown in Figure 5.34.
Figure 5.34 Configuration of the final design, design example of the NCHRP design method for GRS bridge abutments
Abutment configuration:
| Load‐bearing wall height, H1 | 7.5 m |
| Back wall (upper wall) height | 2.2 m |
| Facing | dry‐stacked concrete blocks (200 × 200 × 400 mm) |
| Front batter | 1/35 |
| Sill type | integrated sill |
| Sill width | 1.5 m |
| Sill clear distance | 0.3 m |
| Embedment | 200 mm (one facing block height) |
Reinforcement:
Minimum working stiffness, T@ ε=1.0% = 12.0 kN/m
Minimum ultimate strength, Tult = 66.0 kN/m
Length in load‐bearing wall = 7.0 m
Length of top three layers in load‐bearing wall = 7.5 m
Vertical spacing in load‐bearing wall = 0.2 m
Length in back wall = 5.75 m
Vertical reinforcement spacing in back wall = 0.3 m
5.7 The GRS Non‐Load‐Bearing (GRS‐NLB) Walls Design Method
Wu (2012) developed a generic design method for GRS walls in non‐load‐bearing (NLB) applications where external loads are limited to common traffic loads. The design method, referred to as the GRS‐NLB method, adopts an allowable stress design (ASD) approach. Another version of the GRS‐NLB design method based on the load and resistance factor design (LRFD) approach has been presented by Beauregard (2016). A step‐by‐step procedure of the GRS‐NLB ASD design method is presented in this section. All six major design features described in Section 5.3 are incorporated in the GRS‐NLB design method.
The GRS‐NLB design method is primarily for concrete block GRS walls in non‐load‐bearing applications under the following conditions:
- The facing comprises dry‐stacked concrete blocks.
- The reinforcement spacing is not more than 0.3 m.
- The wall face is vertical or near‐vertical, i.e., no more than 10° off the vertical (or steeper than a batter of 1 (horizontal) to 7 (vertical)); vertical wall face is recommended for walls of low to medium height (i.e., height not over 20 ft or 6 m).
- No prop or temporary bracing is used during construction.
- The fill material is predominantly granular and free‐draining; the fill typically satisfies the following criteria: 100% passing 100 mm (4 in.) sieve, 0–60% passing No. 40 (0.425 mm) sieve, and no more than 20% of fines (passing No. 200 sieve), with liquid limit (LL) not more than 30, and plasticity index (PI) not more than 6.
- The backfill is compacted to at least 95% of the Standard Proctor maximum density or 90% of the Modified Proctor maximum density.
- The backfill, when compacted to 95% of the Standard Proctor at the optimum moisture content, should have an angle of internal friction of 34° or greater, as determined by the standard direct shear test on portion finer than 2 mm (No. 10) sieve.
- The slope of the wall crest is not more than
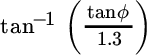 for granular fill.
 - The foundation soil is competent (i.e., with insignificant post‐construction settlement in the foundation soil); approximately level within 0.3H in front of the wall face (H = height of wall face, measured from the bottom of the lowest facing block).
- The wall is only subject to common traffic loads, no high‐intensity edge load (as in bridge abutments) is present. Vertical surcharge/traffic load on the crest, q, when present, is no more than an equivalence of 3 ft (0.9 m) of overburden.
- Seismic loads are not a major concern.
For applications of the GRS‐NLB design method, the following should be noted:
- Concrete block GRS walls with closely spaced reinforcement (i.e., spacing not more than 0.2 m), although designed to withstand only static loads, have been shown to be capable of withstanding earthquake motions up to 0.2g peak ground acceleration without visible distress, especially with measures taken on two ends of a bridge (Helwany et al., 2012).
- Even though there are practical height limitations in considerations of ease of construction, visual perception, and aesthetics, there is no theoretical limit to the height of closely spaced GRS walls in non‐load‐bearing applications (see Section 5.3.5).
- The GRS‐NLB design method is primarily for GRS walls with concrete block facing. For applications of the design method to other types of wall facing, adequate mobilization of reinforcement loads must be permitted during construction, also the stability of facing and connection between facing and reinforced soil mass must be ensured.
5.7.1 Design Procedure: The GRS‐NLB Method
Step 1: Establish wall profile and verify design conditions
A wall profile for design should be established in consideration of the grading plan at the wall site. When a project involves variation in wall height along the longitudinal direction, the designer should choose proper height intervals to allow for a gradual change in height. An example is given in Figure 5.35.

Figure 5.35 Profile of a GRS wall with variation in wall height
The conditions for non‐load‐bearing applications listed at the beginning of Section 5.7 should be checked. If the conditions are not met, the design method is not recommended.
Step 2: Determine design parameters for reinforced fill, retained fill, and foundation
Soil parameters needed for design include:
- moist unit weight (γ), Mohr–Coulomb angle of internal friction (at peak strength) (ϕ ), and angle of dilation (ψ) of the compacted fill in the reinforced soil zone
- moist unit weight (γrf ) and Mohr–Coulomb angle of internal friction (at peak strength) (ϕrf ) of the fill in the retained fill zone (i.e., immediately behind the reinforced soil zone)
- moist unit weight (γ f) and Mohr–Coulomb strength parameters (at peak strength) (cf and ϕf ) of the foundation soil; for purely cohesive foundation: ϕf = 0 and cf = undrained shear strength, which can be determined by appropriate field or laboratory tests; for granular foundation: cf = 0, and ϕf can be estimated from standard penetration blow count or other in situ shear strength tests.
For a granular fill material, the value of ϕ in a set of direct shear tests should be determined by drawing a best‐fit straight line through the data points and ignoring the cohesion.
Step 3: Determine forces acting on reinforced soil mass
The reinforced soil mass together with block facing (where the block facing is regarded as a façade) should be considered as a rigid body when evaluating external stability. Figures 5.36(a) and (b) show forces acting on and in the reinforced soil mass for external stability evaluation of a GRS wall with a level crest (also referred to as horizontal backslope) and with a sloping crest (also referred to as sloping backslope), respectively. The figure includes body force (e.g., self‐weight), traffic surcharge, and earth thrusts from the retained fill on the reinforced soil mass. The coefficient of Rankine active earth pressure, KA, in Figure 5.36(a) is calculated as:  .
.
GRS walls with a break in the crest slope (see Figure 5.37), referred to as a broken crest or broken backslope, can be analyzed as an equivalent sloping crest (shown by a dashed line in Figure 5.37) if the break in the slope is located within 2H from the back of the wall face (H = total wall height measured from the bottom of the lowest block), as suggested by AASHTO (2002, 2014). Alternatively, the actual slope geometry of the broken crest can be analyzed by the Coulomb theory, with the soil–wall friction angle δ as discussed in Section 2.4.
Figure 5.36 Forces acting on the reinforced zone of a GRS wall with (a) a level crest with traffic surcharge and (b) a sloping crest, the GRS‐NLB design method
Figure 5.37 Equivalent sloping crest (denoted by the dashed line) for a wall with a broken crest
In subsequent steps, the design computations will involve resisting forces/moments and driving forces/moments for evaluation of safety factors. To be on the conservative side, for calculations of resisting forces/moments, the traffic surcharge in the crest area is assumed to begin at the end of the reinforced zone (see Figure 5.36(a)). For calculations of driving forces/moments, on the other hand, the surcharge is assumed to extend over the entire crest area.
Step 4a (for walls with a sloping crest, skip to Step 4b): Determine a tentative reinforcement length of a GRS wall with a level crest
A tentative reinforcement length is obtained by considering two potential failure modes: (i) lateral sliding failure and (ii) eccentricity failure. If all reinforcement layers are to have the same length, the tentative reinforcement length should be the greater of the two lengths obtained from the above two modes of failure. Should construction of the wall involve excavation into rock outcrop or heavily overconsolidated clay, the costs of excavation to accommodate uniform reinforcement length may be impractically high. In such a situation, the use of shorter reinforcement in the lower portion of the reinforced zone (referred to as the truncated base) is allowed, especially if the fill material is free‐draining and the foundation soil is firm. Note that the provision of a truncated base (see Step 5 of the NCHRP design method, Section 5.6.1) will affect external stability, movement of the wall face, etc. Note also that overturning failure check is not needed because it is always less critical than eccentricity failure (lift‐off of reinforced soil mass) as long as the safety factor against overturning is smaller than 3.0. For added conservatism, all reinforcement lengths are to be measured from the back of the wall face.
- Lateral sliding failure
To obtain a tentative reinforcement length against lateral sliding failure, an initial trial value of
 may be assumed. For a GRS wall of uniform reinforcement length (see Figure 5.36(a)), the safety factor against lateral sliding is:
Therefore, the required length of reinforcement (Lt) to resist lateral sliding failure is:
In Eqns. (5‐38) and (5‐39), H is the height of the wall at wall face measured from the bottom of the lowest facing block, and δ is the friction angle between the base of the reinforced zone and the foundation soil. If the lowest layer of reinforcement is on the ground surface, δ will be the friction angle between the geosynthetic reinforcement and the foundation soil, which can be obtained by performing interface shear tests of the two materials. If δ is greater than either ϕ or ϕf , the lesser value of ϕ and ϕf should be used for δ. In the absence of interface shear test results,
 may be assumed. The recommended minimum safety factor FSsliding against lateral sliding failure is 1.5.
 - Eccentricity failure
The reinforced soil mass in a GRS wall is typically subject to both vertical and horizontal forces acting above the base, hence the resultant force at the base of the reinforced soil mass without introducing a bending moment will usually be eccentric. The line of action of the eccentric resultant force needs to stay within the middle third of the base of the reinforced soil mass to prevent lift‐off of the reinforced soil mass from the foundation soil (i.e., to prevent tension at the contact surface). Using the tentative reinforcement length Lt determined from the lateral sliding failure check, the eccentricity e, measured from the centerline of the reinforced soil mass, is:
The parameters in Eqn. (5‐40) are as defined in Figure 5.36(a). Note that surcharge q is not included in the denominator of Eqn. (5‐40) as it is part of the resisting forces. The e value must not be greater than Lt/6. If
 , a larger value of Lt should be selected, and the corresponding value of e should be re‐calculated. This procedure needs to be repeated until a value of Lt that satisfies
  is obtained.

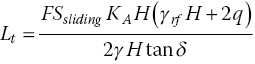
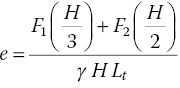
Step 4b (for walls with a level crest, skip to Step 5): Determine a tentative reinforcement length of a GRS wall with a sloping crest
A tentative reinforcement length for GRS walls with a sloping crest needs to be obtained by an iterative procedure. A trial reinforcement length, Lt , is first assumed for determination of the safety factor against the lateral sliding failure at the base of the reinforced soil mass. The safety factor against lateral sliding, FSsliding , needs to be at least 1.5. If FSsliding is less than 1.5, a longer trial length should be analyzed until FSsliding ≥ 1.5 is obtained. The tentative reinforcement length Lt that satisfies the lateral sliding failure criterion is then used to check against eccentricity failure (i.e., lift‐off of reinforced soil mass). The reinforcement length needs to be increased again if it fails to meet the eccentricity failure criterion. When construction of a wall involves excavation into rock outcrop or heavily overconsolidated clay, use of shorter reinforcement in the lower portion of reinforced zone (referred to as the truncated base) to minimize excavation is allowed, especially if the fill material is free‐draining and the foundation soil is firm. Note that the provision of a truncated base (see Step 5 of the NCHRP design method, Section 5.6.1) may affect external stability, movement of wall face, etc. Note also that there is no need to check overturning failure in design because it is always less critical than eccentricity failure as long as the safety factor against overturning is smaller than 3.0. For added conservatism, all reinforcement lengths are measured from the back of the wall face.
- Lateral sliding failure
To obtain a tentative reinforcement length against lateral sliding failure, an initial trial value of
 may be assumed. Using this trial value for Lt, a projected vertical height above the end of reinforced zone, h, is determined as
 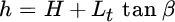 , where β is the angle of the sloping crest with the horizontal plane (see Figure 5.36(b)). The resultant active force Frf , exerted by retained fill on the reinforced soil mass, inclining counterclockwise at an angle β from the horizontal plane, is:
Once Frf is determined, its horizontal and vertical components FH and FV (see Figure 5.36(b)) can be calculated as
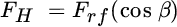 , and
, and 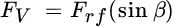 .
.For a GRS wall of uniform reinforcement length (see Figure 5.36(b)), the safety factor against lateral sliding failure, FSsliding , is:
In Eqn. (5‐42), δ is the friction angle between the base of the reinforced zone and the foundation soil. If the lowest layer of reinforcement is on the ground surface, δ will be the friction angle between the geosynthetic and foundation soil, and the value of δ can be obtained by performing foundation soil–geosynthetic interface shear tests. If δ is greater than either ϕ or ϕf , the lesser of ϕ and ϕf should be used as δ in the calculation. In the absence of interface shear test results,
 may be assumed.
If FSsliding < 1.5, the above procedure should be repeated with an increased Lt until a value of Lt that gives FSsliding ≥ 1.5 is obtained. This can be easily accomplished with the aid of a spreadsheet.
- Eccentricity failure
The reinforced soil mass in a GRS wall is typically subject to both vertical and horizontal forces (acting above the base), hence the resultant force at the base of the reinforced soil mass without introducing a bending moment will be eccentric. The line of action of the eccentric resultant force needs to stay within the middle third of the base of the reinforced soil mass to prevent lift‐off of the reinforced soil mass from the foundation soil. The length Lt determined from lateral sliding failure may be used to check eccentricity failure by calculating the eccentricity e (measured from the center line of the reinforced soil mass) to see if it satisfies the eccentricity requirement of
 :
:where RV is the resultant of vertical forces
 . If
. If  , the tentative length is said to satisfy the eccentricity failure criterion; otherwise, Lt needs to be increased, and a new value of e needs to be calculated until it meets the eccentricity requirement of
  .
.
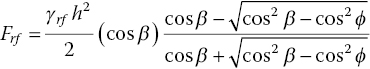
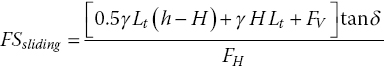
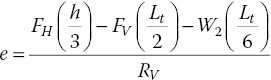
Step 5: Check stability against foundation bearing failure
Following the work of Meyerhof (1963), the safety factor against the foundation bearing failure, FSbearing, of the reinforced mass can be determined by the following equation:
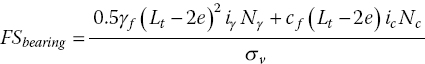
where σv is the average reaction pressure at the base, which can be determined as follows.
For a level crest with uniform traffic surcharge q:
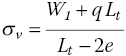
For a sloping crest:
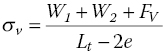
The value of eccentricity, e, in Eqns. (5‐45) or (5‐46) has been determined in Step 4. Forces W1 , W2 , and FV are as defined in Figure 5.36(b). The multipliers iγ and ic in Eqn. (5‐44) are defined as:

The angle of inclination λ is the angle between the vertical plane and the orientation of the resultant of all forces acting on the reinforced soil mass (i.e., the resultant of q, W1, F1 and F2 for walls with a level crest, or the resultant of W1 , W2 , and Frf for walls with a sloping crest, see Figure 5.36). The bearing capacity factors, Nγ and Nc are a function of friction angle (ϕf ) of the foundation soil, as given in Figure 5.38. For a cohesive foundation, Nγ = 0 and Nc = 5.14.
Figure 5.38 Bearing capacity factors Nc , Nγ , and Nq as a function of soil friction angle (modified after Perloff and Baron, 1976)
The safety factor against foundation bearing failure, FSbearing , should be at least 2.5. Note that the side shear of the reinforced zone is ignored for conservatism in the above computations, hence FSbearing = 2.5 (slightly lower than the commonly used value of 3.0 for footings) is recommended. If the value of FSbearing is less than 2.5, Lt may be increased until FSbearing ≥ 2.5 is obtained. Alternatively, the embedment depth of the reinforced soil mass may be increased to increase resistance against foundation bearing failure. An increase in embedment is particularly effective if the foundation soil is granular. In this case, ![]() (where Df = depth of embedment) should be added to the numerator in Eqn. (5‐44) for the calculation of FSbearing , i.e.,
(where Df = depth of embedment) should be added to the numerator in Eqn. (5‐44) for the calculation of FSbearing , i.e.,
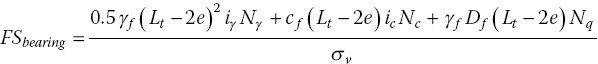
The values of Nq as a function of ϕf are given in Figure 5.38. If the reinforcement length becomes too large (say, ![]() ), especially if the foundation soil is cohesive, a reinforced soil foundation as described in Step 12 may be considered.
), especially if the foundation soil is cohesive, a reinforced soil foundation as described in Step 12 may be considered.
For GRS walls with a truncated base, the design computations are very similar to those described above. The detailed procedure is illustrated in Design Example 3 in Section 5.7.2.
Step 6: Select vertical reinforcement spacing and block height
Selecting a small value for vertical reinforcement spacing, in multiples of facing block height between 0.1 m (4 in.) and 0.3 m (12 in.), is recommended to take advantage of tight reinforcement spacing to gain significantly better performance and improved stability (Wu et al., 2010). Uniform spacing throughout is usually selected to avoid confusion during actual installation of geosynthetic reinforcement. For taller GRS walls (say, ![]() ), however, use of two or more values of vertical spacing may prove to be justifiable, especially for very long walls. When more than one value of reinforcement spacing is selected, smaller spacing is generally used in lower layers. Alternatively, if reinforcement spacing is to be kept constant for the entire wall, weaker reinforcement may be used for the upper part of the wall.
), however, use of two or more values of vertical spacing may prove to be justifiable, especially for very long walls. When more than one value of reinforcement spacing is selected, smaller spacing is generally used in lower layers. Alternatively, if reinforcement spacing is to be kept constant for the entire wall, weaker reinforcement may be used for the upper part of the wall.
When reinforcement is not placed at every course of facing blocks, the CTI tail (shortened reinforcement in place of full‐length reinforcement) on every other block may be employed. The CTI tail typically extends only 1.0 m (3 ft) behind the back of facing blocks (see Section 6.1.1). Great care needs to be exercised to avoid confusion on sequencing of reinforcement placement during construction when the CTI tail is used.
Step 7: Determine required tensile stiffness and strength for reinforcement
As noted in Section 5.3.1, both tensile stiffness and tensile strength are needed for the specification and design of geosynthetic reinforcement. Tensile stiffness is defined as the tensile resistance at a reference reinforcement strain. For GRS‐NLB, a reference strain of 3.0% is recommended. Specification of a minimum value for tensile stiffness ensures that the selected reinforcement will be stiff enough to provide satisfactory performance under service loads. The required minimum reinforcement stiffness in the direction perpendicular to the wall face, ![]() , can be determined by the following equation (see Section 5.3.1 for background information):
, can be determined by the following equation (see Section 5.3.1 for background information):
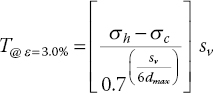
where ![]() = required minimum tensile stiffness at ε = 3% on the load–deformation curve (as obtained from the wide‐width tensile test, ASTM D4595 for geotextiles and D6637 for geogrids), σh = horizontal stress in GRS mass at the depth of reinforcement being considered, σc = lateral confining pressure of GRS mass at the depth of reinforcement being considered, sv = reinforcement spacing, and dmax = maximum particle size of the backfill.
= required minimum tensile stiffness at ε = 3% on the load–deformation curve (as obtained from the wide‐width tensile test, ASTM D4595 for geotextiles and D6637 for geogrids), σh = horizontal stress in GRS mass at the depth of reinforcement being considered, σc = lateral confining pressure of GRS mass at the depth of reinforcement being considered, sv = reinforcement spacing, and dmax = maximum particle size of the backfill.
The largest value of σh typically occurs at the base of the wall and can be estimated by the Rankine active earth pressure theory. For a GRS wall with a level crest and subjected to a uniform surcharge, ![]() , where γ is the unit weight of the backfill, H is the height of the wall, q is the uniform surcharge, and KA is the coefficient of Rankine active earth pressure. For a GRS wall with a sloping crest (slope angle = β, Figure 5.36(b)), the bottom layer of reinforcement is usually subject to the highest horizontal stress, and the largest vale of σh is
, where γ is the unit weight of the backfill, H is the height of the wall, q is the uniform surcharge, and KA is the coefficient of Rankine active earth pressure. For a GRS wall with a sloping crest (slope angle = β, Figure 5.36(b)), the bottom layer of reinforcement is usually subject to the highest horizontal stress, and the largest vale of σh is ![]() .
.
For a GRS wall with dry‐stacked concrete block facing, the value of σc can be estimated as ![]() , where γb is the bulk unit weight of the facing block, D is the depth of the facing block (in the direction perpendicular to the wall face), and δb is the friction angle between facing blocks (or between the geosynthetic reinforcement and the facing block, if geosynthetic reinforcement is installed between adjacent blocks). The value of σc is very small for light‐weight dry‐stacked facing, and can be conservatively assumed to be zero.
, where γb is the bulk unit weight of the facing block, D is the depth of the facing block (in the direction perpendicular to the wall face), and δb is the friction angle between facing blocks (or between the geosynthetic reinforcement and the facing block, if geosynthetic reinforcement is installed between adjacent blocks). The value of σc is very small for light‐weight dry‐stacked facing, and can be conservatively assumed to be zero.
In addition to specifying the stiffness requirement, the strength requirement for reinforcement is needed as well. The required minimum value of the ultimate strength of reinforcement in the direction perpendicular to the wall face, Tult , can be determined by imposing a ductility and long‐term factor, Fdl , on ![]() to ensure sufficient ductility (i.e., to prevent sudden collapse) and satisfactory long‐term performance, i.e.,
to ensure sufficient ductility (i.e., to prevent sudden collapse) and satisfactory long‐term performance, i.e.,
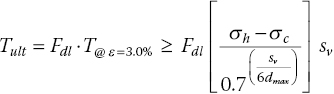
From limited experience, the tensile strain corresponding to Tult needs to be at least 5–7% (referred to as the ductility strain). The ductility and long‐term factor Fdl is a function of soil properties and geosynthetic type. The following values of Fdl are recommended (Note: Plasticity index (PI) of any fill material greater than 6 is not recommended):
- If the plasticity index (PI) of fill material passing No. 40 sieve is 3 or less:
- Fdl = 3.5 for all geosynthetics
- If the plasticity index (PI) of fill material passing No. 40 sieve is between 4 and 6:
- Fdl = 5.5 for polypropylene geosynthetics
- Fdl = 5.0 for polyethylene geosynthetics
- Fdl = 4.0 for polyester geosynthetics
Note that if more than one reinforcement (i.e., reinforcements of different stiffnesses/strengths) is selected, the σh‐value in Eqn. (5‐49) should be evaluated at the bottom of each group of reinforcement layers. Different values of required reinforcement stiffness and reinforcement strength for each group of reinforcement can then be determined.
Step 8: Select geosynthetic reinforcement
Select a geosynthetic product that satisfies the following conditions (cf. Figure 5.9):
- Stiffness requirement: the tensile stiffness in the direction perpendicular to wall face,
 (tensile stiffness at 3% strain), must be equal to or greater than the value calculated by Eqn. (5‐49).
 - Strength requirement: the ultimate strength, Tult , in the direction perpendicular to wall face must be equal to or greater than the value calculated by Eqn. (5‐50).
The load–deformation relationship of geosynthetic product, commonly expressed in terms of load per unit width versus tensile strain, can be determined by conducting a wide‐width tensile test (ASTM D4595 for geotextiles, ASTM D6637 for geogrids). The Tult value should be the minimum average roll value (MARV) of the product to account for statistical variance. For most geosynthetics that are not sensitive to confining pressure (i.e., woven geotextiles and geogrids), the load–deformation relationship determined by in‐isolation tests can be used for the selection of geosynthetic reinforcement. For confining pressure‐sensitive geosynthetics (i.e., nonwoven needle‐punched geotextiles), the intrinsic confined test proposed by Wu (1991), Ling et al. (1992), and Ballegeer and Wu (1993) is recommended. Note that for pressure‐sensitive geosynthetics, the effect of confining pressure has been found to be much more pronounced on the tensile stiffness than on the ultimate strength. For example, the increase in stiffness (secant modulus) for a nonwoven needle‐punched geotextile under a confining pressure of 80 kPa is found to be about 100%, whereas the corresponding increase in ultimate strength is only about 30%. Note that pressure‐sensitive geosynthetics are generally not selected in the design of GRS walls due to their relatively low stiffness values.
Step 9: Estimate lateral movement of wall face
The lateral displacement profile of the wall face of a block facing GRS wall can be estimated by the following equation (Pham, 2009; Wu and Pham, 2010). The lateral movement Δi at a given depth zi of a GRS wall is:
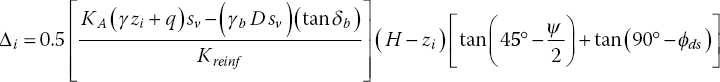
where Kreinf = stiffness of the geosynthetic reinforcement (![]() , see Figure 4.19), ϕds = friction angle of soil in the reinforced zone, as obtained from direct shear tests, and ψ = angle of dilation of the soil in reinforced zone. Other parameters are as defined in Section 5.3.3. In the absence of soil dilation data, the angles of dilation ψ can be estimated as 0°, 10°, and 20°, for loose, medium, and dense sands, respectively. The value of ϕds can be estimated from the plane‐strain angle of friction, ϕps , and the angle of dilation, ψ, as (Jewell and Milligan, 1989):
, see Figure 4.19), ϕds = friction angle of soil in the reinforced zone, as obtained from direct shear tests, and ψ = angle of dilation of the soil in reinforced zone. Other parameters are as defined in Section 5.3.3. In the absence of soil dilation data, the angles of dilation ψ can be estimated as 0°, 10°, and 20°, for loose, medium, and dense sands, respectively. The value of ϕds can be estimated from the plane‐strain angle of friction, ϕps , and the angle of dilation, ψ, as (Jewell and Milligan, 1989):
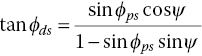
A vertical face without a batter is recommended for walls of low to medium height (less than 20 ft or 6 m in height) because a batter usually offers little practical benefit in these cases. For walls with a battered face, an empirical facing batter factor Φfb , suggested by Allen and Bathurst (2001), may be applied to account for the facing batter. For a facing batter of 8°, Allen and Bathurst (2001) suggest an empirical equation for determination of the lateral earth pressure on the wall face:

where Kab and Kav are horizontal components of the active earth pressure coefficient for a battered wall and a vertical wall, respectively, and d is a constant. Allen and Bathurst (2001) found that d = 0.5 would yield the best fit for available Tmax data, and recommended using d = 0.5 for determination of Φfb. For design of a battered wall, Kab determined from Eqn. (5‐53) can be used in place of KA in Eqn. (5‐51) for evaluation of the wall displacement profile. This procedure is illustrated in Design Examples 2 and 3 in Section 5.7.2.
For GRS walls with a sloping crest, the portion of soil above the top of the wall face can be regarded as an equivalent uniform overburden pressure of 0.5 γ L(tan β) for the term q in Eqn. (5‐51). Note that Eqn. (5‐51) ignores the down‐drag force along the contact surface between the back of the wall face and the backfill behind. This will lead to a conservative (i.e., larger than actual) lateral displacement profile.
From Eqn. (5‐51), the maximum lateral displacement of a wall, Δmax , can readily be determined. If the maximum wall displacement exceeds a prescribed performance limit, measures should be taken to alleviate the problem. Measures to consider include decreasing reinforcement spacing and increasing reinforcement stiffness/strength. Strictly speaking, Eqn. (5‐51) is applicable only to GRS walls with concrete block facing. For GRS walls with other types of facing, Δmax would be different. Take geotextile wrapped‐faced walls for instance, Δmax will be about 15% larger than that calculated by Eqn. (5‐51).
Step 10: Check stability against pullout failure
For GRS walls with a level crest and uniform reinforcement length, the safety factor against pullout failure for reinforcement at depth zi (referred to as reinforcement layer‐i) is:
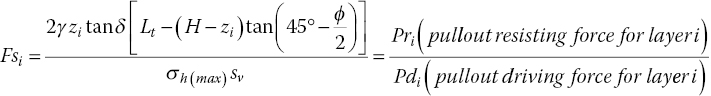
where Lt is the most updated value of reinforcement length (up to Step 9), σ h (max) is the maximum horizontal stress, and δ is the angle of friction at the soil–geosynthetic interface.
For GRS walls with a sloping crest, the sloping soil overburden can be regarded as an equivalent uniform surcharge, and the sloping crest wall considered as an equivalent level crest wall with an added wall height of 0.5 · Lt · (tan β) or subjected to a vertical surcharge pressure of 0.5 · γ · Lt · (tan β).
The coefficient of interface friction, f = tan δ, can be determined from the results of a pullout test by the interface pullout formula (Eqn. (4‐2), Section 4.2.4), i.e.,
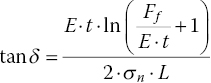
where Ff = applied pullout force at failure (per unit width of reinforcement) in the pullout test, L = total length of the reinforcement specimen used in the pullout test, E = Young’s modulus per unit width of reinforcement, t = nominal thickness of reinforcement, and σn = normal stress (overburden) on the reinforcement specimen. In the absence of pullout test results, the angle δ can be assumed as 2/3 of the friction angle of the backfill, i.e., δ = (2/3)ϕ.
The maximum horizontal stress for a given layer of reinforcement at depth zi (measured from the crest), σhi (max), in Eqn. (5‐54) can be determined as:
As in Step 9, for GRS walls with a battered wall face, an empirical facing batter factor, Φfb, suggested by Allen and Bathurst (2001), may be applied to account for the facing batter:
where Kab and Kav are the horizontal components of the active earth pressure coefficient for a battered wall and a vertical wall, respectively, and d = 0.5 for the best fit of available Tmax data. For a battered wall, the value of Kab determined from Eqn. (5‐57) can be used in place of KA in Eqn. (5‐56). Again, wall batter is generally of little practical value for walls of low to medium heights. The maximum tensile force, i.e., the denominator of Eqn. (5‐54), σh(max) ∙ sv , should be calculated for each selected value of vertical spacing. To be conservative, the contribution of surcharge q is ignored in Eqn. (5‐54). For a wall on uniform vertical spacing and with a uniform reinforcement length for all layers, the maximum horizontal stress (σh(max)) at the lowest reinforcement layer should be used for calculation of Tmax. For a wall of more than one reinforcement spacing, Tmax should be calculated at the lowest reinforcement layer of each spacing used in design.
In all prevailing design methods, stability against pullout failure is checked by requiring each and every layer of reinforcement to meet a minimum safety factor against pullout. As discussed in Section 5.3.2, it is not a realistic scenario that a single reinforcement layer is being pulled out while all the adjacent reinforcement layers remain immobilized in a closely spaced reinforced soil mass. In other words, pullout failure cannot occur in a single layer alone when reinforcement layers are tightly spaced. If pullout failure is to occur, it will only occur as a group. To evaluate pullout of reinforcement, a group safety factor as defined in Section 5.3.2 may be used to allow for a more rational evaluation of pullout stability.
It is recommended that the group safety factor be evaluated by the rule of three, i.e., pullout failure will occur if the group safety factor for any three consecutive reinforcement layers is below a prescribed value (see Section 5.3.2). The group safety factor Fs(group), with its mid‐layer located at depth zi , is defined as:

For a level crest with surcharge q:
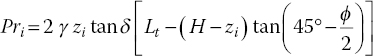

For a sloping crest:
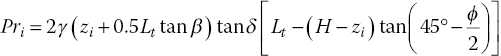
where  , and the subscripts i–1, i, and i+1 refer to reinforcement layers at depths zi–1, zi and zi+1, respectively. Eqn. (5‐58) states that the group safety factor against reinforcement pullout is the sum of resisting pullout forces for any three consecutive layers divided by the sum of the driving pullout forces for the same three layers. Note again that there is no reinforcement above the top layer or beneath the bottom layer of a wall, hence the values of the non‐existent layers should be taken as zero (i.e., Pri–1 = Pdi–1 = 0 for evaluation of Fs (group) for the top layer, and Pri+1 = Pdi+1 = 0 for evaluation of Fs (group) for the bottom layer). Note also that surcharge q does not appear in Eqn. (5‐59) as it is for calculation of a resisting force, but appears in Eqn. (5‐60) as it is for calculation of a driving force (see Figure 5.23(a)).
If the any of the Fs (group) is less than 1.5, the reinforcement length Lt will need to be increased until all values of Fs (group) are at least 1.5.
Step 11: Check stability against rotational slide‐out failure
Using the updated reinforcement length determined in Step 10, stability against rotational slide‐out failure should be evaluated. This can be carried out by using limiting‐equilibrium based slope stability computer software such as SLOPE‐W, STABL WV, ReSSA, etc.
The rotational slide‐out analysis should include not only analysis of overall slide‐out failure encompassing the entire reinforced soil wall, but also analysis of compound failure (see Figure 5.4), especially in situations where the wall is situated over sloping or soft ground. For a trial slip surface passing through the soil–geosynthetic composite mass, the strength parameters of the reinforced soil mass (cR and ϕR) can be taken as (Wu et al., 2010):
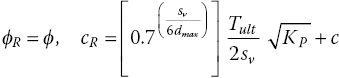
where KP = coefficient of Rankine passive earth pressure, Tult = tensile strength of the reinforcement, as determined in Step 8, sv = vertical spacing of reinforcement, dmax = maximum particle size of the reinforced fill, and c = cohesion of the soil (c can be ignored if it is small, say less than 10 kPa).
The factor of safety against any trial of rotational slide‐out failure should be at least 1.3. Otherwise, the reinforcement length may be increased to provide an adequate safety margin. Alternatively, a viable ground improvement technique may be employed to improve the strength of the foundation soil when warranted. The design reinforcement length can then be finalized at the completion of this design step. Recall that all reinforcement lengths referred to in the design computations are to measure from the back of facing.
Step 12: Determine facing requirements
Facing requirements involve three aspects: embedment, facing batter, and connection strength.
- Embedment
If there is no concern for erosion or other untoward events surrounding the wall base during design life (typically 75 years), the required embedment of a GRS‐NLB wall can be a nominal depth of 0–200 mm, i.e., up to one typical concrete block height. Note that a nominal embedment of ½ to 1 block height can help to prevent outward movement of facing blocks during construction before the wall gets taller.
Design of shallow foundations requires that the base of the footing be placed below the maximum frost penetration depth to alleviate uneven heaving due to formation of ice lenses in the frost zone. Since heaving of the foundation soil can be absorbed by the reinforced soil mass of a GRS‐NLB wall, and will usually not hinder wall performance, it can be argued that embedding the wall base below the maximum frost penetration depth is unnecessary. However, if the foundation soil contains frost‐susceptible soils (e.g., silty soils, see Holtz et al., 2011 for details), it is recommended that the foundation soils be excavated to the maximum frost penetration depth and replaced with a non‐frost‐susceptible soil. The backfill in the excavated zone can be reinforced by geosynthetic reinforcement to form a reinforced soil foundation (RSF) (Adams et al., 2011a). A typical RSF for GRS abutments involves excavating a pit that is 0.5L deep (L = reinforcement length, determined in Step 11), backfilling it with compacted road base material, and reinforcing it by the same reinforcement used in the reinforced soil wall on 0.2–0.3 m vertical spacing. The lateral extent of the RSF should at least cover the footprint of the reinforced fill and should extend no less than 0.25L in front of the wall face. A generic design protocol for RSF has recently been proposed by Wu (2018).
For GRS walls constructed along rivers and streams, embedment depths should be at least 0.6 m (2 ft) below the potential scour depth, as determined based on subsurface investigation and hydraulic studies. For GRS walls founded on a slope, a minimum horizontal bench width of 0.3H (H = wall height) should be provided.
At the base of the wall face, a leveling pad made of compacted granular soil may be formed to help align the first course of facing blocks. Good alignment of the first course of facing blocks is essential to overall alignment of a concrete block GRS wall. An alternative is to use a concrete leveling pad (see Section 6.2.4 about leveling pads).
- Facing batter
A vertical face is recommended for low to medium height concrete block walls (not exceeding 20 ft or 6 m in height). The wall face may batter slightly, typically from 1:10 to 1:12 (horizontal to vertical) to help mask minor lateral movement of the wall face. For design computations, slightly battered walls can be considered as vertical walls with only small errors.
- Connection strength
The facing of GRS walls should be designed to resist lateral pressure from the reinforced soil mass and to resist down‐drag force resulting from differential settlement between the reinforced soil mass and facing blocks. The connection strength required for a concrete block GRS wall is influenced by reinforcement spacing, constraints on facing movement (including weight of blocks and facing connection enhancement elements), surcharge on crest, reinforcement tensile properties, stress–strain–strength properties of the reinforced fill, relative settlement between facing blocks and reinforced mass, and construction sequence.
For walls that satisfy the four conditions for the bin pressure diagram (see Section 5.3.5), frictional resistance between concrete blocks has been found to be more than sufficient to satisfy connection stability requirements (i.e., resisting forces are always greater than driving forces at all depths). The four conditions are: (1) the facing offers insignificant restraint to lateral movement of the reinforced soil mass, (2) the fill material behind the facing is free‐draining so that there is little hydraulic pressure involved, (3) the soil–reinforcement interface bonding is maintained under the design load, and (4) the reinforcement is sufficiently stiff. For walls which fail to satisfy any of the four conditions, use of the connection force equations (i.e., Eqns. (5‐12) to (5‐15)) is recommended to check if facing connection stability is satisfied. It is highly recommended that the reinforcement spacing is kept small, preferably on 0.2 m spacing for GRS‐NLB. For closely spaced GRS walls with reinforcement at every facing block and reinforcement spacing not greater than 0.3 m, connection stability is satisfied regardless of wall height (see Section 5.3.5).
It is recommended that reinforcement sheets be placed in such a way that they cover the top surface area of the facing blocks as much as possible without protruding out of the wall face; in addition, when lightweight blocks are used, the top 2–3 courses of facing blocks be bonded together by concrete mix or mortar. This measure will offer added resistance to the lateral earth thrust under unexpected external loads.
5.7.2 Design Examples: The GRS‐NLB Method
Three design examples for the GRS‐NLB design method are given in this section, including (1) a GRS wall of a level crest, (2) a GRS wall of a broken crest, and (3) a GRS wall with a truncated base.
Given Conditions:
- General:
- Uniform wall height: H = 6.0 m, vertical wall face.
- Level ground and a level crest.
- Subject to common traffic loads only.
- All geosynthetic reinforcement layers are to have the same length.
- Backfill and retained fill:
- The backfill for the reinforced soil mass is a silty gravelly sand, with 12% of fines (by weight); maximum particle size = 25 mm (1 in.); liquid limit, LL = 10; plasticity index, PI = 2; moist unit weight, γ = 18.0 kN/m3; cohesion, c = 5 kPa; internal friction angle at peak strength, ϕ = 35°; and angle of dilation, ψ = 5°.
- Soil in the retained earth zone (i.e., soil behind the reinforced zone) is the same as that in the reinforced zone and with similar density and moisture.
- Surface runoff and subsurface drainage are to be provided properly.
- Foundation soil:
- The foundation soil is uniform up to 8 m below the ground surface; moist unit weight, γf = 18.8 kN/m3; cohesion, cf = 9.5 kPa; angle of internal friction, ϕf = 38°.
- There is no concern for erosion or other untoward events surrounding the planned location of the wall base during design life.
- Deep free water level.
- Loading:
- Common traffic loads only; vertical surcharge uniformly distributed over the crest, q = 12 kPa.
- No concern for seismic loads.
- Performance limit:
- Maximum permissible lateral movement of wall face is 1% of the wall height, i.e., Δmax = (6.0 m × 1,000 mm/m) (1%) = 60 mm.
- Facing:
- Dry‐stacked concrete blocks, with a vertical wall face.
- Facing blocks: split face CMU block (0.2 m × 0.2 m × 0.4 m) with hollow cells; bulk unit weight, γb = 12.6 kN/m3 (80 lb/ft3).
- Friction coefficient between block and geosynthetics, tan δb = 0.4.
- Interface friction and adhesion between backface of block and backfill: ignored (for conservatism).
Design Computations:
Step 1: Establish wall profile and verify design conditions
The cross‐section of the wall is as depicted in Figure 5.39. The conditions for non‐load‐bearing applications as listed at the beginning of Section 5.7 are verified, including fines content of reinforced backfill = 12% ≤ 20%, liquid limit = 10 ≤ 30, and plasticity index (PI) = 2 ≤ 6.
Step 2: Determine design parameters for reinforced fill, retained fill, and foundation
The values of the soil parameters are:

Step 3: Determine forces acting on reinforced soil mass
The forces acting on the reinforced soil mass for external stability checks are shown in Figure 5.40. The active Rankine earth pressure coefficient of the retained fill, KA = tan2 [45° – (35°/2)] = 0.27.
Figure 5.40 Forces acting on the reinforced soil mass for external stability evaluation, Design Example 1 of the GRS‐NLB method
Step 4: Determine a tentative reinforcement length (for a GRS wall with a level crest)
Tentative reinforcement lengths (Lt) against lateral sliding failure and eccentricity failure are determined as follows:
- Lateral sliding failure
Determine Lt against lateral sliding failure:
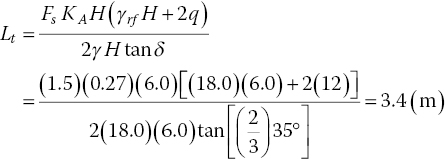
- Eccentricity failure
Determine Lt needed to prevent eccentricity failure:
Using Lt = 3.4 m (as determined in (i), above), the eccentricity, e, can be determined as (Eqn. (5‐40)):
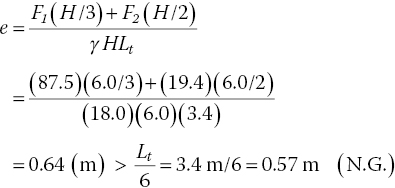
Set
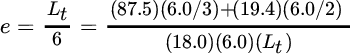
hence
 and
and 
Therefore, the tentative reinforcement length needs to be increased from Lt = 3.4 m (determined from lateral sliding failure check) to Lt = 3.6 m (determined from eccentricity failure check).
Step 5: Check stability against foundation bearing failure
From Figure 5.38, for ϕf = 38°, bearing capacity factors Nc = 65 and Nγ = 80
Vertical load = (γ H + q) Lt = [(18.0)(6.0) + 12)](3.6) = 432 (kN/m)
Horizontal load = F1 + F2 = 87.5 + 19.4 = 106.9 (kN/m)
Angle of inclination for the resultant load, λ = tan–1 (106.9/432) = 13.9° (< ϕ = 35°)
Hence, iγ = (1 – λ/ϕ)2 = (1 – 13.9°/35°)2 = 0.36
![]()
From Eqns. (5‐44) and (5‐45)
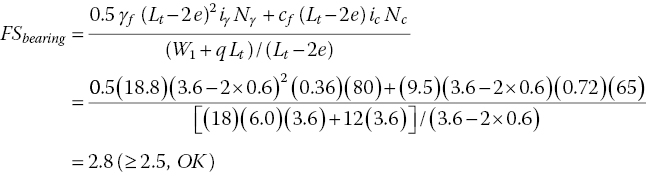
Since embedment of the wall is to be only nominal, its effect is not included in the calculation of FSbearing (Note: FSbearing determined by ignoring the effect of embedment has already been found adequate). The tentative reinforcement length of Lt = 3.6 m, therefore, remains unchanged.
Step 6: Select vertical reinforcement spacing and block height
Uniform spacing of 0.2 m (i.e., sv = 0.2 m) is selected. The height of each facing block is to be 0.2 m.
Step 7: Determine required tensile stiffness and strength for reinforcement
The confining stress of the reinforced soil mass (σc) is:
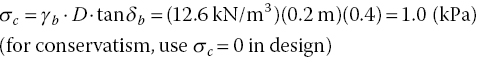
The maximum lateral stress (σh) is:
Required minimum reinforcement stiffness, T@ ε = 3.0% , in the direction perpendicular to wall face is:
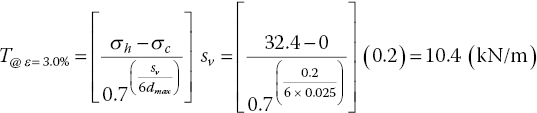
PI = 2 ≤ 3, thus the ductility and long‐term factor Fdl = 3.5, hence the required minimum value of ultimate reinforcement strength in the direction perpendicular to the wall face, Tult, is:
The tensile strain of the selected reinforcement corresponding to Tult ( ≥ 36.4 kN/m) needs to be at least 5–7%.
Step 8: Select geosynthetic reinforcement
Select a geosynthetic product with tensile stiffness T@ ε = 3.0% ≥ 10.4 kN/m and tensile strength Tult ≥ 36.4 kN/m at tensile strain ≥ 5–7%, both in the direction perpendicular to the wall face. A woven polypropylene geotextile with MARV = 38 kN/m (at ε = 10%) and T@ ε = 3.0% = 12 kN/m is selected.
Step 9: Estimate lateral movement of wall face
The lateral movement Δi at depth zi is:
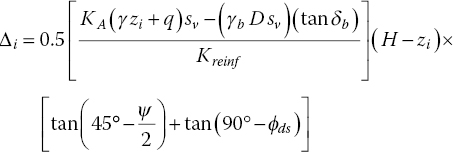
The reinforcement stiffness, Kreinf , is equal to T@ ε = 3.0%/(3%) = 12 kN/m/(3%) = 400 kN/m. The values of the other parameters are: KA = 0.27, γ = 18.0 kN/m3, q = 12 kN/m2, sv = 0.2 m, γb = 12.6 kN/m3, D = 0.2 m, tan δb = 0.4, H = 6.0 m, and ψ = 5°. The direct shear friction angle ϕds can be estimated as:
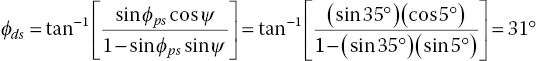
The lateral movement profile for a vertical wall face is shown in Figure 5.41. From the profile, the maximum lateral movement is found to be 33 mm, smaller than the specified performance limit of 60 mm.
Figure 5.41 Calculated lateral movement profiles for a vertical wall face and 1:12 battered wall face: Design Example 1 of the GRS‐NLB method
Should a facing batter of 1 (horizontal):12 (vertical) is employed (instead of a vertical wall specified in this example), the KA value will need to be modified. The empirical correction suggested by Allen and Bathurst (2001) is:
Therefore the term KA in the equation for Δi needs to be replaced by ![]() , and the maximum lateral movement will reduce from 33 mm to 25 mm (see Figure 5.41), both meeting the performance limit of 60 mm.
, and the maximum lateral movement will reduce from 33 mm to 25 mm (see Figure 5.41), both meeting the performance limit of 60 mm.
Step 10: Check stability against pullout failure
The pullout resisting force (Pri) and driving force (Pdi) for reinforcement layer‐i are (Eqns. (5‐59) and (5‐60)):
where  . Note that surcharge q (=12 kPa) does not appear in the equation for Pri , but appears in the equation for Pdi . The pullout resisting forces and driving forces for all layers are listed in Table 5.9.
Table 5.9 Resisting and driving pullout forces and group pullout safety factor for each reinforcement layer, Lt = 3.6 m, Design Example 1
| zi (m) | Pri (kN/m) | Pdi (kN/m) | Fs(group) |
| 0.2 | 1.8 | 1.4 | 2.7 |
| 0.4 | 4.3 | 1.7 | 2.7 |
| 0.6 | 7.4 | 2.0 | 3.8 |
| 0.8 | 11.1 | 2.3 | 4.9 |
| 1.0 | 15.5 | 2.6 | 6.0 |
| 1.2 | 20.5 | 2.9 | 7.1 |
| 1.4 | 26.2 | 3.2 | 8.2 |
| 1.6 | 32.5 | 3.5 | 9.2 |
| 1.8 | 39.5 | 3.9 | 10.3 |
| 2.0 | 47.1 | 4.2 | 11.4 |
| 2.2 | 55.4 | 4.5 | 12.4 |
| 2.4 | 64.3 | 4.8 | 13.5 |
| 2.6 | 73.9 | 5.1 | 14.5 |
| 2.8 | 84.1 | 5.4 | 15.6 |
| 3.0 | 95.0 | 5.7 | 16.6 |
| 3.2 | 106.5 | 6.0 | 17.6 |
| 3.4 | 118.6 | 6.4 | 18.7 |
| 3.6 | 131.4 | 6.7 | 19.7 |
| 3.8 | 144.9 | 7.0 | 20.8 |
| 4.0 | 158.9 | 7.3 | 21.8 |
| 4.2 | 173.7 | 7.6 | 22.8 |
| 4.4 | 189.1 | 7.9 | 23.9 |
| 4.6 | 205.1 | 8.2 | 24.9 |
| 4.8 | 221.8 | 8.5 | 26.0 |
| 5.0 | 239.1 | 8.9 | 27.0 |
| 5.2 | 257.1 | 9.2 | 28.0 |
| 5.4 | 275.7 | 9.5 | 29.1 |
| 5.6 | 295.0 | 9.8 | 30.1 |
| 5.8 | 314.9 | 10.1 | 31.2 |
| 6.0 | 335.4 | 10.4 | 31.7 |
Note: The group safety factor against pullout is the sum of the resisting pullout forces of any consecutive three layers divided by the sum of the driving pullout forces of the same three layers. Note that there is no layer above the top layer (i.e., layer i–1 does not exist) or beneath the bottom layer (i.e., layer i+1 does not exist). The values of the non‐existent layers (i.e., Pri–1 and Pdi–1 for evaluation of the top layer, and Pri+1 and Pdi+1 for evaluation of the bottom layer) are taken as zero.
Using the rule of three, i.e., the group pullout safety factor for any three consecutive reinforcement layers with its mid‐layer located at depth zi can be determined as:

The group pullout safety factors of the wall are also listed in Table 5.9. Note that the group safety factor of layer‐i in the table is the safety factor with layer‐i being the mid‐layer of the group. It is seen that the group safety factors for all layers are greater than 1.5, therefore the tentative reinforcement length will stay unchanged.
Step 11: Check stability against rotational slide‐out failure
A limiting‐equilibrium based slope stability program (such as SLOPE‐W, STABL WV, or ReSSA) can be used to evaluate different modes of rotational stability (including overall slide‐out failure and compound failure). The analysis can be carried out with the reinforced soil zone having the following soil–geosynthetic composite strength parameters (because the cohesion of the soil is quite small, c = 0 is assumed):
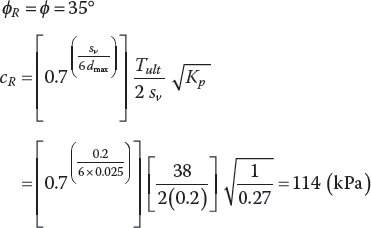
If the smallest safety factor against rotational slide‐out failure is less than 1.3, the reinforcement length may be increased to raise the safety factor. Alternatively, if the critical rotational failure plane is passing through the foundation soil, a viable ground improvement technique may be employed to improve the strength of the foundation soil.
Step 12: Determine facing requirements
- Embedment: The GRS wall is to be constructed with a nominal embedment of 0.1 m (half a block height) below the ground surface. This is based on the given information that there is very low probability of erosion or other unfavorable events occurring near the wall base through the design life of the wall.
- Facing batter: The facing of the GRS wall is to be vertical, no batter.
- Connection strength requirements: All facing blocks are to be dry‐stacked. Reinforcement is at every course of facing blocks and reinforcement spacing is 0.2 m, hence connection stability is ensured. The top two courses of facing blocks are to be bonded by filling the hollow cells with concrete mix or mortar.
Design Summary for Reinforcement:
Reinforcement length (uniform for all depths), L = 3.6 m
Reinforcement spacing (same for all depths), sv = 0.2 m
Reinforcement type: woven polypropylene with Tult = 38 kN/m (@ ε = 10%) and T@ ε=3.0% = 12 kN/m
Given Conditions:
- General:
- Uniform wall height: H = 6.0 m, with 1 (vertical) to 12 (horizontal) face batter.
- Level ground and a broken crest.
- All geosynthetic reinforcement layers are to have the same length.
- Backfill and retained fill:
- The backfill for the reinforced soil mass is a silty gravelly sand, with 14% of fines (by weight); maximum particle size = 25 mm (1 in.); liquid limit, LL = 10; plasticity index, PI = 2; moist unit weight, γ = 18.0 kN/m3; cohesion, c = 5 kPa; internal friction angle at peak strength, ϕ = 35°; and angle of dilation, ψ = 5°.
- Same soil in the reinforced zone and retained earth zone (the soil behind reinforced zone) with similar placement density and moisture.
- Surface runoff and subsurface drainage are to be properly provided.
- Foundation soil:
- The foundation soil is uniform up to 9 m below the ground surface, and moist unit weight, γf = 18.8 kN/m3; cohesion, cf = 9.5 kPa; angle of internal friction, ϕf = 38°.
- There is no concern for erosion or other untoward events surrounding the planned location of the wall base during design life.
- Deep free water level.
- Loading:
- A non‐load‐bearing wall.
- No concern for seismic loads.
- Performance limit:
- Maximum permissible lateral movement of the wall face is 1% of wall height, i.e., Δmax = (6.0 m × 1,000 mm/m) (1%) = 60 mm.
- Facing:
- Dry‐stacked concrete blocks.
- Facing blocks: split face CMU block (0.2 m × 0.2 m × 0.4 m) with hollow cells; bulk unit weight, γb = 12.6 kN/m3 (80 lb/ft3).
- Friction coefficient between block and geosynthetics, tan δb = 0.4.
- Interface friction and adhesion between backface of block and backfill: ignored (for conservatism).
Design Computations:
Step 1: Establish wall profile and verify design assumptions
The cross‐section of the wall is shown in Figure 5.42. The conditions for non‐load‐bearing applications as listed at the beginning of Section 5.7 are verified, including fines content of reinforced backfill = 14% ≤ 20%, liquid limit = 10 ≤ 30, and plasticity index (PI) = 2 ≤ 6.
Step 2: Determine design parameters for reinforced fill, retained fill, and foundation
The values of the soil design parameters are:

Step 3: Determine forces acting on reinforced soil mass
The break in the slope is located within 2H from the back of the wall face, hence the broken crest can be converted into an equivalent sloping crest by following the procedure suggested by AASHTO (2002, 2014) (see Figure 5.37). The forces acting on the reinforced soil mass for external stability checks of the equivalent sloping crest are shown in Figure 5.43. The active Rankine earth pressure coefficient of the retained fill, KA = tan2 [45° – (35°/2)] = 0.27. The equivalent sloping crest is denoted by a dashed line in the figure. The angle of the equivalent sloping crest, β = tan–1 [h1/(2H)] = 16.3°.
Figure 5.43 Forces acting on the reinforced soil mass for external stability evaluation, Design Example 2 of the GRS‐NLB method (not to scale)
Step 4: Determine a tentative reinforcement length (for a GRS wall with a sloping crest)
A tentative reinforcement length (Lt) is determined by considering two failure modes: lateral sliding failure and eccentricity failure.
- Lateral sliding failure
Assume reinforcement length Lt = 0.5H = 0.5 (6.0 m) = 3.0 m. For a GRS wall of uniform reinforcement length, the safety factor against lateral sliding at the lowest layer of reinforcement is (Eqn. (5‐42)):
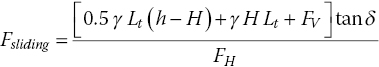
where h – H = Lt (tan β) = (3.0 m) (tan 16.3°) = 0.9 m, thus h = 6.9 m (see Figure 5.43). The resultant force exerted by the retained fill, Frf (inclined at β counterclockwise from the horizontal) is (Eqn. (5‐41)):
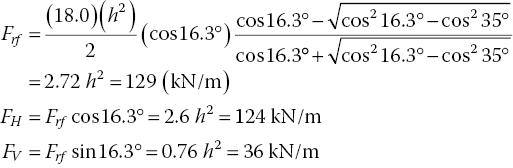
Hence,
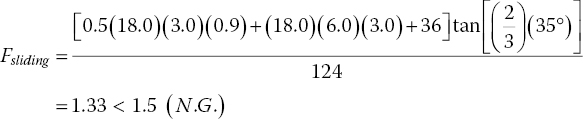
From trials that repeated the calculations with increasing value of Lt , or with the aid of a design spreadsheet, it was determined that Lt = 3.5 m would yield Fs = 1.5.
- Eccentricity failure
To check eccentricity (lift‐off) failure, the Lt as determined above is first used to calculate eccentricity e. For Lt = 3.5 m, h = H + Lt (tan β) = 6.0 + (3.5) (tan 16.3°) = 7.0 (m). Thus, W1 = (18.0)(6.0)(3.5) = 378 (kN/m), W2 = 0.5 (18.0)(3.5)(7.0 – 6.0) = 31.5 (kN/m), Frf = 2.72 ⋅ h2 = 2.72 (7.0)2 = 133 (kN/m), FH = Frf (cos 16.3°) = 128 (kN/m), and FV = Frf (sin 16.3°) = 37 (kN/m).
From Eqn. (5‐43),
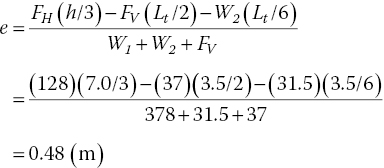
Since e = 0.48 m ≤ Lt/6 = 3.5/6 = 0.58 m (OK), thus Lt = 3.5 m remains unchanged.
Step 5: Check stability against foundation bearing failure
From Figure 5.38, for ϕf = 38°, bearing capacity factors are Nc = 65 and Nγ = 80
Vertical load = W1 + W2 + Fv = 378 + 31.5 + 37 = 446.5 (kN/m)
Horizontal load = FH = 128 kN/m
Angle of inclination for the resultant load, λ = tan–1 (128/446.5) = 16.0° (< ϕ = 35°)
Hence, iγ = (1 – λ/ϕ)2 = (1 – 16.0°/35°)2 = 0.29
-
-
ic = (1 – λ/90°)2 = (1 – 16.0°/90°)2 = 0.68 and eccentricity e = 0.48 m (from Step 4)
-
From Eqns. (5‐44) and (5‐46),
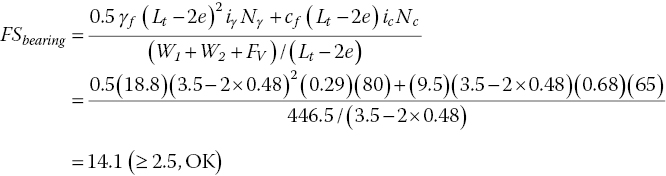
Step 6: Select vertical reinforcement spacing and block height
Uniform spacing of 0.2 m (sv = 0.2 m) is selected. The height of each facing block is to be 0.2 m also.
Step 7: Determine required tensile stiffness and strength for reinforcement
The confining stress of the reinforced soil mass, σc , is:
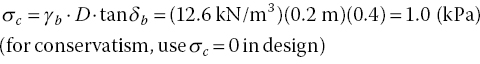
The maximum lateral stress, σh , at the wall base is
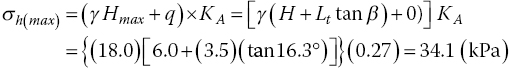
The required minimum reinforcement stiffness, T@ ε = 3.0%, in the direction perpendicular to the wall face, is:
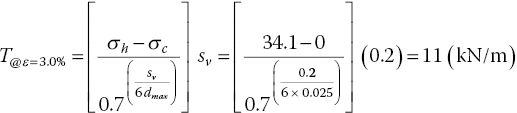
PI = 2 ≤ 3, thus Fdl = 3.5. The required minimum value of the ultimate reinforcement strength in the direction perpendicular to the wall face, Tult , is:
Also, the ductility strain of the selected reinforcement at Tult ( ≥ 38.5 kN/m) needs to be at least 5–7%.
Step 8: Select geosynthetic reinforcement
Select a geosynthetic product with tensile stiffness T@ ε = 3.0% ≥ 11 kN/m and tensile strength Tult ≥ 38.5 kN/m (at ε ≥ 5–7%), both in the direction perpendicular to the wall face. A woven polypropylene geotextile with MARV = 40 kN/m (at ε = 10%) and T@ ε = 3.0% = 12 kN/m is selected.
Step 9: Estimate lateral movement of wall face
The lateral movement of the wall face, Δi , at depth zi is:

The reinforcement stiffness, Kreinf is equal to T@ ε = 3.0%/(3%) = 12 kN/m/(3%) = 400 kN/m. Other parameters are: KA = 0.27, γ = 18.0 kN/m3, q = 0.5 γ Lt (tan β) = 0.5(18.0) (3.5)(tan 16.3°) = 9.2 (kN/m2), sv = 0.2 m, γb = 12.6 kN/m3, D = 0.2 m, tan δb = 0.4, H = 6.0 m, and ψ = 5°. The direct shear friction angle ϕds can be estimated as:
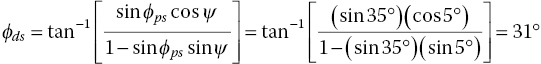
To account for facing batter,
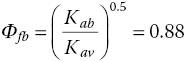
The term KA in the equation for calculating Δi is to be replaced by ![]() (as opposed to 0.27 for a vertical wall).
(as opposed to 0.27 for a vertical wall).
The lateral movement profile is shown in Figure 5.44. The maximum lateral movement is determined to be 24 mm, which is smaller than the specified performance limit of 60 mm. Note that a vertical wall without any batter would have sufficed.
Figure 5.44 Calculated lateral movement profile, Design Example 2 of the GRS‐NLB method
Step 10: Check stability against pullout failure
The pullout resisting force (Pri) and driving force (Pdi) for reinforcement layer‐i are (Eqns. (5‐61) and (5‐62)):
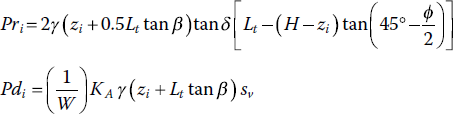
where 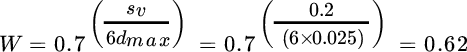 . The pullout resisting force and driving force for each layer of the wall are listed in Table 5.10.
Table 5.10 Resisting and driving forces for pullout of each reinforcement layer and corresponding group pullout safety factor, Lt = 3.5 m, Design Example 2
| zi (m) | Pri (kN/m) | Pdi (kN/m) | Fs(group) |
| 0.2 | 5.3 | 1.9 | 2.9 |
| 0.4 | 8.3 | 2.2 | 3.8 |
| 0.6 | 11.9 | 2.5 | 4.8 |
| 0.8 | 16.2 | 2.9 | 5.7 |
| 1.0 | 21.1 | 3.2 | 6.7 |
| 1.2 | 26.6 | 3.5 | 7.7 |
| 1.4 | 32.8 | 3.8 | 8.7 |
| 1.6 | 39.7 | 4.1 | 9.7 |
| 1.8 | 47.2 | 4.4 | 10.7 |
| 2.0 | 55.3 | 4.7 | 11.7 |
| 2.2 | 64.1 | 5.0 | 12.8 |
| 2.4 | 73.5 | 5.4 | 13.8 |
| 2.6 | 83.6 | 5.7 | 14.8 |
| 2.8 | 94.3 | 6.0 | 15.8 |
| 3.0 | 105.7 | 6.3 | 16.8 |
| 3.2 | 117.7 | 6.6 | 17.9 |
| 3.4 | 130.4 | 6.9 | 18.9 |
| 3.6 | 143.7 | 7.2 | 19.9 |
| 3.8 | 157.7 | 7.5 | 20.9 |
| 4.0 | 172.3 | 7.9 | 22.0 |
| 4.2 | 187.5 | 8.2 | 23.0 |
| 4.4 | 203.4 | 8.5 | 24.0 |
| 4.6 | 220.0 | 8.8 | 25.0 |
| 4.8 | 237.2 | 9.1 | 26.1 |
| 5.0 | 255.0 | 9.4 | 27.1 |
| 5.2 | 273.5 | 9.7 | 28.1 |
| 5.4 | 292.6 | 10.0 | 29.2 |
| 5.6 | 312.4 | 10.4 | 30.2 |
| 5.8 | 332.8 | 10.7 | 31.2 |
| 6.0 | 353.9 | 11.0 | 31.7 |
Note: The group safety factor against pullout is the sum of the resisting pullout forces of any consecutive three layers divided by the sum of the driving pullout forces of the same three layers. Note that there is no layer above the top layer (i.e., layer i–1 does not exist) or beneath the bottom layer (i.e., layer i+1 does not exist). The values of the non‐existent layers (i.e., Pri–1 and Pdi–1 for evaluation of the top layer, and Pri+1 and Pdi+1 for evaluation of the bottom layer) are taken as zero.
Using the rule of three, the group pullout safety factor for any three consecutive reinforcement layers with its mid‐layer located at depth zi can be determined as:
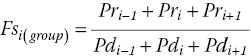
The group pullout safety factors at all depths are also listed in Table 5.10. The group safety factor of layer‐i is the safety factor with layer‐i being the mid‐layer of the group. It is seen that the group safety factors for all layers are greater than 1.5, therefore the tentative reinforcement length will stay unchanged.
Step 11: Check stability against rotational slide‐out failure
A limiting‐equilibrium based slope stability program (such as SLOPE‐W, STABL WV, or ReSSA) can be used to evaluate different modes of rotational stability (including overall slide‐out failure and compound failure). The analysis can be carried out with the following soil–geosynthetic composite strength parameters for the reinforced soil mass (because the cohesion of the soil is quite small, c = 0 is assumed):

If the smallest safety factor against any modes of rotational slide‐out failure is less than 1.3, the reinforcement length may be increased to raise the safety factor. Alternatively, if the critical rotational failure plane is passing through the foundation soil, a viable ground improvement technique may be employed to improve the strength of the foundation soil.
Step 12: Determine facing requirements
- Embedment: Since there is no concern for erosion or other untoward events surrounding the planned location of the wall base during the design life, the GRS wall is to be constructed with a nominal embedment of 0.1 m below the ground surface.
- Facing batter: The facing of the GRS wall is to have a batter of 1 (vertical) to 12 (horizontal); note that a vertical wall without a batter would suffice.
- Connection strength requirements: All facing blocks are to be dry‐stacked. Reinforcement is at every course of facing blocks and the reinforcement spacing is 0.2 m, hence connection stability is ensured (see Section 5.3.5). The top two courses of facing blocks are to be bonded by filling the hollow cells with concrete mix or mortar. To ensure facing stability under a sloping crest, the concrete mix may be reinforced with 0.2‐m long steel pins through the cores. All other facing blocks are to be dry‐stacked with their cells filled with compacted fill.
Design Summary for Reinforcement:
- Reinforcement length (uniform for all depths), L = 3.5 m. [Note: The reinforcement length is slightly less than that in Design Example 1 because the soil above the reinforced zone in this design example is a dead weight (i.e., always present). In Design Example 1, however, the traffic surcharge above the reinforced zone is not considered present for evaluation of resisting force.]
- Reinforcement spacing (same for all depths), sv = 0.2 m
- Reinforcement type: woven polypropylene with Tult = 40 kN/m (at ε = 10%) and T@ ε=3.0% = 12 kN/m
Given Conditions:
- General:
- Uniform wall height H = 6.0 m at the wall face, with 1 (vertical) to 10 (horizontal) face batter.
- Level ground and a level crest.
- Reinforcement lengths are truncated in the lower portion of the wall, with truncation inclining at approximately 45° from the horizontal ground surface.
- Backfill and retained fill:
- The backfill for the reinforced soil mass is a silty gravelly sand, with 12% (by weight) of fines; maximum particle size = 25 mm (1 in.); liquid limit, LL = 10; plasticity index, PI = 2; moist unit weight, γ = 18.0 kN/m3; cohesion, c = 5 kPa; internal friction angle at peak strength, ϕ = 35°; and angle of dilation, ψ = 5°.
- Same soil for the backfill in reinforced zone and retained fill (the soil behind the reinforced zone) with similar placement density and moisture.
- Surface runoff and subsurface drainage are to be provided properly.
- Foundation soil:
- The foundation soil is a heavily overconsolidated clay, uniform up to 10 m below the ground surface, and moist unit weight, γf = 18.8 kN/m3; cohesion, cf = 9.5 kPa; and angle of internal friction, ϕf = 30°.
- There is no concern for erosion or other untoward events surrounding the planned location of the wall base during design life.
- Deep free water level.
- Loading:
- A non‐load‐bearing wall, with common traffic loads only (an equivalent vertical surcharge, q = 12 kPa).
- No concern for seismic loads.
- Performance limit:
- Maximum permissible lateral movement of wall face is 1% of the wall height, i.e., Δmax = (6.0 m × 1,000 mm/m) (1%) = 60 mm.
- Facing:
- Dry‐stacked concrete blocks.
- Facing blocks: split face CMU block (0.2 m × 0.2 m × 0.4 m) with hollow cells; bulk unit weight, γb = 12.6 kN/m3 (80 lb/ft3).
- Friction coefficient between block and geosynthetics, tan δ = 0.4.
- Interface friction and adhesion between backface of block and backfill: ignored for conservatism.
Design Computations:
Step 1: Establish wall profile and check design assumptions
The cross‐section of the wall is depicted in Figure 5.45. The conditions for non‐load‐bearing applications as listed at the beginning of Section 5.7 are verified, including fines content of reinforced backfill = 12% ≤ 20%, liquid limit = 10 ≤ 30, and plasticity index (PI) = 2 ≤ 6.
Step 2: Determine design parameters for reinforced fill, retained fill, and foundation
The values of the soil parameters needed for the design are:
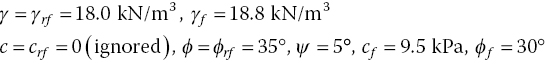
Step 3: Determine forces acting on reinforced soil mass
With a trial reinforcement length of 0.5H (L = 0.5H = 3.0 m) in the upper portion of the wall and a trial reinforcement length at the base is set equal to 0.3H (LB = 0.3H = 1.8 m), the forces acting on the reinforced soil mass of the GRS wall for external stability checks are as shown in Figure 5.46. Note that the active Rankine state can be mobilized in the zone of retained fill (see Section 2.4), hence the lateral earth pressure in the retained fill above the truncated zone is assumed to be in the Rankine active state. The active Rankine earth pressure coefficient of the retained fill, KA = tan2 [45° – (35°/2)] = 0.27.
Figure 5.46 Forces acting on the reinforced soil mass for external stability checks, Design Example 3 of the GRS‐NLB method
Step 4: Determine a tentative reinforcement length (for a GRS wall with a level crest)
A tentative reinforcement length is obtained by considering two failure modes: lateral sliding failure and eccentricity failure.
- Lateral sliding failure
- For the assumed reinforcement length L = 0.5H = 3.0 m, and reinforcement length at base = 0.3H = 1.8 m (an initial trial),

- Driving force for sliding = F1 + F2 = 56 + 16 = 72 (kN/m)
- Factor of safety against lateral sliding FSsliding = 134/72 = 1.9 > 1.5 (OK)
- Eccentricity failure
To check eccentricity failure (i.e., lift‐off at wall base), the tentative reinforcement length can be used for calculation of resultant forces and bending moment at the base of the reinforced soil mass. The calculation can be performed by treating the wall base as a projected horizontal plane, in the same way as for a wall without base‐truncation, except the stabilizing force due to soil weight is now reduced due to truncation. The calculation of the resultant forces and bending moment on the projected wall base for L = 3.0 m and LB = 1.8 m is shown in Figure 5.47.
The eccentricity of the resultant force RV due to the bending moment (M) is
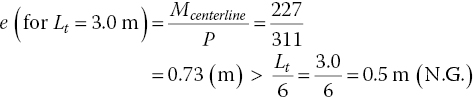
The initial trial tentative reinforcement length of Lt = 0.3 m (i.e., 0.5H) needs to be increased. A new trial reinforcement length of Lt = 0.36 m (or 0.6H) is selected. Using the same procedure illustrated in Figure 5.47, the new eccentricity becomes
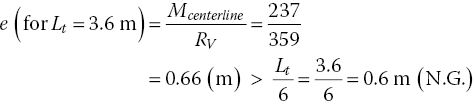
The tentative reinforcement length of Lt = 0.36 m (or 0.6H) still fails the eccentricity criterion of e ≤ Lt/6, therefore Lt needs to be increased further. Lt = 3.9 m (or 0.65H) is subsequently tried. Using the same procedure shown in Figure 5.47, the eccentricity for Lt = 3.9 m (or 0.65H) is
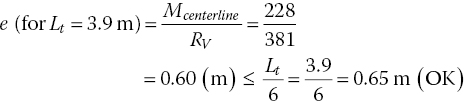
Therefore, reinforcement length Lt = 3.9 m (with LB = 0.18 m) is adopted. Lateral sliding failure is re‐calculated as follows to ensure Lt = 3.9 m is acceptable.
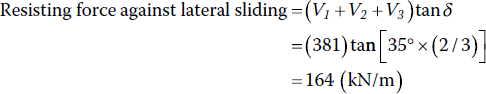
- Driving force for sliding = F1 + F2 = 37 + 13 = 50 (kN/m)
- Factor of safety against lateral sliding FSsliding = 164/50 = 3.3 > 1.5 (OK)
Figure 5.47 Resultant forces and moment on the base of reinforced soil mass, Design Example 3 of the GRS‐NLB method
Step 5: Check stability against foundation bearing failure
- Foundation soil: cf = 9.5 kPa and ϕ = 30°; from Figure 5.38, for ϕf = 30°, the bearing capacity factors are Nc = 30 and Nγ = 18
- Vertical load = Rv = V1 + V2 +V3 = 381 kN/m
- Horizontal load = F1 + F2 = 50 kN/m
- Angle of inclination for the resultant load with the vertical plane,
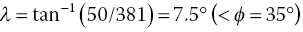
- hence,

-

- Average base pressure, σv = Rv/(Lt – 2e) = 381/(3.9 – 2 × 0.6) = 141.1 kN/m2
The safety factor against bearing capacity failure, FSbearing , is (Eqns. (5‐44) and (5‐45))
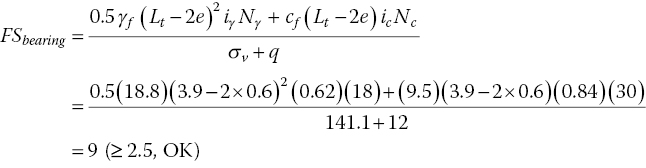
Step 6: Select vertical reinforcement spacing and block height
Uniform spacing of 0.2 m (sv = 0.2 m) is selected. The height of each facing block is also to be 0.2 m.
Step 7: Determine required tensile stiffness and strength for reinforcement
The confining stress of the reinforced soil mass (σc) is:

The maximum lateral stress (σh) is:
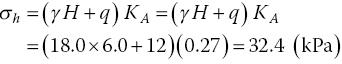
The required minimum reinforcement stiffness, T@ ε = 3.0%, in the direction perpendicular to the wall face is:
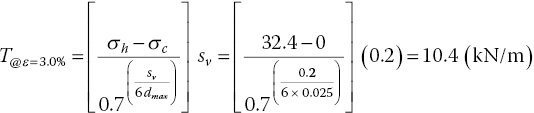
PI = 2 ≤ 3, thus the ductility and long‐term factor, Fdl = 3.5. The required minimum value of ultimate reinforcement strength in the direction perpendicular to the wall face, Tult , is:
Also, the ductility strain corresponding to Tult ( ≥ 36.4 kN/m) of the selected reinforcement needs to be at least 5–7%.
Step 8: Select geosynthetic reinforcement
Select a geosynthetic product with tensile stiffness T@ ε = 3.0% ≥ 10.4 kN/m and tensile strength Tult ≥ 36.4 kN/m, both in the direction perpendicular to the wall face. A nonwoven polypropylene geotextile with MARV = 38 kN/m (at ε = 10%), and T@ ε = 3.0% = 12 kN/m is selected.
Step 9: Estimate lateral movement of wall face
Studies have suggested that for walls constructed with well‐compacted free‐draining granular backfill and over a firm foundation, there is not a significant difference between truncated‐base walls and full‐length walls in terms of lateral displacement of the wall face. Compared to a wall with full‐length reinforcement, a truncated‐base wall generally has slightly larger movement in the lower portion of the wall, and slightly smaller movement in the upper portion of the wall. The maximum deflection of a truncated‐base wall is typically about 10% greater than that of a full‐length reinforcement wall.
The lateral movement at the wall face, Δi , of a truncated‐base wall at depth zi is:
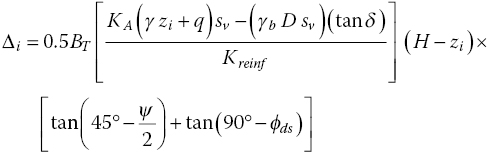
The reinforcement stiffness, Kreinf is equal to T@ ε = 3.0%/(3%) = 12 kN/m/(3%) =400 kN/m. The values of the other parameters are: KA = 0.27, γ = 18.0 kN/m3, q = 12 kN/m2, sv = 0.2 m, γb = 12.6 kN/m3, D = 0.2 m, tan δ = 0.4, H = 6.0 m, ψ = 5°, and BT = 1.0 for zi < H/2, BT = 1.1 for zi ≥ H/2. The direct shear friction angle ϕds can be estimated as:
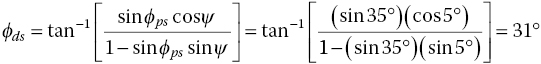
To account for face batter,
The term KA in the equation for calculating Δi is to be replaced by ![]() .
.
The lateral movement profile is depicted in Figure 5.48. Note that the 10% correction of the calculated movement due to base truncation is made for the lower half of the wall, therefore the deflection profile contains a kink near the mid‐height. A “reasoned” deflection profile near the kink is shown by a dotted line in Figure 5.48. The maximum lateral movement is found to be 27 mm, which is smaller than the specified performance limit of 60 mm. Note that a vertical wall without batter would suffice also.
Figure 5.48 Calculated lateral movement profile, Design Example 3 of the GRS‐NLB method (Note: The kink near mid‐height is due to correction for base truncation)
Step 10: Check stability against pullout failure
The pullout resisting force (Pri) and driving force (Pdi) for reinforcement layer‐i are:
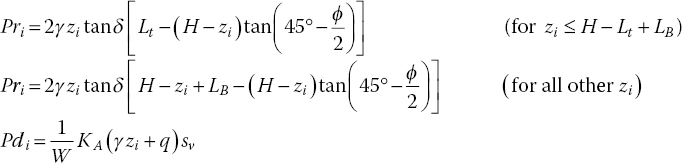
where 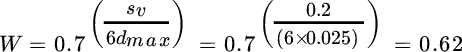 . Note that surcharge q appears only in the equation for driving force, Pdi (see Figure 5.36(a)). The pullout resisting force and driving force for each layer are listed in Table 5.11.
Table 5.11 Resisting and driving forces for pullout of each reinforcement layer and corresponding group pullout safety factor for LB = 1.8 m and Lt = 3.9 m, Design Example 3
| zi (m) | Pri (kN/m) | Pdi (kN/m) | Fs(group) |
| 0.2 | 2.7 | 2.1 | 2.5 |
| 0.4 | 6.1 | 2.4 | 2.6 |
| 0.6 | 10.1 | 2.7 | 3.8 |
| 0.8 | 14.8 | 3.0 | 5.0 |
| 1.0 | 20.1 | 3.3 | 6.1 |
| 1.2 | 26.1 | 3.7 | 7.2 |
| 1.4 | 32.7 | 4.0 | 8.3 |
| 1.6 | 40.0 | 4.3 | 9.4 |
| 1.8 | 47.9 | 4.6 | 10.5 |
| 2.0 | 56.5 | 4.9 | 11.5 |
| 2.2 | 65.7 | 5.2 | 12.6 |
| 2.4 | 75.5 | 5.5 | 13.7 |
| 2.6 | 86.0 | 5.8 | 14.7 |
| 2.8 | 97.1 | 6.2 | 15.8 |
| 3.0 | 108.9 | 6.5 | 16.9 |
| 3.2 | 121.4 | 6.8 | 17.9 |
| 3.4 | 134.5 | 7.1 | 19.0 |
| 3.6 | 148.2 | 7.4 | 20.0 |
| 3.8 | 162.6 | 7.7 | 20.8 |
| 4.0 | 171.4 | 8.0 | 21.0 |
| 4.2 | 173.7 | 8.4 | 20.8 |
| 4.4 | 175.4 | 8.7 | 20.2 |
| 4.6 | 176.5 | 9.0 | 19.6 |
| 4.8 | 177.1 | 9.3 | 19.0 |
| 5.0 | 177.0 | 9.6 | 18.4 |
| 5.2 | 176.3 | 9.9 | 17.8 |
| 5.4 | 175.1 | 10.2 | 17.1 |
| 5.6 | 173.2 | 10.5 | 16.4 |
| 5.8 | 170.8 | 10.9 | 15.7 |
| 6.0 | 167.7 | 11.2 | 15.4 |
Note: The group safety factor against pullout is the sum of the resisting pullout forces of any consecutive three layers divided by the sum of driving pullout forces of the same three layers. Note that there is no layer above the top layer (i.e., layer i–1 does not exist) or beneath the bottom layer (i.e., layer i+1 does not exist). The values of the non‐existent layers (i.e., Pri–1 and Pdi–1 for evaluation of the top layer, and Pri+1 and Pdi+1 for evaluation of the bottom layer) are taken as zero.
Using the rule of three, i.e., the group pullout safety factor for any three consecutive reinforcement layers with its mid‐layer located at depth zi can be determined as:
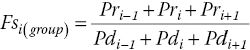
The group pullout safety factors for all reinforcement layers of the wall are also listed in Table 5.11. The group safety factor of layer‐i is the safety factor with layer‐i as the mid‐layer of the group. It is seen that the group safety factors at all depths for LB = 1.8 m and Lt = 3.9 m are greater than 1.5. The layout of reinforcement length is as follows: reinforcement length in the truncated zone is 1.8 m at the base, the length is to increase linearly to 3.9 m at 2.1 m from the base. The reinforcement in the non‐truncated zone is a uniform length of 3.9 m.
Step 11: Check stability against rotational slide‐out failure
A limiting‐equilibrium based slope stability program (such as SLOPE‐W, STABL WV, or ReSSA) can be used to analyze the stability against different modes of rotational failure (including overall slide‐out failure and compound failure). The analysis can be carried out with the reinforced soil mass having the following soil–geosynthetic composite strength parameters (because the cohesion of the soil is quite small, c = 0 is assumed):
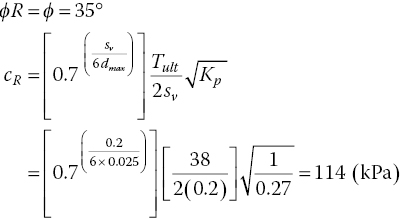
If the smallest safety factor against any modes of rotational slide‐out failure is less than 1.3, the reinforcement length may be increased to raise the safety factor. Alternatively, if the critical rotational failure plane is passing through the foundation soil, a viable ground improvement technique may be employed to improve the strength of the foundation soil and raise the safety factor.
Step 12: Determine facing requirements
- Embedment: Considering that there is no concern for erosion or other untoward events surrounding the planned location of wall base during the design life, the GRS wall is to be constructed with a nominal embedment of 0.1 m below the ground surface.
- Facing batter: The facing of the GRS wall is to have a face batter of 1 (horizontal) to 10 (vertical). Note that a vertical wall without any batter will also suffice.
- Connection strength requirements: All facing blocks are to be dry‐stacked. Reinforcement is at every course of facing blocks and reinforcement spacing is 0.2 m, hence connection stability is ensured. The top two courses of facing blocks are to be bonded by filling the hollow cells with concrete mix. All other facing blocks are to be dry‐stacked with their core filled with compacted fill.
Design Summary for Reinforcement:
- Reinforcement lengths at base, LB = 1.8 m, increasing linearly to 3.9 m at 2.1 m above the base, and a uniform length of 3.9 m for all layers above 2.1 m from the base
- Reinforcement spacing (same for all depths), sv = 0.2 m
- Reinforcement type: woven polypropylene with Tult = 38 kN/m (at ε = 10%) and T@ ε=3.0% = 12 kN/m
References
- Abu‐Hejleh, N., Wang, T., and Zornberg, J.G. (2000). Performance of Geosynthetic‐Reinforced Walls Supporting Bridge and Approaching Roadway Structures. ASCE Geotechnical Special Publication No. 103, Advances in Transportation and Geoenvironmental Systems using Geosynthetics, pp. 218–243.
- Adams, M.T., Lillis, C.P., Wu, J.T.H., and Ketchart, K. (2002). Vegas Mini Pier Experiment and Postulate of Zero Volume Change. Proceedings, 7th International Conference on Geosynthetics, Nice, France, pp. 389–394.
- Adams, M.T., Schlatter, W., and Stabile, T. (2007). Geosynthetic‐Reinforced Soil Integrated Abutments at the Bowman Road Bridge in Defiance County, Ohio. Proceedings, Geo‐Denver 2007, ASCE, Denver, Colorado.
- Adams, M.T., Nicks, J., Stabile, T., Wu, J.T.H., Schlatter, W., and Hartmann, J. (2011a). Geosynthetic Reinforced Soil Integrated Bridge System Interim Implementation Guide. Report No. FHWA‐HRT‐11‐026, Federal Highway Administration, McLean, Virginia.
- Adams, M.T., Nicks, J., Stabile, T., Wu, J.T.H., Schlatter, W., and Hartmann, J. (2011b). Geosynthetic Reinforced Soil Integrated Bridge System Synthesis Report. Report No. FHWA‐HRT‐11‐027, Federal Highway Administration, McLean, Virginia.
- Allen, T.M. and Bathurst, R.J. (1996). Combined Allowable Strength Reduction Factor for Geosynthetic Creep and Installation Damage. Geosynthetics International, 3(3), 407–439.
- Allen, T. M. and Bathurst, R.J. (2001). Application of the K0‐Stiffness Method to Reinforced Soil Wall Limit State Design. Report No. WA‐RD 528.1, Research Report, Washington State Department of Transportation.
- Allen, T.M. and Bathurst, R.J. (2003). Prediction of Reinforcement Loads in Reinforced Soil Walls. Final Research Report, Washington State Department of Transportation and Federal Highway Administration, 290 pp.
- Allen, T. M., Bathurst, R. J., Holtz, R. D., Lee, W. F., and Walters, D. L. (2004). New Method for Prediction of Loads in Steel Reinforced Soil Walls. Journal of Geotechnical & Geoenvironmental Engineering, ASCE, Eng., 10.1061/(ASCE)1090‐0241(2004)130:11(1109), pp. 1109–1120.
- AASHTO (2002). Standard Specifications for Highway Bridges, 17th edition. American Association of State Highway and Transportation Officials, Washington, D.C.
- AASHTO (2014). LRFD Bridge Design Specifications, 7th edition with 2016 Interims. American Association of State Highway and Transportation Officials, Washington, D.C.
- Ballegeer, J. and Wu, J.T.H. (1993). Intrinsic Load‐Deformation Properties of Geotextiles. Geosynthetic Soil Reinforcement Testing Procedures, ASTM STP 1190, American Society for Testing and Materials, pp. 16–31.
- Barreire, W. and Wu, J.T.H. (2001). Guidelines for Design and Construction of Reinforced Soil Foundations. Research Report, Department of Civil Engineering, University of Colorado Denver, 109 pp.
- Bastick, M.J. (1990). Reinforced Earth Narrow Walls and Abutments Correlation of Measured Performance with Design. In Performance of Reinforced Soil Structures, McGowan, Yeo, and Andrawes (eds.). British Geotechnical Society, Glasgow, pp. 59–63.
- Bathurst, R.J., Vlachopoulos, N., Walters, D.L., Burgess, P.G., and Allen, T.M. (2006). The Influence of Facing Stiffness on the Performance of Two Geosynthetic Reinforced Retaining Walls. Canadian Geotechnical Journal, 43(12), 1225–1237.
- Bathurst, R.J., Miyata, Y., Nernheim, A., and Allen, A.M. (2008). Refinement of K‐stiffness Method for Geosynthetic Reinforced Soil Walls. Geosynthetics International, 15(4), 269–295.
- Beauregard, M.S. (2016). Facing of Geosynthetic Reinforced Soil Structures. Doctoral dissertation, College of Engineering and Applied Science, University of Colorado Denver.
- Berg, R.R. (2010). Fill Walls – Recent Advances and Future Trends. Proceedings, Earth Retention Conference. ASCE, Bellevue, Washington, pp. 1–19.
- Berg, R.R. Christopher, B.R., and Samtani, N.C. (2009). Design of Mechanically Stabilized Earth Walls and Reinforced Soil Slopes, Design & Construction Guidelines. Report No. FHWA‐NHI‐00‐043. Federal Highway Administration, 394 pp.
- Bonaparte, R., Holtz, R.D., and Giroud, J.P. (1987). Soil Reinforcement Design using Geotextiles and Geogrids, Fluet (ed.). Geotextile Testing and the Design Engineer, ASTM STP 952, American Society for Testing and Materials, Philadelphia, Pennsylvania, pp. 69–116.
- Brandl, H. (1998). Multi‐anchored Soil Retaining Walls with Geosynthetic Loop Anchors. Proceedings, 6th International Conference on Geosynthetics, Atlanta, Georgia, Volume 2. Industrial Fabrics Association International (IFAI), pp. 581–586.
- Broms, B.B. (1978). Design of fabric reinforced retaining structures. Proceedings, Symposium on Earth Reinforcement. ASCE, Pittsburgh, Pennsylvania, pp. 282. [Summarized in Reinforcement of Earth Slopes and Embankments, National Cooperative Highway Research Program (NCHRP) Report 290 (1987).]
- BSI (1995). Code of Practice for Strengthened/Reinforced Soils and Other Fills. BS8006. Amended 1999. British Standards Institution, 161 pp.
- Chew, S.H. and Mitchell, J.K. (1994). Deformation Evaluation Procedure for Reinforced Walls. Proceedings, 5th International Conference on Geotextiles, Geomembranes and related Products, Singapore.
- Chew, S.H., Schmertmann, G.R., and Mitchell, J.K. (1991). Reinforced Soil Wall Deformations by Finite Element Method. In Performance of Reinforced Soil Structures, McGowan, Yeo, and Andrawes (eds.). British Geotechnical Society, Glasgow, pp. 35–40.
- Chou, N.N.S. and Wu, J.T.H. (1993). Investigating Performance of Geosynthetic‐Reinforced Soil Walls. Report No. CDOT‐DTD‐93‐21, Colorado Department of Transportation, 197 pp.
- Christopher, B.R., Gill, S.A., Giroud, J.P, Juran, I., Scholesser, F., Mitchell, J.K., and Dunnicliff J. (1990). Reinforced Soil Structures, Volume 1: Design and Construction Guidelines. Publication No. FHWA‐RD‐89‐043, Federal Highway Administration, Washington, D.C.
- Claybourn, A.F. (1990). A Comparison of Methods for Geosynthetic‐Reinforced Earth Walls. M.S. Thesis, Department of Civil Engineering, University of Colorado Denver.
- Claybourn, A.F. and Wu, J.T.H. (1992). Failure Loads of the Denver Walls by Current Design Methods. International Symposium on Geosynthetic‐Reinforced Soil Retaining Walls, A.A. Balkema, Rotterdam, pp. 61–77.
- Claybourn, A.F. and Wu, J.T.H. (1993). Geosynthetic‐Reinforced Soil Wall Design. Geotextiles and Geomembranes, Journal of International Geotextile Society, 12(8), 707–724.
- Collin, J.G. (1986). Earth Wall Design. Doctoral dissertation, Department of Civil Engineering, University of California, Berkeley.
- Crouse, P. and Wu, J.T.H. (2003). Geosynthetic‐Reinforced Soil (GRS) Walls. Journal of Transportation Research Board, 1849, 53–58.
- Dallaire, G. (2001). Segmental Retaining Walls Come of Age. Erosion Control, Journal of the International Erosion Control Association, November–December.
- Elias, V. (2000). Long‐Term Durability of Geosynthetics Based on Exhumed Samples from Construction Projects. FHWA Report No. FHWA RD‐00‐157, 53 pp.
- Elias, V., Christopher, B.R., and Berg, R.R. (2001). Mechanically Stabilized Earth Walls and Reinforced Soil Slopes Design and Construction Guidelines. NHI Course 132042, FHWA NHI‐00‐043, 394 pp.
- Elton, D.J. and Patawaran, M.A.B. (2005). Mechanically Stabilized Earth (MSE) Reinforcement Tensile Strength from Tests of Geotextile Reinforced Soil. Technical Report, Alabama Highway Research Center, Auburn University.
- Fukuoka, M., Imamura, Y., and Nishimura, J. (1986). Fabric Faced Retaining Wall with Multiple Anchors. Geotextile and Geomembranes, 4, 207–221.
- GEO (2002). Guide to Reinforced Fill Structure and Slope Design, Draft. Geoguide 6. Civil Engineering Department, Geotechnical Engineering Office, Government of the Hong Kong Special Administrative Region, 240 pp.
- Gerber, T.M. (2012). Assessing the Long‐Term Performance of Mechanically Stabilized Earth Walls. NCHRP Synthesis 437, National Cooperative Highway Research Program, Transportation Research Board, Washington, D.C.
- Giroud, J.P. (1989). Geotextile engineering workshop – design examples. Publication No. FHWA‐HI‐89‐CO2, Federal Highway Administration, Washington, DC.
- Greenwood, J.H. (2002). The Effect of Installation Damage on the Long‐Term Strength Design Strength of a Reinforcing Geosynthetic. Geosynthetics International, 9(3), 247–258.
- Hatami, K. and Bathurst, R.J. (2005). Development and Verification of a Numerical Model for the Analysis of Geosynthetic Reinforced Soil Segmental Walls. Canadian Geotechnical Journal, 42(4), 1066–1085.
- Hatami, K. and Bathurst, R.J. (2006). Numerical Model for Reinforced Soil Segmental Walls under Surcharge Loading. Journal of Geotechnical and Geoenvironmental Engineering, ASCE, 132(6), 673–684.
- Helwany, S., Reardon, G., and Wu, J.T.H. (1999). Effects of Backfill on the Performance of GRS Retaining Walls. Geotextiles and Geomembranes, 17(1), 1–16.
- Helwany, S., Wu, J.T.H., and Meinholz, P. (2012). Seismic Design of Geosynthetic‐Reinforced Soil Bridge Abutments with Modular Block Facing. NCHRP Web‐Only Document 187, 251 pp.
- Holtz, R.D. (2010). Reinforced Soil Technology: from Experimental to the Familiar. Terzaghi Lecture, GeoFlorida, Palm Beach.
- Holtz, R.D., Kovacs, W.D., and Sheahan, T.C. (2011). An Introduction to Geotechnical Engineering, 2nd edition. Prentice Hall, New Jersey.
- Hufenus, R., Ruegger, R., Flum, D., and Sterba, I.J. (2005). Strength Reduction due to Installation Damage of Reinforcing Geosynthetics. Geotextiles and Geomembranes, 23(5), 401–424.
- Iwamoto, M.K., Ooi, P.S.K., Adams, M.T., and Nicks, J.E. (2015). Composite Properties from Instrumented Load Tests on Mini‐Piers Reinforced with Geotextiles. Geotechnical Testing Journal, 38(4), 397–408.
- Jewell, R.A. and Milligan, G.W. (1989). Deformation Calculation for Reinforced Soil Walls. Proceedings, 12th International Conference on Soil Mechanics and Foundation Engineering, Volume 2, pp. 1259–1262.
- Ketchart, K. and Wu, J.T.H. (2001). Performance Test for Geosynthetic‐Reinforced Soil including Effects of Preloading. Report No. FHWA‐RD‐01‐018, Federal Highway Administration, 270 pp.
- Ketchart, K. and Wu, J.T.H. (2002). A Modified Soil‐Geosynthetic Interactive Performance Test for Evaluating Deformation Behavior of GRS Structures. ASTM Geotechnical Testing Journal, 25(4), 405–413.
- Koerner, R.M. (2005). Designing with Geosynthetics, 5th edition. Prentice Hall, New Jersey, 816 pp.
- Koerner, R.M. and Koerner, G.R. (2013). A Data Base, Statistics and Recommendations Regarding 171 Failed Geosynthetic reinforced mechanically stabilized earth (MSE) walls. Geotextiles and Geomembranes, 40(October), 20–27.
- Lawson, C.R. and Yee, T.W. (2005). Reinforced soil retaining walls with constrained reinforced fill zones. In Geo‐Frontiers 2005, ASCE Geotechnical Special Publication 140: Slopes and Retaining Structures under Seismic and Static Conditions.
- Lee, K., Jones, C.J.F.P., Sullivan, W.R., and Trolinger, W. (1994). Failure and Deformation of Four Reinforced Soil Walls in Eastern Tennessee. Géotechnique, 4(3), 397–426.
- Leshchinsky, D. and Perry, E.B. (1987). A Design Procedure for Geotextile‐Reinforced Walls. Proceedings, Geosynthetics ‘87 Conference, Volume 1, New Orleans, pp. 95–107.
- Lin, C.C., Hsieh, T.J., Tsao, W.H., and Wang, Y.H. (1997). Combining Multi‐Nailings with Soil Reinforcement for Construction. In Mechanically Stabilized Backfill, Wu (ed.).A.A. Balkema, Rotterdam, pp. 255–257.
- Ling, H.I. and Leshchinsky, D. (2003). Finite Element Parametric Study of the Behavior of Segmental Block Reinforced Soil Retaining Walls. Geosynthetics International, 10(3), 77–94.
- Ling, H., Wu, J.T.H., and Tatsuoka, F. (1992). Short‐Term Strength and Deformation Characteristics of Geotextiles under Typical Operational Conditions. Geotextiles and Geomembranes, 11(2), 185–219.
- Liu, H. (2012). Long‐term Lateral Displacement of Geosynthetic Reinforced Soil Segmental Retaining Walls. Geotextiles and Geomembranes, 32, 18–27.
- Macklin, P.M. (1994). A Comparison of Five Methods for Calculation Lateral Deformation of Geosynthetic‐Reinforced Soil (GRS) walls. M.S. Report, Department of Civil Engineering, University of Colorado Denver.
- Meyerhof, G.G. (1963). Some Recent Research on the Bearing Capacity of Foundations. Canadian Geotechnical Journal, 1(1), 16–26.
- Mitchell, J.K. and Villet, W.C.B. (1987). Reinforcement of Earth Slopes and Embankments. NCHRP Report 290, Transportation Research Board, Washington, D.C., 323 pp.
- Morishima, H., Saruya, K., and Aizawa, F. (2005). Damage to soils structures of railway and their reconstruction. Special Issue on Lessons from the 2004 Niigata‐ken Chu‐Etsu Earthquake and Reconstruction, Foundation Engineering and Equipment (Kiso‐ko), October, pp. 78–83 (in Japanese).
- Morrison, K.F., Harrison, F.E., Collin, J.G., Dodds, A., and Arndt, B. (2006). Shored Mechanical Stabilized Earth (SMSE) Wall Systems Design Guidelines. Central Federal Lands Highway Division, FHWA Report No. FHWA‐CFL/TD‐06‐001, 230 pp.
- NAVFAC (1986). Design Manual 7.02 Foundations and Earth Structures. Bureau of Yards and Docks, U.S. Navy.
- NCMA (2010). Design Manual for Segmental Retaining Walls, 3rd edition, Collin (ed.). National Concrete Masonry Association, 206 pp.
- Perloff, W.H. (1975). Pressure Distribution and Settlement. Chapter 4 in Foundation Engineering Handbook, Winterkorn and Fang (eds.). Van Nostrand Reinhold, New York, pp. 148–196.
- Perloff, W.H. and Baron, W. (1976). Soil Mechanics Principles and Applications. John Wiley & Sons, New York, 745 pp.
- Pham, T.Q. (2009). Investigating Composite Behavior of Geosynthetic‐Reinforced Soil (GRS) Mass. Doctoral Dissertation, Department of Civil Engineering, University of Colorado Denver.
- Poulos, H.G. (2000). Foundation Settlement Analysis–Practice versus Research. The Eighth Spencer J. Buchanan Lecture, Texas A&M University.
- Rowe, R.K. and Ho, S.K. (1993). A Review of the Behavior of Reinforced Soil Walls. In Earth Reinforcement Practice, Volume 2, Ochiai, Hayashi, and Otani (eds.). Proceedings, International Symposium on Earth Reinforcement Practice, Fukuoka, Kyushu, Japan, A.A. Balkema, Rotterdam, pp. 801–830.
- Saghebfar, M., Abu‐Farsakh, M., Ardah, A., Chen, Q., and Fernandez, B.A. (2017). Performance monitoring of Geosynthetic Reinforced Soil Integrated Bridge System (GRS–IBS) in Louisiana. Geotextiles and Geomembranes, 45, 34–47.
- Schlosser, F. and Segrestin, P. (1979). Local Stability Analysis Method of Design of Reinforced Earth Structures. Proceedings, International Conference on Soil Reinforcement, Volume 1, Paris, France, pp. 157–162 (in French).
- Schmertmann, G.R., Chouery‐Curtis, V.E., Johnson, R.D., and Bonaparte, R. (1987). Design Charts for Geogrid‐Reinforced Soil Slopes. Proceedings, Geosynthetics '87 Conference, Volume 1, New Orleans, pp. 108–120.
- Segrestin, P. (1994). GRS Structures with Short Reinforcements and Rigid Facing – Discussion of Previous Papers Published by Prof. F. Tatsuoka, M. Tateyama and O. Murata. In Proceedings, Recent Case Histories of Permanent Geosynthetic‐Reinforced Soil Retaining Walls. Tatsuoka and Leshchinsky (eds.). A.A. Balkema, Rotterdam, pp. 323–342.
- Smith, G.N. and Pole, E.L. (1980). Elements of Foundation Design. Granada Publishing, London, 222 pp.
- Steward, J. E., Williamson, R., and Mohney, J. (1977, revised 1983). Earth Reinforcement. Chapter 5 in Guidelines for Use of Fabrics in Construction and Maintenance of Low‐Volume Roads. U.S. Department of Agriculture, Forest Service, Portland, Oregon.
- Tatsuoka, F. (1992). Roles of Facing Rigidity in Soil Reinforcing. In Earth Reinforcement Practice, Ochiai, Hayashi, and Otani (eds.). A.A. Balkema, Rotterdam, pp. 831–867.
- Tatsuoka, F. (2008). Recent Practice and Research of Geosynthetic‐Reinforced Earth Structures in Japan. Journal of GeoEngineering, 3(3), 77–100.
- Tatsuoka, F., Murata, O., and Tateyama, M. (1992). Permanent Geosynthetic‐Reinforced Soil Retaining Walls Used for Railway Embankments in Japan. In Geosynthetic‐Reinforced Soil Retaining Walls, Denver, Colorado, 8–9 August 1991, Wu (ed.). A.A. Balkema, Rotterdam, pp. 101–130.
- Tatsuoka, F., Tateyama, M., Uchimura, T., and Koseki, J. (1997). Geosynthetic‐reinforced Soil Retaining Walls as Important Permanent Structures. In Mechanically‐Stabilized Backfill, Wu (ed.). A.A. Balkema, Rotterdam, pp. 3–24.
- Tatsuoka, F., Tateyama, M., Aoki, H. and Watanabe, K. (2005). Bridge abutment made of cement‐mixed gravel backfill. In Ground Improvement, Case Histories, Elsevier Geo‐Engineering Book Series, Volume 3, Indradratna and Chu (eds.). Elsevier, pp. 829–873.
- Terzaghi, K., Peck, R.B., and Mesri, G. (1996). Soil Mechanics in Engineering Practice, 3rd edition. Wiley, New York.
- Thomas, D. and Wu, J.T.H. (2000). Analysis of Geosynthetic‐reinforced Soil Walls with a Truncated Base. Technical Report, Department of Civil Engineering, University of Colorado Denver, 191 pp.
- TRB (1996). Landslides. Special Report 247, Transportation Research Board, National Research Council, Washington, D.C., 673 pp.
- Valentine, R.J. (2013). An Assessment of the Factors that Contribute to the Poor Performance of Geosynthetic‐Reinforced Earth Retaining Walls. In Design and Practice of Geosynthetic‐Reinforced Soil Structures, Ling et al. (eds.). DEStech Publications, Bologna, pp. 318–327.
- Vulova, C. (2000). Effects of Geosynthetic Reinforcement Spacing on the Behavior of Mechanically Stabilized Earth Walls. Ph.D. Dissertation, Department of Civil Engineering, University of Delaware.
- Vulova, C. and Leshchinsky, D. (2003). Effects of Geosynthetic Reinforcement Spacing on the Behavior of Mechanically Stabilized Earth Walls. FHWA Report No. FHWA‐RD‐03‐048, 226 pp.
- Wu, J.T.H. (1991). Measuring Inherent Load‐Extension Properties of Geotextiles for Design of Reinforced Structures. ASTM Geotechnical Testing Journal, 14(2), 157–165.
- Wu, J.T.H. (1992). Predicting Performance of the Denver Walls: General Report. International Symposium on Geosynthetic‐Reinforced Soil Retaining Walls. A.A. Balkema, Rotterdam, pp. 3–20.
- Wu, J.T.H. (1994). Design and Construction of Low Cost Retaining Walls: The Next Generation in Technology. Publication No. CTI‐UCD‐1‐94, Colorado Transportation Institute, Denver, Colorado, 152 pp.
- Wu, J.T.H. (2001). Revising the AASHTO Guidelines for Design and Construction of GRS Walls. Report CDOT‐DTD‐R‐2001‐16, Colorado Department of Transportation, Denver, Colorado, 148 pp.
- Wu, J.T.H. (2007). Lateral Earth Pressure against the Facing of Segmental GRS Walls. Geosynthetics in Reinforcement and Hydraulic Application, Geo‐Denver 2007: New Peaks in Geotechnics, American Society of Civil Engineers, pp. 1–11.
- Wu, J.T.H. (2012). Design Protocol of GRS Walls for Non‐Load‐Bearing Applications. Report to Turner‐Fairbank Highway Research Center, Federal Highway Administration, McLean, Virginia.
- Wu, J.T.H. (2018). A Generic Design Protocol for Geosynthetic Reinforced Soil Foundation. Transportation Infrastructure Geotechnology, 5(16), 1–15. DOI 10.1007/s40515‐018‐0061‐2.
- Wu, J.T.H. and Helwany, S. (1996). A Performance Test for Assessment of Long‐Term Creep Behavior of Soil‐Geosynthetic Composites. Geosynthetics International, 3(1), 107–124.
- Wu, J.T.H. and Payeur, J.B. (2015). Connection Stability Analysis of Segmental Geosynthetic Reinforced Soil (GRS) Walls. Transportation Infrastructure Geotechnology, 2(1), 1–17. DOI 10.1007/s40515‐014‐0013‐4.
- Wu, J.T.H. and Pham. Q. (2010). An Analytical Model for Calculating Lateral Movement of a Geosynthetic‐Reinforced Soil (GRS) Wall with Modular Block Facing. International Journal of Geotechnical Engineering, 4(4), 527–535.
- Wu, J.T.H., Lee, K.Z.Z., Helwany, S.B., and Ketchart, K. (2006). Design and Construction Guidelines for GRS Bridge Abutment with a Flexible Facing. Report No. 556, National Cooperative Highway Research Program, Washington, D.C.
- Wu, J.T.H., Ketchart, K., and Adams, M. (2008). Two Full‐Scale Loading Experiments of Geosynthetic‐Reinforced Soil (GRS) Abutment Wall. International Journal of Geotechnical Engineering, 2(4), 305–317.
- Wu, J.T.H., Pham, T.Q., and Adams, M.T. (2010). Composite Behavior of Geosynthetic‐Reinforced Soil (GRS) Mass. Research Report, Department of Civil Engineering, University of Colorado Denver, 277 pp.
- Wu, J.T.H., Ma, C.Y., Pham, T.Q., and Adams, M.T. (2011). Required Minimum Reinforcement Stiffness and Strength in Geosynthetic‐Reinforced Soil (GRS) Walls and Abutments. International Journal of Geotechnical Engineering, 5(4), 395–404.
- Wu, J.T.H., Pham, T.Q., and Adams, M.T. (2013). Composite Behavior of Geosynthetic Reinforced Soil Mass. Publication No. FHWA‐HRT 10‐077, Federal Highway Administration, McLean, Virginia, 211 pp.