3
Reinforced Soil and Geosynthetic Reinforced Soil (GRS) Walls
The idea of incorporating tensile inclusion to reinforce a soil mass is not at all new; it is known to have existed for at least 6,000 to 7,000 years. Modern reinforced soil technology was reintroduced in the early 1960s. Since then, many reinforced soil wall systems have been developed for earthwork construction where a sudden change in grade is necessary or desired. To date, about 200,000 reinforced soil walls have been constructed worldwide, and the number is growing at an increasing rate. These reinforced soil wall systems can be grouped into two categories: externally stabilized reinforced walls and internally stabilized reinforced walls. For the former, the tensile inclusion embedded in the fill material serves primarily as frictional quasi‐tiebacks, and the fill is retained by facing that is connected to the tensile inclusion to form a stable system. If facing fails, failure of an externally stabilized reinforced wall would generally be imminent. For the latter, on the other hand, the tensile inclusion embedded in fill material serves to improve the properties of the soil so that and the soil–geosynthetic composite would be stable by itself. Facing, in this case, is mostly just a façade.
The underlying design concept of externally stabilized reinforced walls is somewhat similar to that of conventional earth retaining walls (such as gravity or cantilever reinforced concrete walls), except that instead of relying on the weight of wall structure to stabilize the backfill, the external support is derived from facing (serving to retain the backfill) and tensile reinforcement (serving to stabilize the facing). These externally stabilized reinforced walls are often referred to as mechanically stabilized earth (or MSE) walls. MSE walls with geosynthetics as reinforcement are sometimes referred to as GMSE walls.
The fundamental design concept for an internally stabilized reinforced walls is quite different from that of externally stabilized reinforced walls. The backfill in internally stabilized reinforced walls is “reinforced” by geosynthetic inclusion in such a way that the soil–geosynthetic composite needs to be sufficiently stable under its self‐weight and upon load applications. Internally stabilized soil walls rely on soil–reinforcement interaction to generate different reinforcing mechanisms to achieve a stable system. Facing in internally stabilized reinforced walls is not a load‐carrying component in design.
This chapter focuses on internally stabilized walls. We shall begin with a discussion of the theory of reinforced soil in general and geosynthetic reinforced soil (GRS) in particular, followed by a discussion of various reinforcing mechanisms of internally stabilized soil walls, and conclude with a description of some common types of GRS walls. It should be noted that because GRS walls (walls reinforced with closely spaced geosynthetic reinforcement) do not count on external support to achieve stability, they are referred to as soil walls, as opposed to soil (or earth) retaining walls.
3.1 Reinforced Soil and GRS
Soil is relatively strong in resisting shear stress and compressive normal stress, but is very weak in resisting tensile normal stress. The concept of reinforced soil in some respects is quite similar to that of reinforced concrete. In reinforced soil, tensile reinforcement embedded in a soil mass plays the role of resisting tensile stress, much like the role of steel in reinforced concrete. There are, however, significant differences between reinforced soil and reinforced concrete. Other than the obvious difference in parent material (unbonded soil vs. bonded aggregate and cement) and reinforcement material (geosynthetics or other high tension‐resistance materials vs. rebar), a more important difference is in the reinforcing mechanism. In reinforced concrete, the reinforcement (rebar) bonds with aggregate when the cementitious material in concrete hardens. The bonding allows the reinforcement and the concrete to deform together as long as strain compatibility is maintained. In reinforced soil, however, the interface bonding between the fill material and the geosynthetic reinforcement derives primarily from friction, which is strongly dependent on the normal stress. More importantly, the role of reinforcement in reinforced soil goes far beyond resisting tensile stress. There are many other mechanisms by which reinforcement brings about reinforcing effects in a reinforced soil mass. These mechanisms are discussed in Section 3.3.
Tensile reinforcement (also referred to as tensile inclusion) in reinforced soil may take a few different forms, such as planar sheets, strips, mats, mesh, or three‐dimensional cells. This book focuses on planar sheet reinforcement; the design principles for other forms of reinforcement are essentially the same as that for planar sheet reinforcement. The tensile reinforcement may also be made of different materials. Natural materials, such as reeds, straws, and bamboos, were used as reinforcement in ancient times and are still being used in some developing countries. Since the early 1960s, however, the reinforcement has almost exclusively been man‐made materials, including metallic and polymeric materials, with the latter being referred to as geosynthetics.
The use of metallic members (in the form of strips, wires, cables, or plates) as reinforcement is attractive to civil engineers because they have been used in earthwork construction for centuries and with very good success. Polymeric material, on the other hand, is relatively new in earthwork construction. Polymeric reinforcement, however, offers several distinct advantages over metallic reinforcement, including lower costs, easier to transport to construction site, fewer life‐cycle maintenance activities, and higher resistance to environmental attack, including attack by water. The tradeoffs between metallic and polymeric reinforcements are discussed in Section 4.3.
Figure 3.1 shows a set of stress–strain curves of reinforced and unreinforced sands obtained from a series of triaxial compression tests (Broms, 1977). For the reinforced sands, sheets of a geotextile are cut into small disks and placed horizontally inside soil specimens in different layouts, as seen in Figure 3.1. Tests were performed at low (20 kPa) and high (200 kPa) confining pressures. It is seen that, other than at very small strains, the reinforced sand exhibits appreciably higher stiffness (i.e., steeper slopes on stress–strain plots) and higher shear strength than the unreinforced sand. Note that the behavior of reinforced soil with geotextile disks at the top and bottom of the test specimens is nearly the same as that of unreinforced soil because these geotextile disks hardly play a role in resisting tensile stress.
Figure 3.1 Triaxial compression test results of reinforced and unreinforced dense sands: (a) at 20 kPa (3 psi) confining pressure and (b) at 200 kPa (30 psi) confining pressure (Broms, 1977, taken after Koerner, 1994)
The stress–strain curves in Figure 3.1 indicate that the presence of reinforcement has little effect under very small strains. Results of other laboratory triaxial tests have shown a similar behavior, in that a threshold reinforcement strain of about 0.5% is needed to begin mobilizing the reinforcing effect (e.g., Gray and Al‐Refeai, 1986; Tafreshi and Asakereh, 2007). Recent studies using field‐scale specimens (see Section 3.2), however, have disputed the magnitude or even the existence of such a threshold strain.
Some laboratory tests have suggested that a reinforced soil may even be less stiff than an unreinforced soil at axial strains between 0 to 1–2% (e.g., Gray and Al‐Refeai, 1986; Tafreshi and Asakereh, 2007). This behavior would have been a serious issue, had it been true. After all, maximum geosynthetic reinforcement strains under typical service loads in reinforced soil walls have been found to be usually lower than 1.0%, and almost always less than 2.0%. Fortunately, the low stiffness of the reinforced soil at lower strains has been found to be due entirely to compression of the geotextile layers in the test specimens (Liu, 1987). The relative thickness of the reinforcement layers in those laboratory tests is much larger than that in actual construction, therefore the effect of compression in reinforcement thickness is much exaggerated in those laboratory tests. In other words, the reinforced soil being weaker than unreinforced soil at low strains is due to compression of geosynthetic disks. The problems with most reduced‐scale experiments for geosynthetic reinforced soil are discussed in greater detail in Sections 3.2.3 and 3.3.2. This suggests strongly the need for field‐scale experiments (where reinforcement spacing in field installation is properly simulated) when studying reinforced soil behavior.
Figure 3.2 shows the distribution of vertical and lateral stresses in an unreinforced soil mass and a reinforced soil mass subjected to a vertical load (6 kN) on the top surface, as obtained from plane‐strain finite element analysis. The two soil masses have identical geometry and properties except that the reinforced soil mass contains three sheets of geosynthetic reinforcement, equally spaced at the top, mid‐height, and bottom, on 0.3 m spacing. As seen in Figure 3.2(a), there is little difference in vertical stress between the unreinforced and reinforced soils. The lateral stress in reinforced soil, however, is significantly higher, as seen in Figure 3.2(b). The increase in lateral stress over unreinforced soil is the highest immediately adjacent to the reinforcement and diminishes with distance away from the reinforcement. The increase in lateral stress due to reinforcement is only significant within about 0.1 m from the reinforcement and becomes fairly small at about 0.15 m from the reinforcement. This suggests that when reinforcement spacing is greater than about 0.2–0.3 m, the interaction between soil and reinforcement will become much less significant under the conditions of this example.
Figure 3.2 Stress distribution in an unreinforced soil mass vs. a reinforced soil mass in plane‐strain condition: (a) vertical stress distribution and (b) lateral stress distribution (Ketchart and Wu, 2001)
Geosynthetic reinforced soil (GRS) refers to a reinforced soil mass with geosynthetic inclusion on tight vertical spacing, generally not more than 0.2 m (8 in.) and never greater than 0.3 m (12 in.). In the literature, the term “GRS” has sometimes been used to describe a soil mass with geosynthetic reinforcement on any spacing. In light of the significant benefits of tight reinforcement spacing, however, GRS herein refers specifically to geosynthetic reinforced soil on small reinforcement spacing. Unless otherwise noted, this definition is used throughout this book.
When new earthwork construction technologies are being developed, field practice often leads the way, then research follows. The benefit of closely spaced reinforcement was first realized by wall builders in actual construction. The finding was later validated by a number of field‐scale experiments (see Section 3.2) and analytical studies. Now, many reinforcing mechanisms by which soil is reinforced by geosynthetic reinforcement have been identified, and close reinforcement helps to activate or enhance most of these mechanisms (see Section 3.3). It is true that tight reinforcement means a greater number of layers in a wall. This, however, does not necessarily mean higher costs because reinforcement of lower stiffness/strength can be used with closer spacing. The material cost of geogrid reinforcement in a geosynthetic reinforced soil wall typically ranges between 15% and 20% of the total project cost; the percentage is slightly smaller when woven geotextiles are used. The total cost of geosynthetic reinforcement in GRS walls, with a greater number of layers but lower stiffness/strength values, is typically comparable to that of reinforced soil walls with fewer layers of reinforcement but higher stiffness/strength values.
In actual construction, GRS walls have demonstrated many distinct advantages over conventional earth retaining walls, including the following:
- GRS walls are more flexible, hence inherently more tolerant to foundation movement.
- GRS walls are more adaptable to lower quality backfill.
- When properly designed and constructed, GRS walls with closely spaced geosynthetic reinforcement are remarkably stable. From 1990 to 2010, researchers were not able to bring about complete failure of any field‐scale GRS until the Federal Highway Administration (FHWA) was finally able to bring about failure of closely spaced GRS columns using a unusual loading setup, and the load‐carrying capacities were over 1,000 kPa or 20,000 lb/ft2 (Adams et al., 2011b; Nicks et al., 2013).
- Construction of GRS walls is rapid and requires only ordinary construction equipment.
- GRS walls do not require embedment into the foundation soil to maintain stability. This is especially important when the project involves excavation of contaminated foundation soil.
- When used in conjunction with “deformable” facing (say, dry‐stacked light‐weight concrete blocks with friction‐only connection between blocks), the lateral earth pressure exerted on the wall face is very small.
- GRS walls typically involve reduced life‐cycle maintenance costs and activities.
- GRS walls are generally less expensive (typical savings of about 20–30%) compared with conventional earth retaining walls.
With these advantages of GRS walls, however, designers should be cautioned not to take a lackadaisical attitude toward investigation of site conditions. Unfavorable site conditions can often lead to problems associated with external stability (i.e., stability surrounding the reinforced soil mass, involving the soil beneath and behind the reinforced soil mass, see Section 5.1).
One common concern of reinforcing a soil wall, including both GRS and GMSE, with geosynthetics as reinforcement is that their system stiffness may not be as high as reinforced earth walls with metallic strip reinforcement. However, studies have clearly demonstrated that the stiffness of GRS and GMSE wall systems is much more than needed to fulfill their intended functions as long as the fill is well compacted (see Section 3.2). The not‐as‐high stiffness of geosynthetic reinforced soil walls is only relevant in applications where wall deformation needs to be kept to an absolute minimum, e.g., walls for high‐speed railways. Tatsuoka et al. (2005) showed that using cement‐mixed gravelly soil with geogrid reinforcement can produce a soil–reinforcement composite of extremely high stiffness. In many parts of Japan, Japan Railway has used cement‐mixed gravels successfully in construction of reinforced soil walls and bridge abutments for shinkansen (bullet‐train railway lines) where tolerance of deformation is very small.
Berg et al. (2009) list potential disadvantages of reinforced soil walls as: (i) requirement of a relatively large space for excavation, (ii) use of select granular free‐draining backfill, and (iii) often needing a shared design responsibility between geosynthetic material suppliers and owners. While (i) is debatable (a true GRS wall system with tight reinforcement spacing of 0.2 m or less requires little to no excavation unless the foundation soil is too weak to support the wall, see Step 12, Section 5.7.1), (ii) is shared by all earth retaining structures; however, (iii) is indeed a distinct disadvantage of GRS walls. The GRS wall components manufacturer/supplier is usually responsible for the internal stability (see Section 5.1) of the system (as they are usually intimately familiar with the system components, hence able to optimize the design of the system), while the responsibility for external stability (see Section 5.1) typically falls on the owner or his/her representative. Shared responsibility, when needed, requires good coordination for a successful project.
3.2 Field‐Scale Experiments of GRS
This section describes and discusses three sets of experiments conducted to investigate the load–deformation behavior of GRS with closely spaced reinforcement. These experiments are of field‐scale in that the reinforcement spacing in the experiments are typical of what has been used in actual construction of GRS walls in the field. The three sets of experiments are: (i) unconfined “mini pier” experiments by Adams et al. (2002, 2007), (ii) unconfined compression experiments by Elton and Parawaran (2005), and (iii) generic soil‐–geosynthetic composite (SGC) plane‐strain experiments by Wu et al. (2010).
3.2.1 “Mini Pier” Experiments (Adams et al., 2002, 2007)
Five “mini pier” experiments were conducted and reported by Adams and his colleagues at the Turner‐Fairbank Highway Research Center, Federal Highway Administration (Adams et al., 2002, 2007). The test specimens were cuboidal in shape (referred to as “mini piers”), measuring 1.0 m by 1.0 m in cross‐section and 2.0 m in height. The mini piers were subjected to incrementally increasing vertical loads on the top surface under an unconfined condition. Figure 3.3(a) shows a mini pier experiment after it has been loaded to failure. Of the five experiments, one was conducted without reinforcement, two were on reinforcement spacing of 0.2 m, and the other two on mixed reinforcement spacing of 0.4 m to 0.6 m. Two woven geotextiles of different stiffness/strength were used as reinforcement, with wide‐width strengths (Tf ) of 70 kN/m and 21 kN/m.

Figure 3.3 (a) A “mini pier” reaches a failure condition and (b) stress–strain relationships of all five “mini piers” (modified after Adams et al., 2007)
The stress–strain curves of the five mini piers are shown in Figure 3.3(b). It is seen that the reinforced piers, especially Piers C and D on reinforcement spacing of 0.2 m, exhibit much higher stiffness and strength than the unreinforced pier (Pier A). The relative influence of reinforcement spacing vs. reinforcement strength on stress–strain behavior can be evaluated by inspecting carefully the difference in stress–strain relationships between Pier D (on 0.2 m spacing) and Pier B (on 0.4 m spacing), as compared to the difference between Pier D (Tf = 70 kN/m) and Pier C (Tf = 21 kN/m). It is obvious that the former is much greater than the latter, indicating that the influence of reinforcement spacing is greater than that of reinforcement strength. For a quantitative evaluation, the applied vertical pressures needed to bring about a global vertical strain of 1.0% are 190 kPa, 245 kPa, and 300 kPa for Piers B, C, and D, respectively. Considering Pier D as a baseline for comparisons, the required vertical pressure to reach 1.0% strain for Piers B and C is, respectively, 1.6 times and 1.2 times that for Pier D, while the reinforcement strength of Pier C is 3.5 times that of Pier D, yet the spacing of Pier B is only twice that of Pier D. This series of experiments provide solid evidence that reinforcement spacing plays a more important role than reinforcement strength in the load–deformation behavior of reinforced soil.
3.2.2 Unconfined Compression Experiments (Elton and Patawaran, 2005)
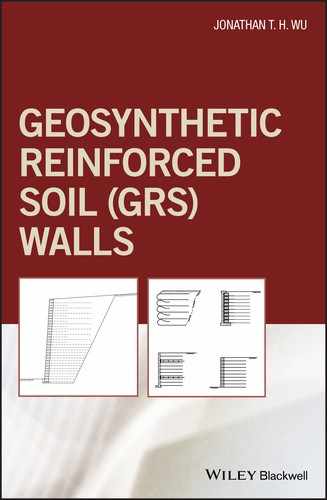
Elton and Patawaran (2005) conducted seven field‐scale unconfined compression experiments on 0.76 m diameter, 1.5 m high cylindrical specimens (see Figure 3.4). Reinforcement spacing was 0.15 m for all the experiments, except one with 0.3 m. The reinforcements were needle‐punched nonwoven geotextiles of different weights, designated TG500, TG600, TG700, TG800, TG1000, and TG028, with respective ultimate strength of 9, 14, 15, 19, 20, and 25 kN/m, as shown in Table 3.1. The soil was a poorly graded sandy soil with less than 5% fines and a maximum grain diameter of 12.7 mm. Modified Proctor compaction tests (ASTM D1557) of the soil gave an optimum moisture content of 9.3% and a maximum dry unit weight of 19.0 kN/m3. Direct shear tests on the sand in a moist compacted state (at a wet unit weight of 18.5 kN/m3 ) gave an angle of internal friction (ϕ) of 40° with cohesion (c) of 29 kPa.
Figure 3.4 Soil–geosynthetic composite specimen in a unconfined compression test (a) before loading and (b) at failure (Elton and Patawaran, 2005)
Table 3.1 Test conditions and failure loads of unconfined compression tests (Elton and Patawaran 2005)
| Designation | TG 500 | TG 500‐12 | TG 600 | TG 700 | TG 800 | TG 1000 | TG 028 | |
| Reinforcement strength, Tf (kN/m) | (Machine) | 9 | 9 | 14 | 15 | 19 | 20 | 25 |
| (Cross‐Machine) | 14 | 14 | 19 | 20 | 20 | 23 | 22 | |
| Reinforcement spacing, sv (m) | 0.15 | 0.30 | 0.15 | 0.15 | 0.15 | 0.15 | 0.15 | |
The stress–strain curves of the seven soil–geosynthetic composites are shown in Figure 3.5. It is seen that reinforcement strength influences the stress–strain behavior appreciably. The curves follow a general trend, namely, the stronger the reinforcement, the higher the strength of the soil–geosynthetic composite. The experiment designated TG500‐12, the only one on reinforcement spacing of 0.3 m, shows much lower composite strength than TG500 which has the same reinforcement as TG500‐12, but on half the reinforcement spacing. The influence of reinforcement spacing is seen to be very significant.
Figure 3.5 Stress–strain curves of soil–geosynthetic composites obtained from unconfined compression tests (Elton and Patawaran, 2005)
3.2.3 Generic Soil–Geosynthetic Composite Plane‐Strain Experiments (Wu et al., 2010, 2013)
Wu et al. (2010, 2013) conducted and reported the results of four generic plane‐strain soil–geosynthetic composite (SGC) experiments and, for comparison purposes, one soil‐only experiment (see Figure 3.6). Since a soil mass with layers of geosynthetic inclusion is far from being uniform, it was deemed necessary that the test specimen be sufficiently large to provide “representative” behavior of soil–reinforcement composites. The finite element method of analysis with an elasto‐plastic hardening soil model was used to determine the specimen dimensions needed to provide representative stress–strain–volume change behavior of the soil–geosynthetic composites. Specimens of different dimensions were analyzed, and the global (overall) stress–strain and volume change relationships are shown in Figure 3.7. It was concluded that a specimen 2.0 m in height and 1.4 m in depth on 0.2 m spacing under a confining pressure of approximately 30 kPa would give an adequate representation of 7.0‐m high GRS on 0.2 m reinforcement spacing. The conditions of the five experiments are summarized in Table 3.2. Among the five SGC experiments, all except one were conducted under a confining pressure of 34 kPa, and the experiments varied in reinforcement stiffness/strength and reinforcement spacing.
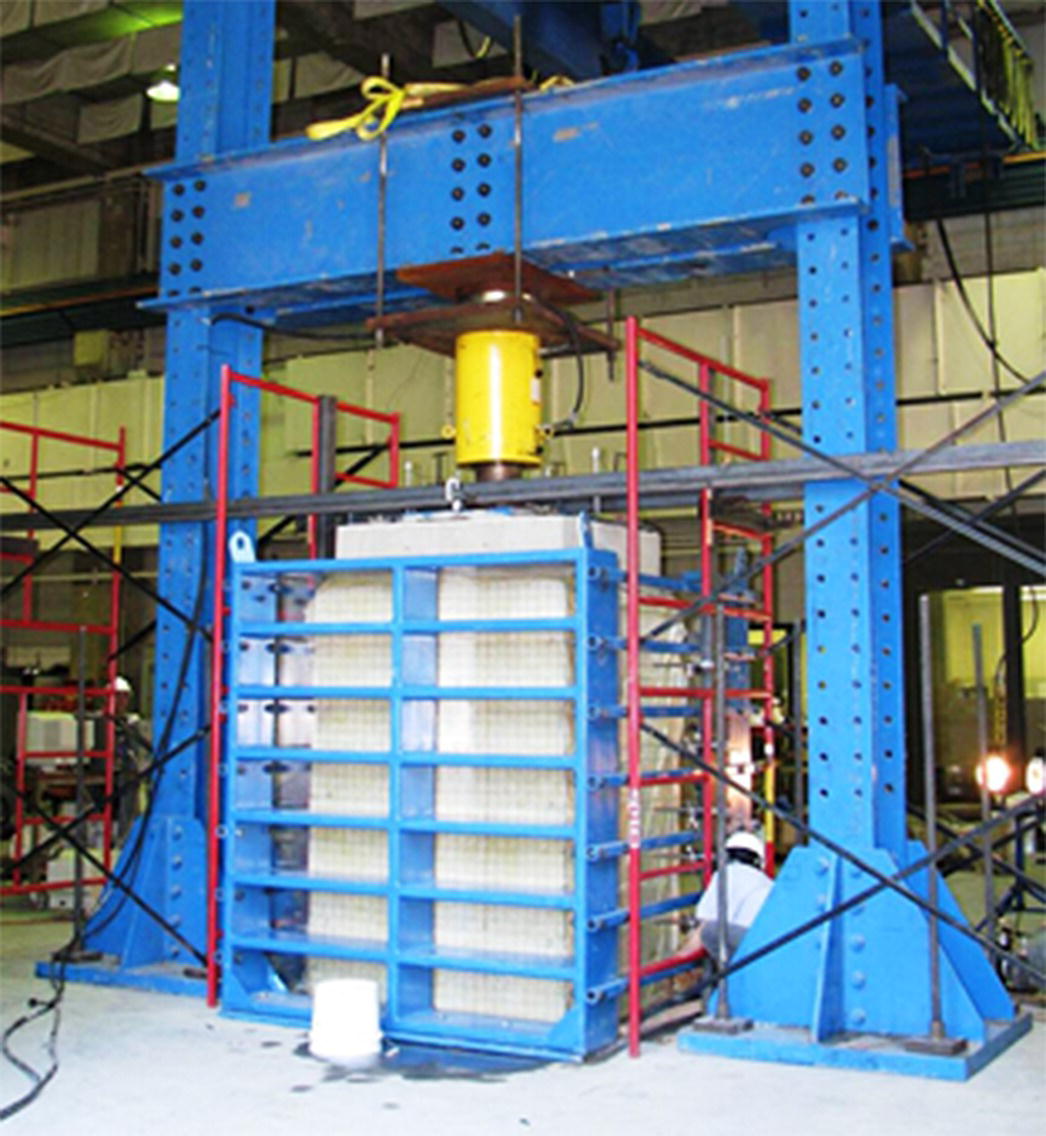
Figure 3.6 A plane‐strain soil–geosynthetic composite (SGC) experiment conducted at TFHRC of the Federal Highway Administration

Figure 3.7 (a) Deviator stress vs. strain relationships, and (b) axial strain vs. volumetric strain relationships for soil–geosynthetic composites of different specimen sizes under a confining pressure of 30 kPa (Wu et al., 2013)
Table 3.2 Test conditions of the SGC experiments (Wu et al., 2013)
| Designation | Confining Pressure (kPa) | Reinforcement Strength, Tf (kN/m) | Reinforcement Spacing, sv (m) |
| Test 1 | 34 | None | N/A |
| Test 2 | 34 | 70 | 0.2 |
| Test 3 | 34 | 140 | 0.4 |
| Test 4 | 34 | 70 | 0.4 |
| Test 5 | 0 | 70 | 0.2 |
The backfill used in the experiments was a well‐graded gravelly sand. The Mohr–Coulomb strength parameters for as‐compacted soil are: c = 70 kPa and ϕ = 50° for confining pressure between 0 and 200 kPa; c = 240 kPa and ϕ = 38° for confining pressure between 200 and 750 kPa. The reinforcement was a woven geotextile with a wide‐width strength of 70 kN/m, except for Test 3, where the reinforcement was formed by gluing two sheets of the same geotextile together, producing twice the stiffness and the wide‐width strength of a single sheet (as verified by wide‐width tensile tests) while maintaining the same soil–reinforcement interface conditions as for a single sheet.
The measured load–deformation and volume change relationships of the soil–geosynthetic composites obtained from the SGC experiments are shown in Figure 3.8. A summary of the test conditions and ultimate vertical load‐carrying pressure of the SGC experiments is given in Table 3.3. The following observations are made:
- Using vertical strains at failure as an indicator for the ductility of the soil–geosynthetic composites, all soil–geosynthetic composites (Test 2 to Test 5) exhibit much higher ductility than the unreinforced soil mass (Test 1). The vertical strain at failure of Test 2 (the baseline) is more than 200% of Test 1.
- All the soil–geosynthetic composites (Test 2 to Test 5) have significantly higher load‐carrying capacity than the unreinforced soil (Test 1). The ultimate load‐carrying capacity of Test 2 is about 350% of Test 1.
- Test 2 (sv = 0.2 m) and Test 3 (sv = 0.4 m) have the same Tf /sv ratio, yet the load‐carrying capacity of Test 3 is only 65% of Test 2.
- The influence of reinforcement spacing can be seen by comparing the load–deformation curves of Test 4 and Test 2. By reducing reinforcement spacing by 50% (and maintaining the same reinforcement strength), the load‐carrying capacity is seen to increase about 100%. The ductility is also seen to reduce significantly with the increase in reinforcement spacing.
- The influence of reinforcement strength can be seen by comparing the load–deformation behavior of Test 3 and Test 4. By reducing the reinforcement strength by 50% (and maintaining same reinforcement spacing), the load‐carrying capacity is seen to decrease only about 25%. Comparing this to the influence of reinforcement spacing (see the bullet immediately above), it is evident that reinforcement spacing has a much stronger influence than reinforcement strength on the load‐carrying capacity and load–deformation behavior of GRS.
- The load‐carrying capacity of Test 5 (unconfined) is about 30% lower than that of Test 2. This shows that confining pressure can have a significant influence on the load–deformation behavior of GRS.
Figure 3.8 Measured load–deformation relationships of soil–geosynthetic composites obtained from the SGC experiments (Wu and Pham, 2013)
Table 3.3 Summary of measured results of the SGC experiments (Wu et al., 2013)
| Parameter | Test 1 (unreinforced) | Test 2 (T, sv) | Test 3 (2T, 2sv) | Test 4 (T, 2sv) | Test 5 (T, sv) |
| Ultimate strength of reinforcement, Tf (kN/m) | NA | 70 | 140 | 70 | 70 |
| Reinforcement spacing, sv (m) | NA | 0.2 | 0.4 | 0.4 | 0.2 |
| Confining pressure, σc (kPa) | 34 | 34 | 34 | 34 | 0 |
| Ultimate pressure at failure, qult (kPa) | 770 | 2,700 | 1,750 | 1,300 | 1,900 |
| Vertical strain at failure | 3.0% | 6.5% | 6.1% | 4.0% | 6.0% |
3.3 Reinforcing Mechanisms of GRS Walls
This section discusses the reinforcing mechanisms by which layers of planar tensile inclusion improve the load–deformation behavior of a soil mass. Reinforcing mechanisms have been the subject of study by numerous researchers and for a few decades (e.g., Schlosser and Long, 1974; Yang, 1972; Hausmann, 1976; Bassett and Last, 1978; Ingold, 1982; Gray and Al‐Refeai, 1986; Maher and Woods, 1990; Athanasopoulos, 1993; Elton and Patawaran, 2005; Pham, 2009, etc.). Many reinforcing mechanisms have been identified. The operative mechanism(s) in a reinforced soil mass depends on the type of structure, reinforcement spacing, loading conditions, etc. The reinforcing mechanisms of GRS walls include:
- increase lateral confinement of soil
- effect cohesion in granular fill (without introducing the undesirable behavior of a cohesive soil)
- suppress dilation of soil
- increase compaction‐induced stress of soil
- restrain lateral deformation of soil
- stabilize potential failure wedge of a soil structure (i.e., serving as quasi‐tiebacks)
- preserve integrity of soil by preventing loss of soil particles
- accelerate dissipation of porewater pressure in low permeability fill
- improve ductility of soil
In the following, each of the above mechanisms is described, with greater detail given to the first three mechanisms for which the extent of reinforcing has been expressed in a quantitative manner.
3.3.1 Mechanisms of Apparent Confining Pressure and Apparent Cohesion
If we have a bucketful of dry clean sand and wish to make it into the steepest possible pile without external support or compaction, we can perhaps accomplish it by pouring the sand onto a flat surface very slowly. We will then likely find the steepest angle to be between 30° and 40°. This angle is commonly referred to as the angle of repose. Without cohesion between dry granular particles, the steepest angle that any granular fill can assume is less than about 50°. Only with cohesion can a granular fill stand at a 90° angle without lateral support.
Figure 3.9(a) shows a clean dry sand at its angle of repose, and Figure 3.9(b) shows the same sand reinforced by strips of plain paper embedded horizontally inside the sand. By incorporating layers of reinforcement in the sand, the sand is internally reinforced so that it can assume a 90° angle. The embedded paper strips are said to generate an apparent cohesion in the dry sand and allow the sand to behave as if it possesses a certain amount of cohesion. Note that the paper is wrapped at the face to prevent loss of dry sand particles (sloughing); it otherwise assumes little structural function at the face.
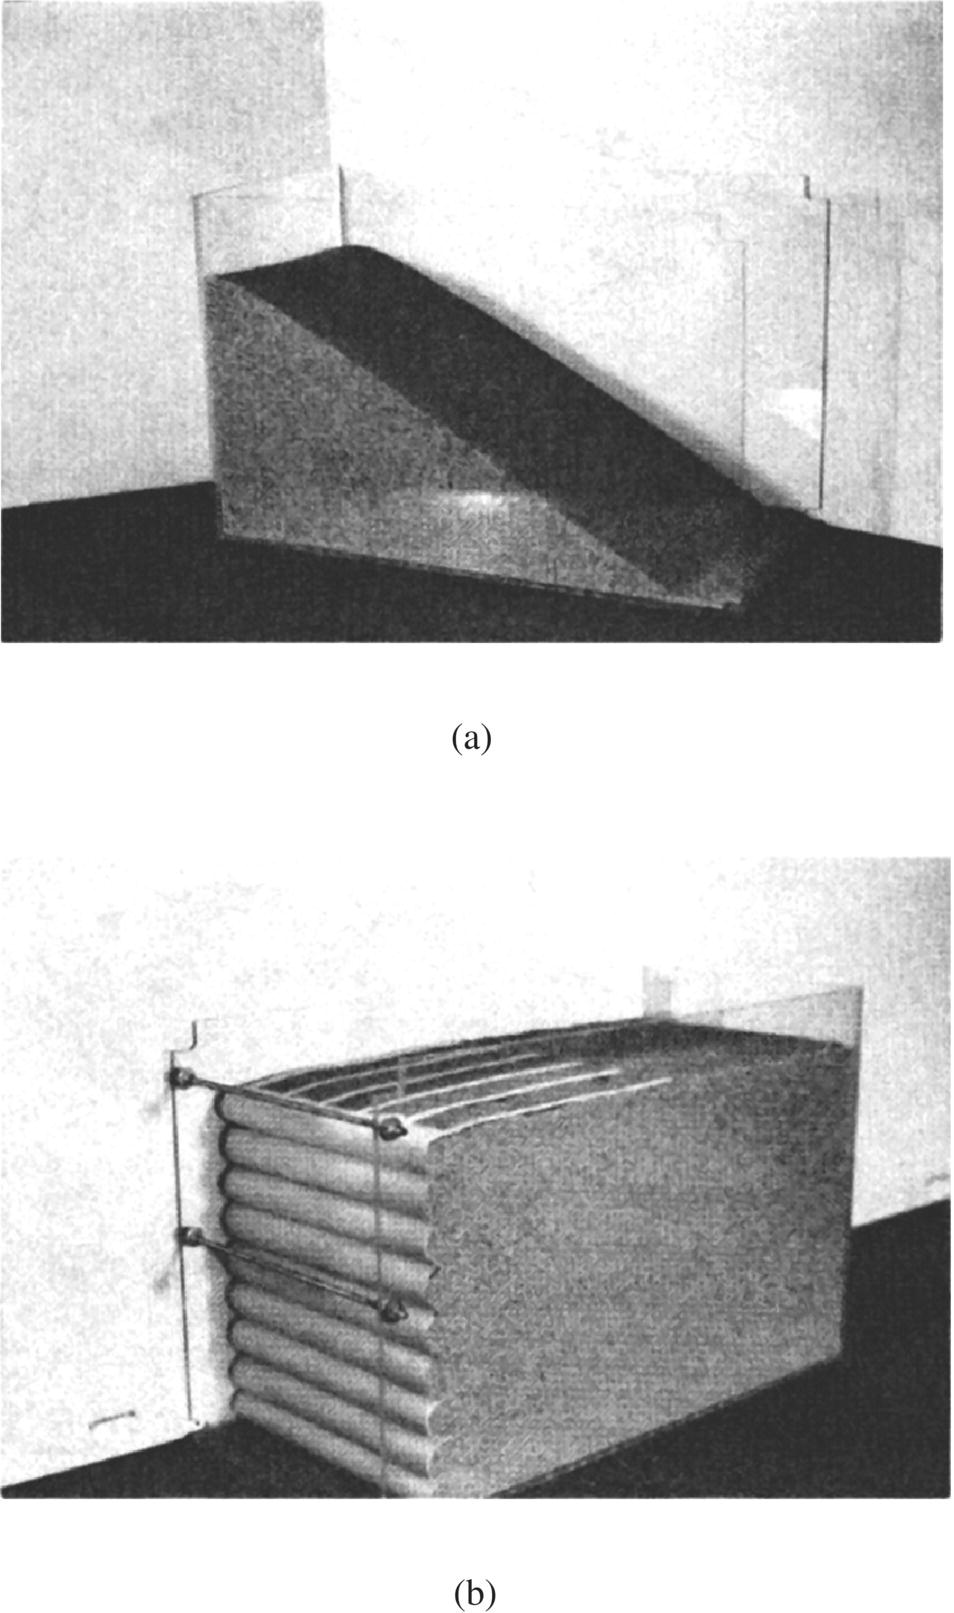
Figure 3.9 Unreinforced vs. reinforced dry sands: (a) a unreinforced sand at the angle of repose and (b) the same sand reinforced internally by layers of paper strips (Mitchell and Villet, 1987)
The mechanism of apparent cohesion as a reinforcing mechanism for reinforced soil was first identified by Schlosser and Long (1974). In this mechanism, the interaction between soil and tensile reinforcement is said to bring about an apparent cohesion in the soil without introducing any appreciable time‐dependent deformation commonly associated with cohesive soils. As seen in the Mohr circles shown in Figure 3.10(a), under a confining pressure σ3c , the apparent cohesion acquired by tensile reinforcement, cR , will lead to an increase in shear strength, i.e., an increased major principal stress at failure from σ1 to σ1R. In the figure, it is tacitly assumed that the internal friction angle of the soil ϕ will not be affected by the presence of tensile reinforcement. Limited data available to date suggest that the internal friction angle of geosynthetic reinforced soil will indeed stay approximately the same as that of the unreinforced soil (see Figure 3.11). Some recently published data seems to contradict this assumption. Additional reliable test data from field‐scale experiments (such as those described in Section 3.2) are needed before a conclusion regarding the assumption can be reached.
Figure 3.10 Two mechanisms for the increase in shear strength of granular soil due to geosynthetic inclusion: (a) mechanism of apparent cohesion (generation of cR ) and (b) mechanism of apparent confining pressure (generation of Δσc )
Figure 3.11 Strength envelopes of unreinforced and reinforced sands
(modified after Mitchell and Villet, 1987)
Yang (1972) proposed a reinforcing mechanism, known as the mechanism of apparent confining pressure, which is somewhat parallel to the mechanism of apparent cohesion. In the mechanism of apparent confining pressure, the reinforcement is said to generate an added confining pressure in the direction of the reinforcement layers. The added confining pressure can be regarded as an increase in the minor principal stress, Δσ3R , and will lead to a larger major principal stress at failure, σ1R , as seen in Figure 3.10(b).
The mechanisms of apparent cohesion and apparent confining pressure are interrelated. By equating the shear strength of the two mechanisms (i.e., setting σ1R of a given σ3c to be equal for the two mechanisms), see Figure 3.10, the apparent cohesion of a reinforced soil can be determined from the apparent confining pressure, and vice versa. This is addressed below.
For a reinforced soil mass of which the reinforcement has a tensile rupture resistance of Tf , and vertical spacing between adjacent layers of reinforcement of sv , it has been assumed that the increase in confining pressure due to tensile inclusion, Δσ3R , is:

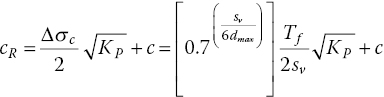
By equating the σ1R in Figure 3.10(a) to the σ1R in Figure 3.10(b), and making use of Rankine’s passive pressure theory, the apparent cohesion, cR , can be expressed as:
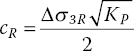
Substituting Eqn. (3‐1) into Eqn. (3‐2), the apparent cohesion becomes

where KP is the coefficient of Rankine passive earth pressure. Note that Eqn. 3‐3 is for a cohesionless soil, c = 0.
Eqn. (3‐3), if valid, can be very useful for the stability analysis of earth structures involving reinforced soil. Given the strength parameters of soil in the unreinforced zone (c = 0 and ϕ > 0) and Tf and sv of the reinforcement in the reinforced zone, Eqn. (3‐3) can be used to determine the strength parameter cR of the reinforced soil as a function of Tf and sv . By assuming ϕR = ϕ (i.e., the same friction angle for unreinforced and reinforced soils), the stability analysis of a reinforced soil structure can be carried out the same way as for soil‐only earth structures by using c = 0 and ϕ for soil in the unreinforced zone, and c = cR and ϕ for soil in the reinforced zone.
Moreover, with the aid of Eqn. (3‐3), the ultimate load‐carrying capacity, qult , of a reinforced granular soil mass (c = 0) becomes:

In recent years, however, the validity of Eqns. (3‐1) to (3‐4) has been brought into question. The seemingly correct expression of Δσ3R = Tf /sv (i.e., Eqn. (3‐1)) suggests that the reinforcing effect is reflected completely by the simple ratio of Tf and sv . It implies that the resulting reinforcing effect is the same for any two reinforcing schemes of the same Tf /sv ratio. In other words, reinforced soil walls of any value of reinforcement spacing will behave the same as long as the reinforcement strength values are proportional to the reinforcement spacing. This assumption has encouraged designers to use larger reinforcement spacing with proportionally higher strength reinforcement because the cost of higher strength geosynthetic products does not differ very significantly, yet placing reinforcement on larger spacing would save considerable time in field installation. Consequently, reinforcement spacing as large as 0.6–1.0 m (or even larger) has routinely been employed in geosynthetic reinforced soil walls since manufacturers have little difficulty producing ever stronger reinforcement. It has been common practice for GMSE walls (MSE walls with geosynthetics as reinforcement) to use reinforcement on 0.3–0.9 m or 12–36 in. spacing (with 0.6 m or 24 in. being typical) to reduce construction time.
Field‐scale experiments, such as the FHWA mini pier experiments (see Section 3.2.1) and the SGC experiments (see Section 3.2.3), have demonstrated conclusively that reinforcement spacing plays a more significant role in the load–deformation behavior of a reinforced soil mass than reinforcement strength. Wu et al. (2010) and Wu and Pham (2013) have presented an analytical model which introduces a W‐factor in the expression for Δσc to reflect more accurately the relative roles of reinforcement spacing (sv) and reinforcement strength (Tf ) as:
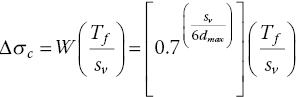
where dmax = maximum particle size of the soil. Eqn. (3‐5), referred to as the W‐equation, leads to a revised expression for apparent cohesion (cR):
where c = cohesion of unreinforced soil. It follows that the ultimate load‐carrying capacity of a soil–geosynthetic composite, qult , becomes:
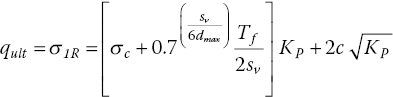
Eqn. (3‐7) is referred to as the load‐carrying capacity equation of soil–geosynthetic composites.
For GRS walls with dry‐stacked concrete block facing, the value of σc can be estimated as ![]() , where γb is the bulk unit weight of the facing block, D is the depth of the facing block unit (in the direction perpendicular to the wall face), and δ is the friction angle between vertically adjacent facing blocks (or between the geosynthetic reinforcement and the facing block, if the geosynthetic is sandwiched between adjacent blocks). The value of σc is very small for light‐weight dry‐stacked concrete blocks without any connection enhancement elements (e.g., lips, keys, or pins), and can be conservatively assumed to be zero.
, where γb is the bulk unit weight of the facing block, D is the depth of the facing block unit (in the direction perpendicular to the wall face), and δ is the friction angle between vertically adjacent facing blocks (or between the geosynthetic reinforcement and the facing block, if the geosynthetic is sandwiched between adjacent blocks). The value of σc is very small for light‐weight dry‐stacked concrete blocks without any connection enhancement elements (e.g., lips, keys, or pins), and can be conservatively assumed to be zero.
The load‐carrying capacity equation, Eqn. (3‐7), has been shown to give drastically improved prediction of load‐carrying capacity of soil–geosynthetic composites than Eqn. (3‐4) (Wu et al., 2010, 2013). The Federal Highway Administration (FHWA) compared all available measured data where a GRS mass is loaded to failure with those calculated by the load‐carrying capacity equation (Eqn. 3‐7), as seen in Figure 3.12. The GRS included in the comparison are field‐scale experiments with soils ranging from fine sand to crushed gravel, geosynthetic reinforcement varying from light‐weight nonwoven to heavy‐weight woven geotextiles, and reinforcement spacing ranging from 0.15 m to 0.3 m. It is seen that the load‐carrying capacity equation, Eqn. (3‐7), provides rather accurate predictions of the load‐carrying capacity of GRS for all the cases. The FHWA (Adams et al., 2011a,b) has incorporated Eqn. (3‐7) in the design guidance of a GRS bridge system called the geosynthetic reinforced soil–integrated bridge system (GRS‐IBS).
Figure 3.12 Comparison of measured and calculated ultimate load‐carrying capacities, with calculated values determined by the load‐carrying capacity equation, Eqn. (3.7), data compiled by TFHRC of the FHWA (Adams et al., 2011b)
3.3.2 Mechanism of Suppression of Soil Dilation
When subject to shear stress, a dense granular soil tends to dilate if volume change is permitted. Leonards (1962) used a set of simple drawings (Figure 3.13(a)) to explain the dilative behavior. In a dense granular soil, soil particles packed tightly and will need to roll over past other particles (without breaking) to produce shear‐induced deformation and lead to an increase in volume, i.e., dilation. If dilation is suppressed, i.e., if shear deformation is prohibited, the soil stiffness and strength will increase.

Figure 3.13 Schematic volume change behavior of a densely packed granular soil subject to shear stress for (a) unreinforced soil and (b) reinforced soil with closely spaced reinforcement (Note: the small dark rectangles show the relative positions of the top and bottom) (Wu et al., 2014)
Suppression of soil dilation in reinforced soil may be a result of two effects. The first is illustrated conceptually in Figure 3.13(b) where the reinforcement in tension contains soil particles to stay between reinforcement layers and prevent them from rolling over past neighboring soil particles, hence suppress the increase in volume. The second effect is related to restraint of lateral deformation due to soil–reinforcement interface friction (see Section 3.3.3). The latter effect is explained below.
When a soil mass is subjected to vertical loads, there will be a reduction in volume in the vertical direction (i.e., contraction) and an increase in volume in the lateral direction (i.e., expansion). In a dense granular soil, the latter typically overcomes the former, and results in a net increase in volume, hence dilation. For reinforced soil, however, the increase in volume in the lateral direction is significantly smaller than that in unreinforced soil, which can result in smaller dilation. For reinforced soil with closely spaced reinforcement, the dilative lateral volume change can be less than the compressive vertical volume change. This can lead to complete suppression of dilation or even a net decrease in the total volume.
Suppression of soil dilation by the presence of reinforcement layers can be seen by inspecting Figure 3.14, which shows measured stress–stain and volume change relationships of unreinforced and reinforced soils obtained from the field‐scale SGC plane‐strain experiments described in Section 3.2.3. In the unreinforced soil, dilation (i.e., increasing volumetric strain due to shear), after a certain amount of initial contraction, is seen from measured data. In the reinforced soils, on the other hand, the dilative behavior is clearly seen to be suppressed due to the presence of geosynthetic reinforcement.

Figure 3.14 Measured results of (a) stress vs. strain behavior and (b) volume change behavior of unreinforced and reinforced soil masses, as obtained from the SGC experiments (Wu et al., 2014)
Depending on soil type, reinforcement spacing, reinforcement stiffness, and, to a lesser degree, confining pressure, the presence of geosynthetic reinforcement may or may not be able to fully suppress soil dilation. The volume change behavior due to change in reinforcement spacing is shown in Figure 3.15. The influence of reinforcement spacing is obvious. The unreinforced soil is seen to exhibit significant dilation. For reinforced soil with sv = 1.0 m, soil dilation still occurs, but is much less than that of unreinforced soil; with sv = 0.5 m, the soil–geosynthetic composite becomes nearly incompressible (i.e., no net volume change) once the axial strain exceeds about 2%; with sv = 0.2 m, dilation of the composites is suppressed over the entire range of stress and strain; the tendency for suppression of dilation is even more pronounced for sv = 0.1 m than for sv = 0.2 m.
Figure 3.15 Volume change behavior of soil–geosynthetic composites for different values of reinforcement spacing (Wu et al., 2014)
The dilation angles (denoted by ψ) of the soil–geosynthetic composites for reinforcement spacing of 0.1 m, 0.2 m, 0.5 m, 1.0 m, and unreinforced soil are about –10°, –3.5°, 0°, +3°, and +20°, respectively (a smaller negative ψ‐value indicates more contraction, implying less tendency to dilate). It is conceivable that ψ‐value may be used to characterize the extent of suppression due to geosynthetic reinforcement. As reinforcement spacing decreases from ∞ (unreinforced) to 0.1 m, the corresponding dilation angle ψ gradually decreases from +20° to –10°, with sv = 0.5 m showing nearly incompressible behavior.
It is interesting to note that tests of small‐size specimens have been seen to produce entirely different behavior. Figure 3.16 shows triaxial test results of a sand with zero, one, two, and three layers of geosynthetic reinforcement. The test specimens used in the tests were quite small (100 mm in diameter and 200 mm in height), and reinforcement spacing ranged from 50 mm to 100 mm. The presence of reinforcement is seen to increase the stiffness and strength of the soil, but does not offer any suppression effect on the dilative behavior observed in the unreinforced soil. In fact, the tests show that the dilative behavior is more prevalent with decreasing reinforcement spacing. Similar findings of triaxial tests performed on small size specimens have been reported, including the tests conducted by Broms (1977), which have been cited frequently in the literature. When the material in a test specimen is non‐uniform, as in a soil–geosynthetic composite, it is important to bear in mind that the test specimen needs to be large enough to accurately account for the interaction among the different components and to give representative composite global behavior, otherwise it may lead to misleading results, as exemplified by the behavior seen in Figure 3.16.
Figure 3.16 Stress–strain and volume change relationships of unreinforced and reinforced soils with different numbers of reinforcement layers, as obtained from using 100 mm diameter test specimens (Chandrasekaran et al., 1989)
3.3.3 Other Reinforcing Mechanisms
Increase in Compaction‐Induced Stress
When a laterally confined soil mass is subjected to external vertical loading, there will generally be an increase in both vertical and lateral stresses in the soil mass. If the loading is subsequently removed, the increase in vertical stress will essentially vanish, but not the increase in lateral stress. The net increase in lateral stress is commonly known as the residual lateral stress or lock‐in lateral stress. For the same vertical loading, the stronger the restraint to lateral deformation, the higher the residual lateral stress. The residual lateral stress resulting from fill compaction operations, which typically involves a series of loadings and unloadings onto the top surface of a compaction lift, is referred to as compaction‐induced stress (CIS).
Compaction‐induced stress is an important factor to consider in terms of the load–deformation behavior of a compacted fill. Compaction‐induced stress in unreinforced soil has been the subject of many studies, including Rowe (1954), Broms (1971), Aggour and Brown (1974), Seed (1983), Bolton (1990), and Duncan et al. (1991). These studies have indicated that compaction‐induced stress can be rather significant if there is sufficient restraint to lateral movement of the soil, and will lead to increased stiffness and strength.
When a soil mass is reinforced by layers of geosynthetic reinforcement, compaction‐induced stress is more pronounced than in an unreinforced condition because a reinforced soil has a higher degree of restraint to lateral deformation of the soil due to soil–reinforcement interface friction. For the same reason, closer reinforcement spacing tends to result in higher compaction‐induced stress. Closer reinforcement spacing also “compels” the compactor operator to keep compaction lift thickness small (no more than reinforcement spacing) and improves the efficiency of fill compaction.
Figure 3.17 shows a simplified stress path at a given depth in the fill due to multiple passes of compaction. The stress path assumes that the slopes of unloading and reloading are the same. The slopes of the stress path can be calibrated by data obtained from well‐controlled field‐scale experiments of GRS, and the value of CIS can then be evaluated. Wu and Pham (2010) have provided an example.
Figure 3.17 The stress path of an unreinforced fill and a reinforced fill for evaluation of the CIS (Wu and Pham, 2010)
Restrain Lateral Deformation of Soil
When a soil mass is compressed in one direction (usually the vertical direction), tensile strains tend to develop in the orthogonal direction (usually the horizontal direction). Reinforcement placed in the expected direction of tensile strains of a GRS mass will help restrain the tensile deformation of the soil mass, hence bringing about greater compaction‐induced stress, and improve stiffness and strength of the soil. The restraint of tensile strain is derived from interface bonding between the soil and reinforcement. This restraining behavior can be seen by comparing the deformation of two triaxial test specimens when subject to vertical loads: soil only vs. soil with one layer of reinforcement at the mid‐height (see Figure 3.18). The restraining effect of lateral deformation by reinforcement is evident in the photos.
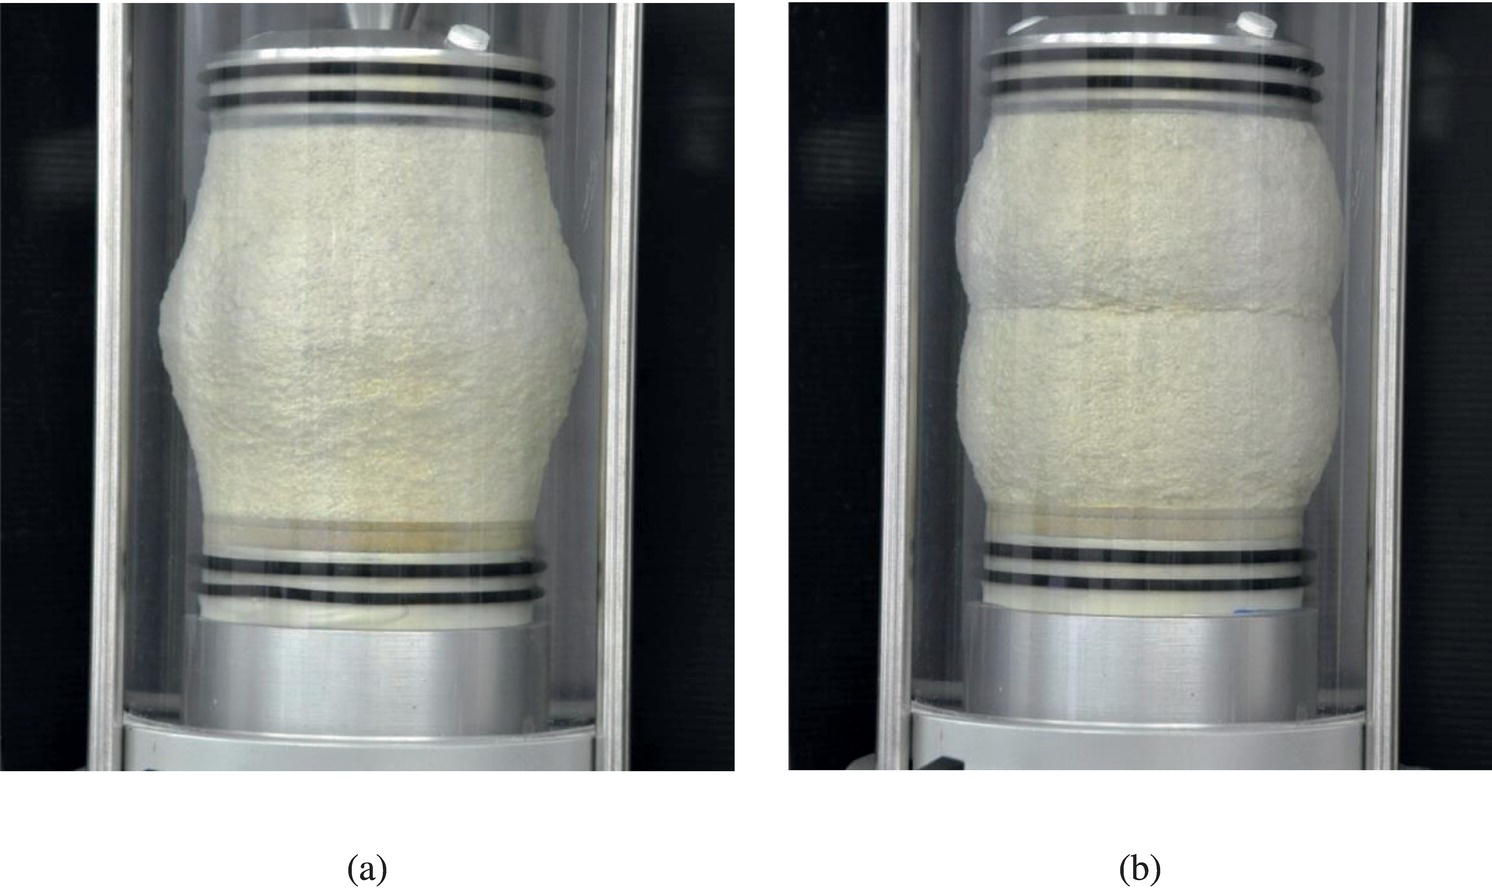
Figure 3.18 Deformation of test specimens in triaxial compression tests performed on (a) unreinforced soil and (b) the same soil with one layer of reinforcement at the mid‐height
(courtesy of Cho‐Sen Wu)
Knowing the distribution of lateral strains in an unreinforced earth structure can be helpful in determining locations where reinforcement will produce the greatest improvement. This can be accomplished by performing finite element analysis on the unreinforced earth structure to identify the locations of tensile strains. The most beneficial orientation of geosynthetic reinforcement may not be the horizontal direction. However, placing geosynthetic sheets horizontally is usually least time‐consuming in actual field installation.
Stabilization of Potential Failure Wedge
If and when a potential failure wedge is to develop within the reinforced zone of a GRS wall, the geosynthetic reinforcement extending beyond the failure wedge is said to act as frictional quasi‐tiebacks to help stabilize the potential failure wedge, as seen in Figure 3.19. This failure mechanism has been considered as a major mode of failure for checking the internal stability (i.e., failure occurred within reinforced zone) of GMSE walls, and has been used for the determination of the required reinforcement length of GMSE walls.
Figure 3.19 Stabilization of a potential failure wedge by geosynthetic reinforcement extending beyond a potential failure surface where the reinforcement serves as quasi‐tiebacks
Preserve Soil Integrity
Many nonwoven and woven geotextiles can serve the function of filtration well, and allow water to pass through without compromising the integrity of the soil. This mechanism can help maintain the stability of GRS walls in certain situations. As an example, wrapped‐face geotextile reinforcement (see Figure 3.20) has been found to help alleviate bridge bumps (differential settlement found at the junction between a bridge deck and the fill behind) by the Wyoming Department of Highways (Edgar et al., 1989). A major reason for the ability to eliminate bridge bumps by geosynthetic inclusion was not the geotextile’s reinforcing function, rather it was attributed to the capability of the wrapped‐face geotextile to contain soil particles in the approach fill. The wrapped‐face geotextile was able to prevent soil particles from falling into the gap formed between the abutment wall and the fill due to shrinkage of the bridge deck in cold seasons (Wu and Helwany, 1990; Monley and Wu, 1993).
Figure 3.20 Wrapped‐face geotextile to prevent soil particles from falling into a gap formed between an abutment wall and reinforced soil mass due to seasonal change (Monley and Wu, 1993)
Acceleration of Porewater Pressure Dissipation
Some geosynthetics, notably heavier needle‐punched geotextiles, can serve the function of transmitting water in the plane of their matrices in addition to reinforcing. These geosynthetics, when used in clayey fill, can facilitate drainage and accelerate dissipation of excess porewater pressure, hence allowing the soil to gain strength with time more rapidly. In Japan, for example, clayey soil is occasionally used as backfill for construction of embankments and walls due to the wide availability of some clayey soils such as a volcanic ash soil known as Kanto loam; the mechanism of accelerating porewater pressure dissipation is important in this application.
Figure 3.21 shows a clay embankment reinforced by a nonwoven needled geotextile with different layout on the two sides. It is seen that the side with more layers of geotextile settles visibly less (i.e., stronger) than the other side with fewer geotextile layers. Measurement of porewater pressure has verified the capability of the geotextile to accelerate dissipation of the porewater pressure (Yamauchi, 1987). Since the stiffness of most nonwoven needled geotextiles with good drainage capability is usually too low to serve effectively as reinforcement, geotextile manufacturers in Japan have produced woven–nonwoven composite geotextiles to combine the advantages of the two types of geotextile, i.e., good capability to dissipate the porewater pressure of a nonwoven needled geotextile, coupled with the higher tensile stiffness of a woven geotextile.
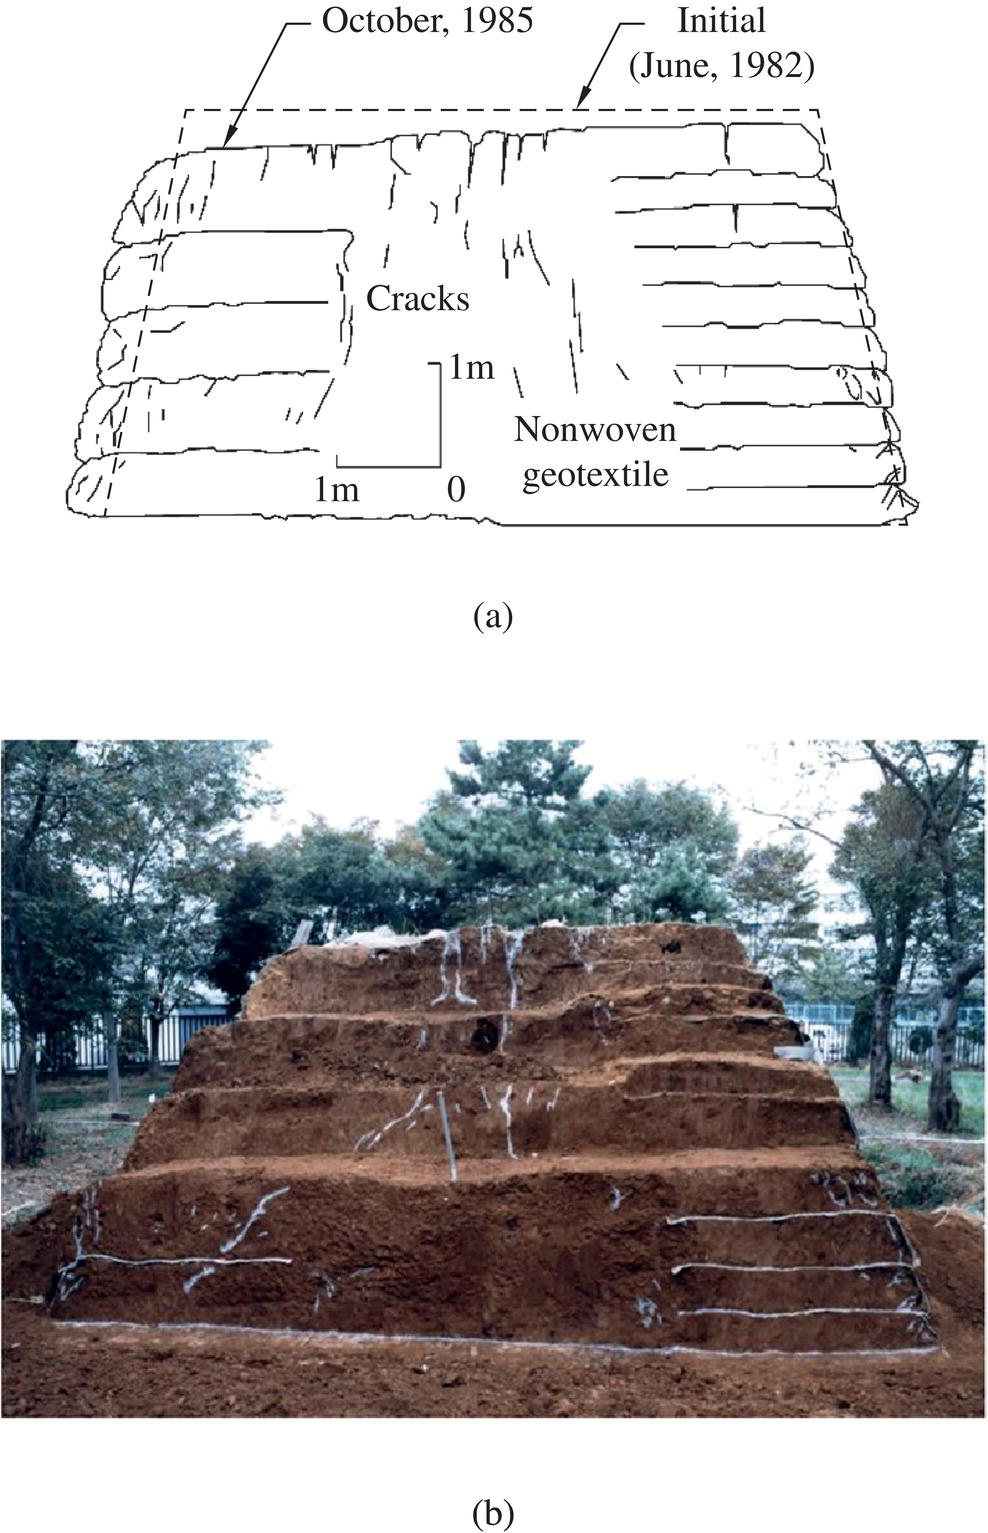
Figure 3.21 A clayey embankment reinforced by different number of layers of a needled‐punched geotextile on two sides of an embankment: (a) layout of reinforcement and deformation, and (b) photo of the embankment
(courtesy of Fumio Tatsuoka)
Improve Ductility of Soil Mass
Figure 3.22 shows the stress–deformation relationships of a ductile material versus a brittle material with about the same strength. Ductility is a term used to denote a material’s ability to undergo significant deformation before rupture. The term “ductility” also applies to a structure. For design of any structure constructed in public places, it is highly desirable that the structure possesses sufficiently high ductility so that if the structure is to fail unexpectedly (due to unexpected external influence or deficiencies in design or construction), failure will not be sudden catastrophic collapse.
Figure 3.22 Stress–deformation relationships of (a) a ductile material/structure and (b) a brittle material/structure
Unreinforced soil structures with granular soils often exhibit low ductility. The lack of ductility, however, can be improved significantly with the inclusion of closely spaced geosynthetic reinforcement. This is seen in full‐scale laboratory experiments and in actual earth structures. The increase in ductility can be evaluated by examining the stress–deformation curves of field‐scale experiments of reinforced versus unreinforced soil. In the SGC plane‐strain experiments, for example, the strain at failure of GRS is about 200% of that in an unreinforced condition (see Figure 3.8). In the unconfined FHWA mini pier experiments, the ratio of failure strains between GRS and unreinforced soil is much higher, between 4.5 and 12.5 (see Figure 3.3(b)).
3.4 Geosynthetic Reinforced Soil (GRS) Walls
A geosynthetic reinforced soil (GRS) wall comprises two major components: geosynthetic reinforced soil mass and facing. Some common types of GRS walls are shown in Figure 3.23. Note that these walls differ primarily in the facing and the connection between reinforced soil mass and facing. This section gives a brief description of major types of GRS walls, including wrapped‐face GRS walls, concrete block GRS walls, cast‐in‐place rigid full‐height facing GRS walls, full‐height precast panel facing GRS walls, and timber facing GRS walls. GRS walls of other types of facing are also noted briefly.
Figure 3.23 Common types of GRS walls (Wu, 1994)
3.4.1 Wrapped‐Face GRS Wall
A geotextile reinforced soil wall with a wrapped face was first constructed in Siskiyou National Forest in Oregon in 1974, and soon after in Olympic National Forest in Shelton, Washington in 1975 by the U.S. Forest Service (Steward and Mohney, 1982). The satisfactory performance and low cost of these walls provided an impetus for many wrapped‐face GRS walls subsequently constructed in the U.S. and around the world. Most wrapped‐face GRS walls have used geotextiles as reinforcement and as facing. More recently, use of geogrid as reinforcement with a pre‐seeded mat or geocomposite as facing has seen applications.
Wrapped‐face GRS walls constructed to date are of two types: (a) geotextile wrapped‐face GRS walls and (b) wire‐mesh wrapped‐face GRS walls. Figure 3.24 shows three completed wrapped‐face GRS walls; the first is a geotextile wrapped‐face wall, and the other two are wire‐mesh wrapped‐face walls. The differences between the two wall types are described in Section 6.1.2. The face of wrapped‐face walls is sometimes covered with shotcrete, gunite, or asphalt emulsion (see Figure 3.25) to prevent deterioration (due to extended UV exposure) and vandalism. The construction procedure for wrapped‐face GRS walls is given in Section 6.1.2.

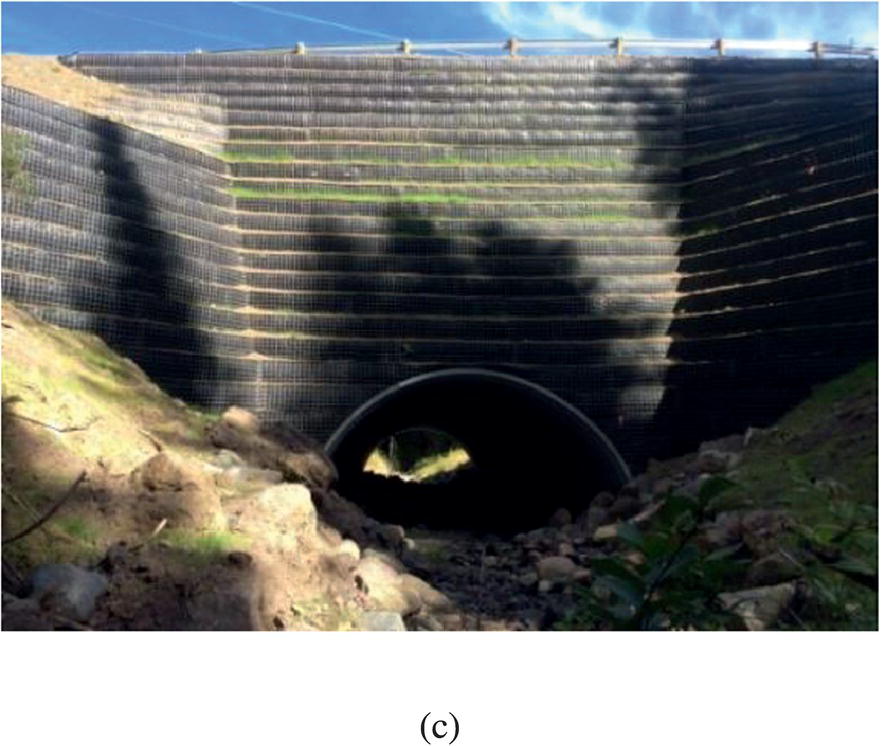
Figure 3.24 (a) A geotextile wrapped‐face GRS wall (courtesy of Bob Barrett), (b) a wire‐mesh wrapped‐face GRS wall (courtesy of Strata Systems, Inc.), and (c) a wire‐mesh wrapped‐face GRS wall (courtesy of Calvin VanBuskirk)
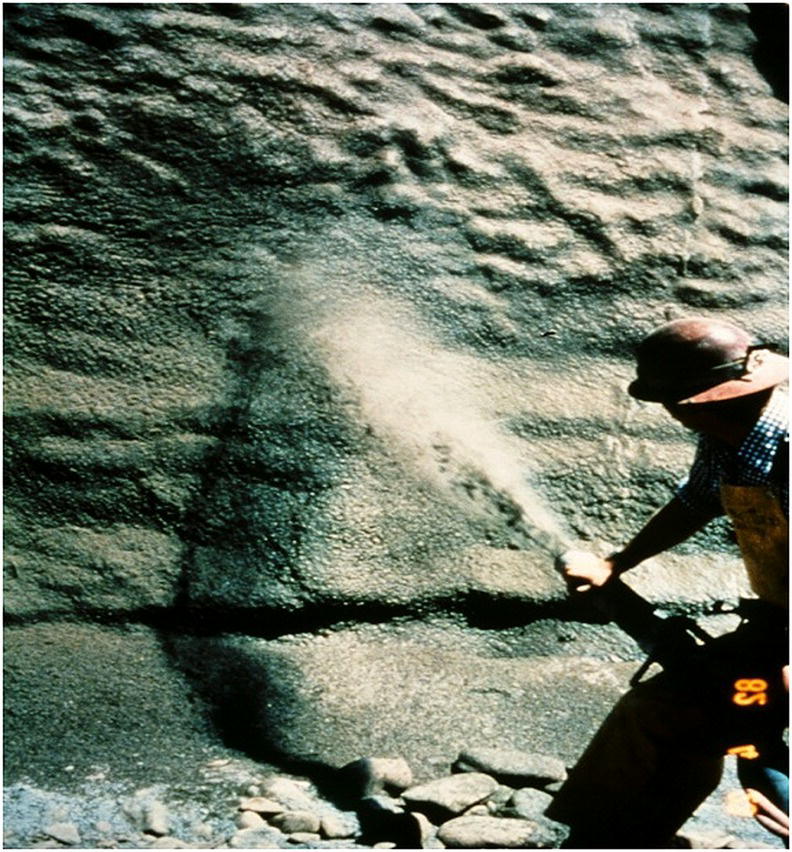
Figure 3.25 A wrapped‐face geotextile reinforced soil wall being covered with shotcrete
(courtesy of Bob Barrett)
The backfill used in the construction of wrapped‐face GRS walls is typically granular soil, ranging from silty sand to coarse gravel. Compacted cohesive backfill has also been used, especially in Asia and South America. Both nonwoven needle‐punched and heat‐bonded geotextiles and woven geotextiles have been employed as reinforcement. Wrapped‐face GRS reinforced soil walls have been constructed mostly in remote areas or as temporary walls; however, some have been for permanent applications in an urban setting. They have also been used commonly as the “stage‐1” wall in construction of a “two‐stage wall”, where the 2nd stage involves installing a permanent‐looking wall façade. Wrapped‐face GRS walls generally range in height from 1 m to 6 m, with taller walls being built mostly in Asia, where their faces are often vegetated. Figure 3.26 shows a very tall (21‐m high) vegetated face GRS wall in Japan and a partially vegetated face in Canada.
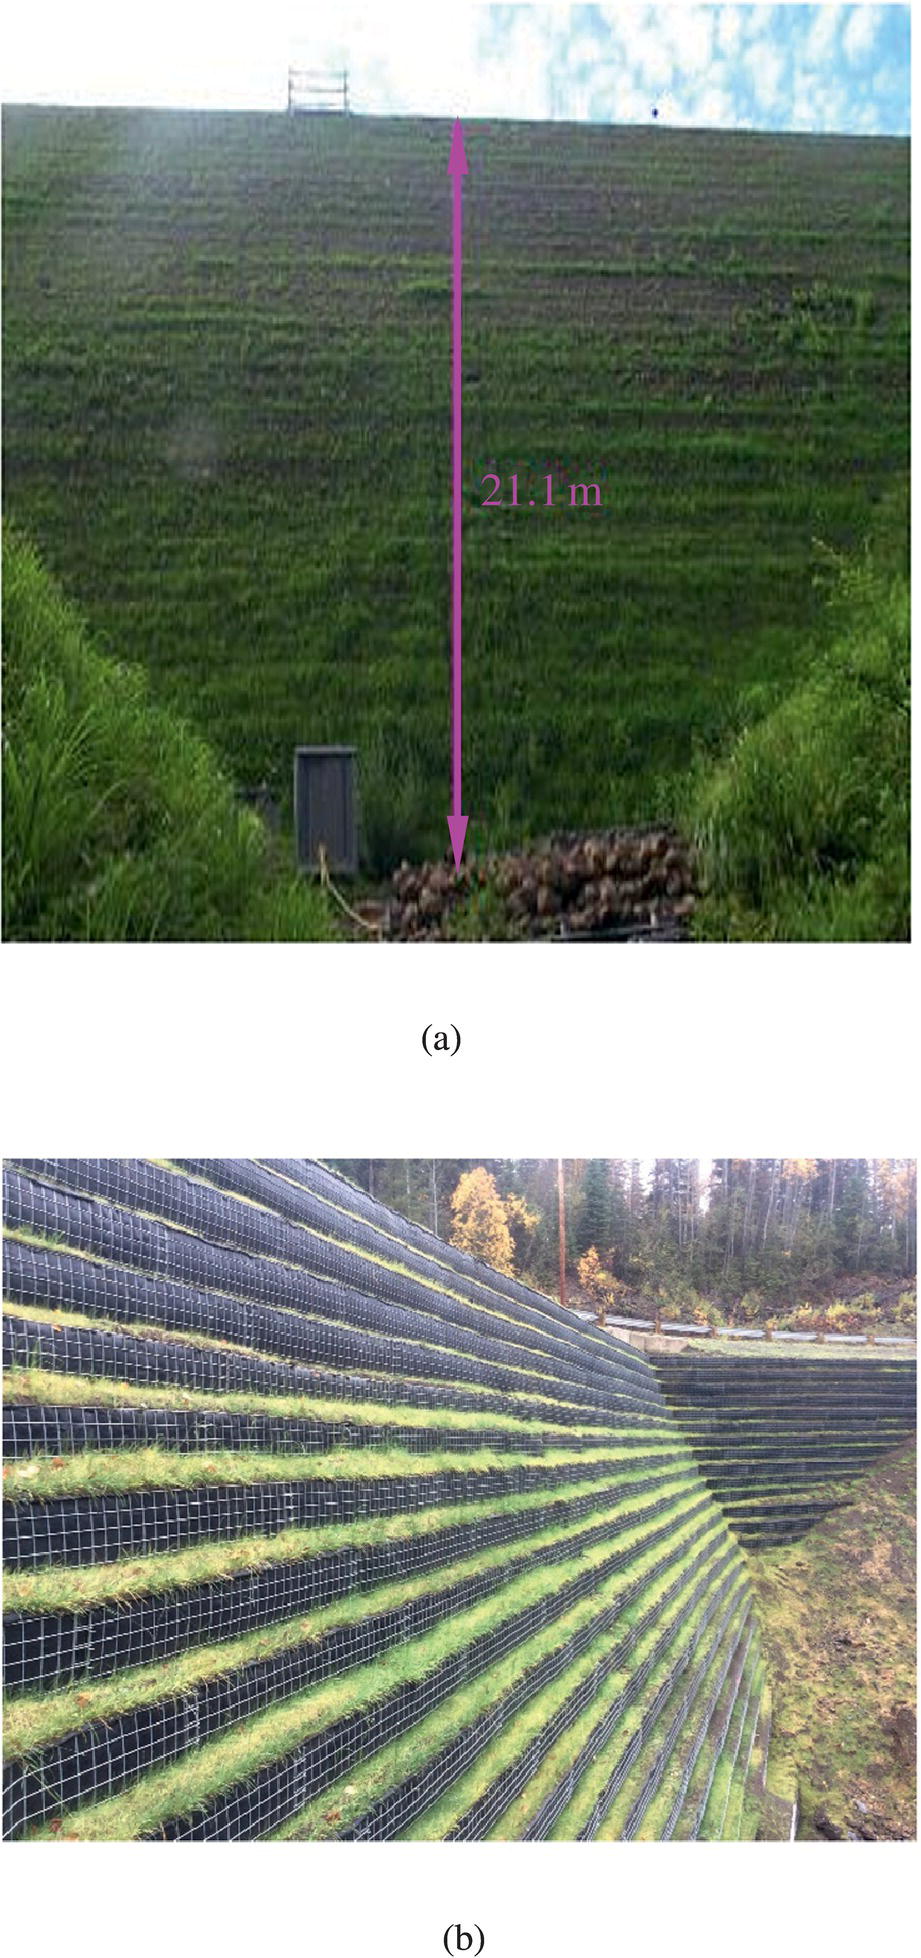
Figure 3.26 (a) A 21‐m high vegetated face GRS wall in Japan (courtesy of Fumio Tatsuoka) and (b) a partially vegetated face GRS wall in Canada
(courtesy of Calvin VanBuskirk)
Experiences distilled from construction of wrapped‐face GRS walls include the following:
- Wrapped‐face GRS walls are very economical and can be built by a general contractor.
- Wrapped‐face GRS walls do not exhibit any appreciable creep as long as the backfill is predominantly granular and is well‐compacted.
- The geosynthetic reinforcement in a wrapped‐face GRS wall can effectively generate apparent cohesion (see Section 3.3.1) for a cohesionless fill to assume a vertical slope while subject to common traffic loads. Figure 3.27 shows a photo of an unprotected vertical cut in a wrapped face wall five years after the cut was made.
- Wrapped‐face GRS walls can tolerate large differential settlement without visible distress.
- The facing of wrapped‐face GRS walls may experience significant deformation, especially if a weak reinforcement is employed or if the fill is not compacted well.
- A wrapped GRS wall face covered with asphalt products or shotcrete is not aesthetically appealing compared to other types of wall face.

Figure 3.27 A cut in the Glenwood Canyon geotextile wrapped‐face GRS test wall (sv = 9 in.); it remained unprotected five years after the cut was made
Most wrapped‐face GRS walls constructed to date have been designed based on the U.S. Forest Service method (see Section 5.4). Observation and field measurements of wall performance reveals that the design method is very conservative.
3.4.2 Concrete Block GRS Wall
Since being introduced in the mid‐1980s, concrete block reinforced soil walls have quickly become the most popular type of reinforced soil walls in North America. The configuration of a concrete block geosynthetic reinforced wall is seen in Figure 3.23. Figure 3.28 shows four completed concrete block GRS walls, including (a) a single tier concrete block wall transitioned into a three‐tier concrete block wall in DeBeque Canyon, Colorado, (b) a concrete block wall with its highest point standing 16.7 m (55 ft) tall in Grand County, Colorado, (c) a concrete block wall of multiple block colors in a rural setting, Winter Park, Colorado, and (d) a concrete block wall with a curved face in an urban setting, Centennial, Colorado.
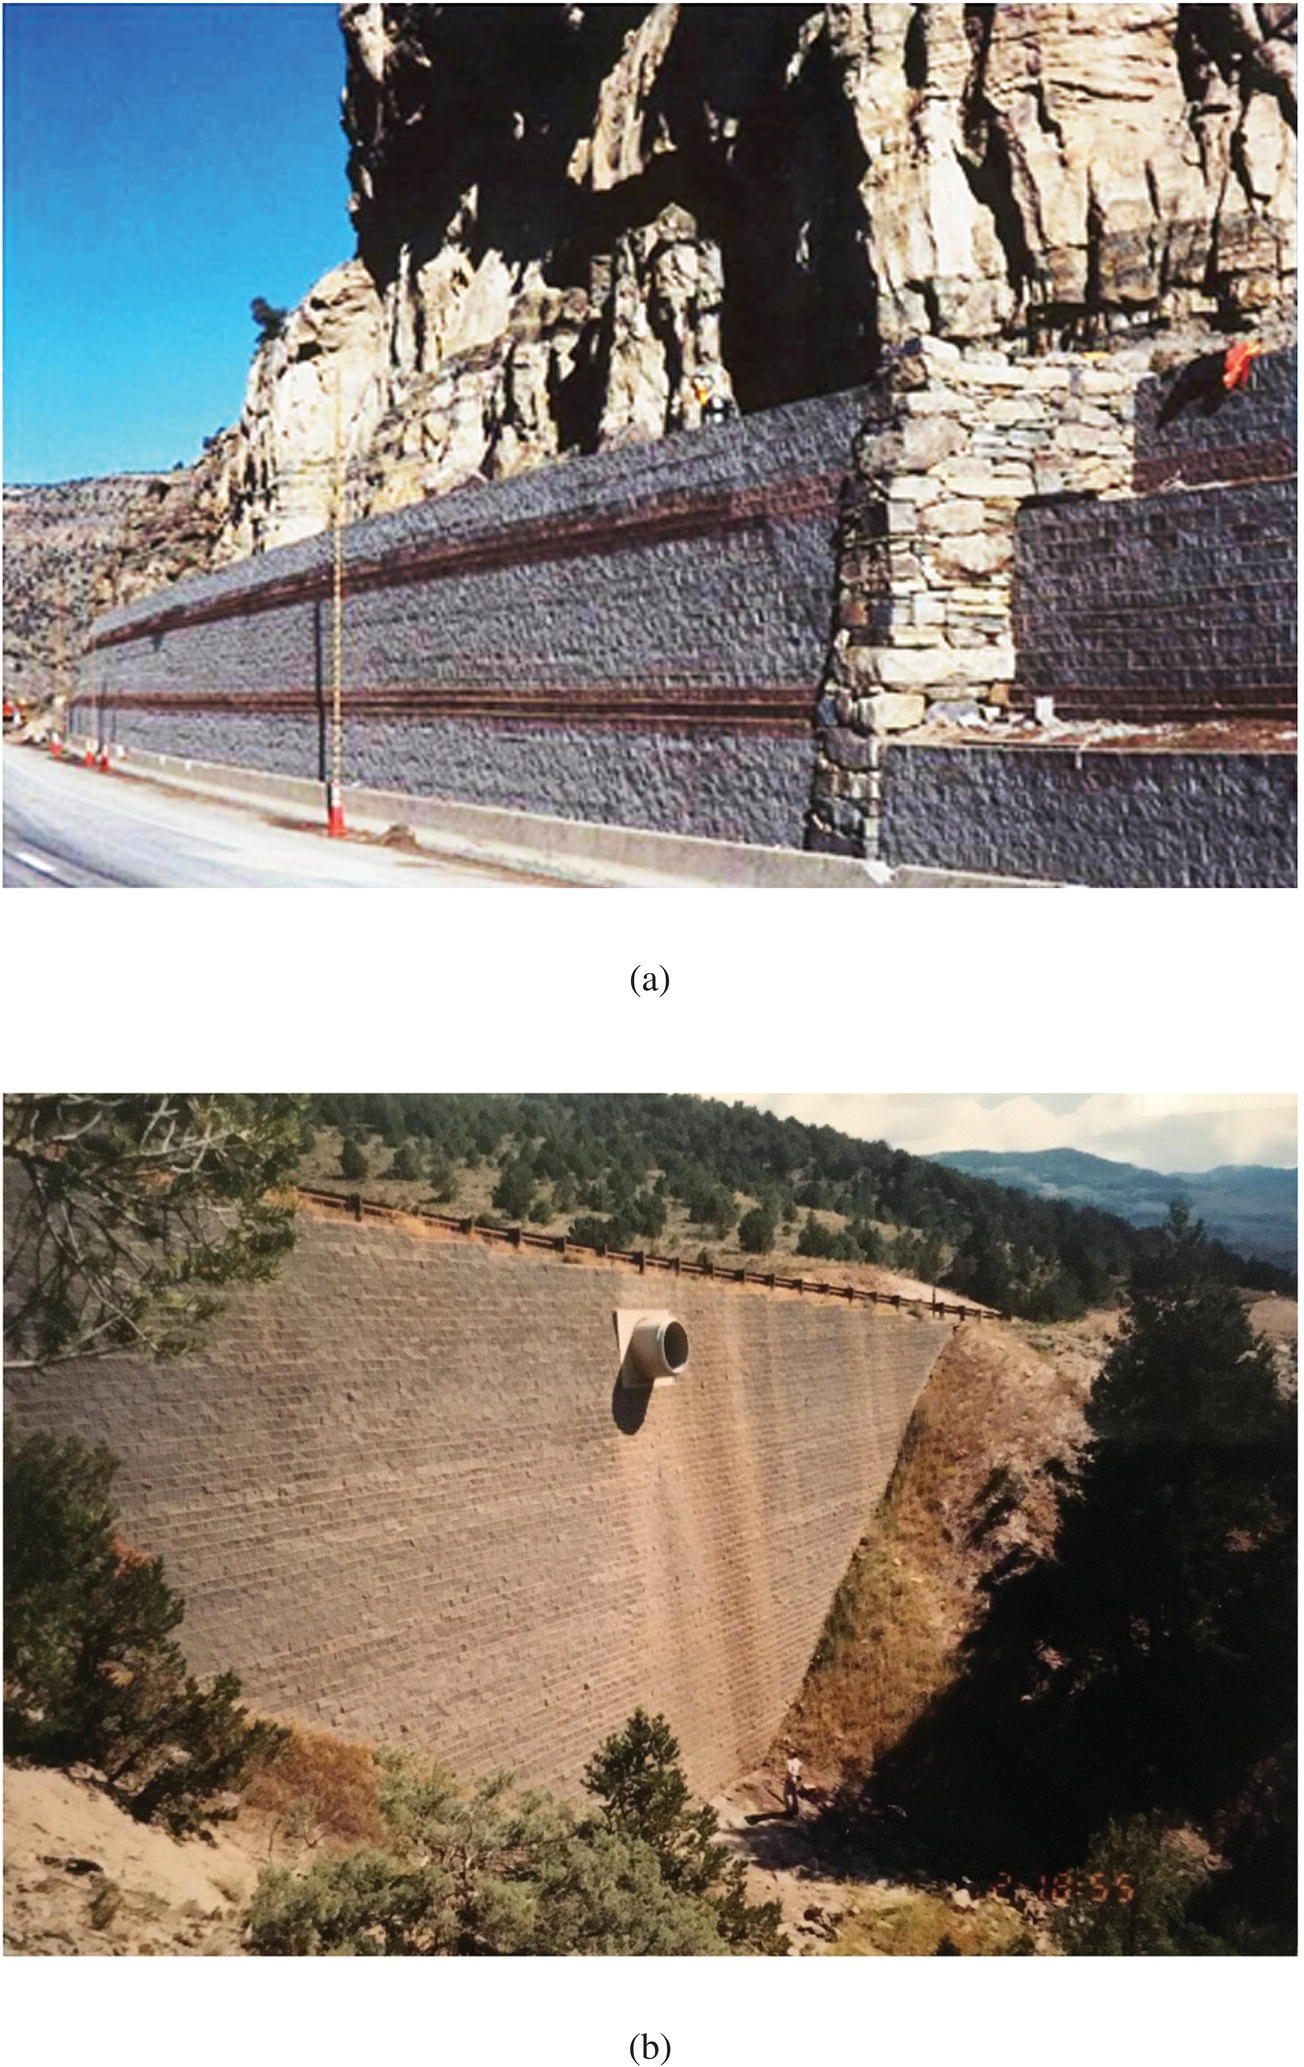
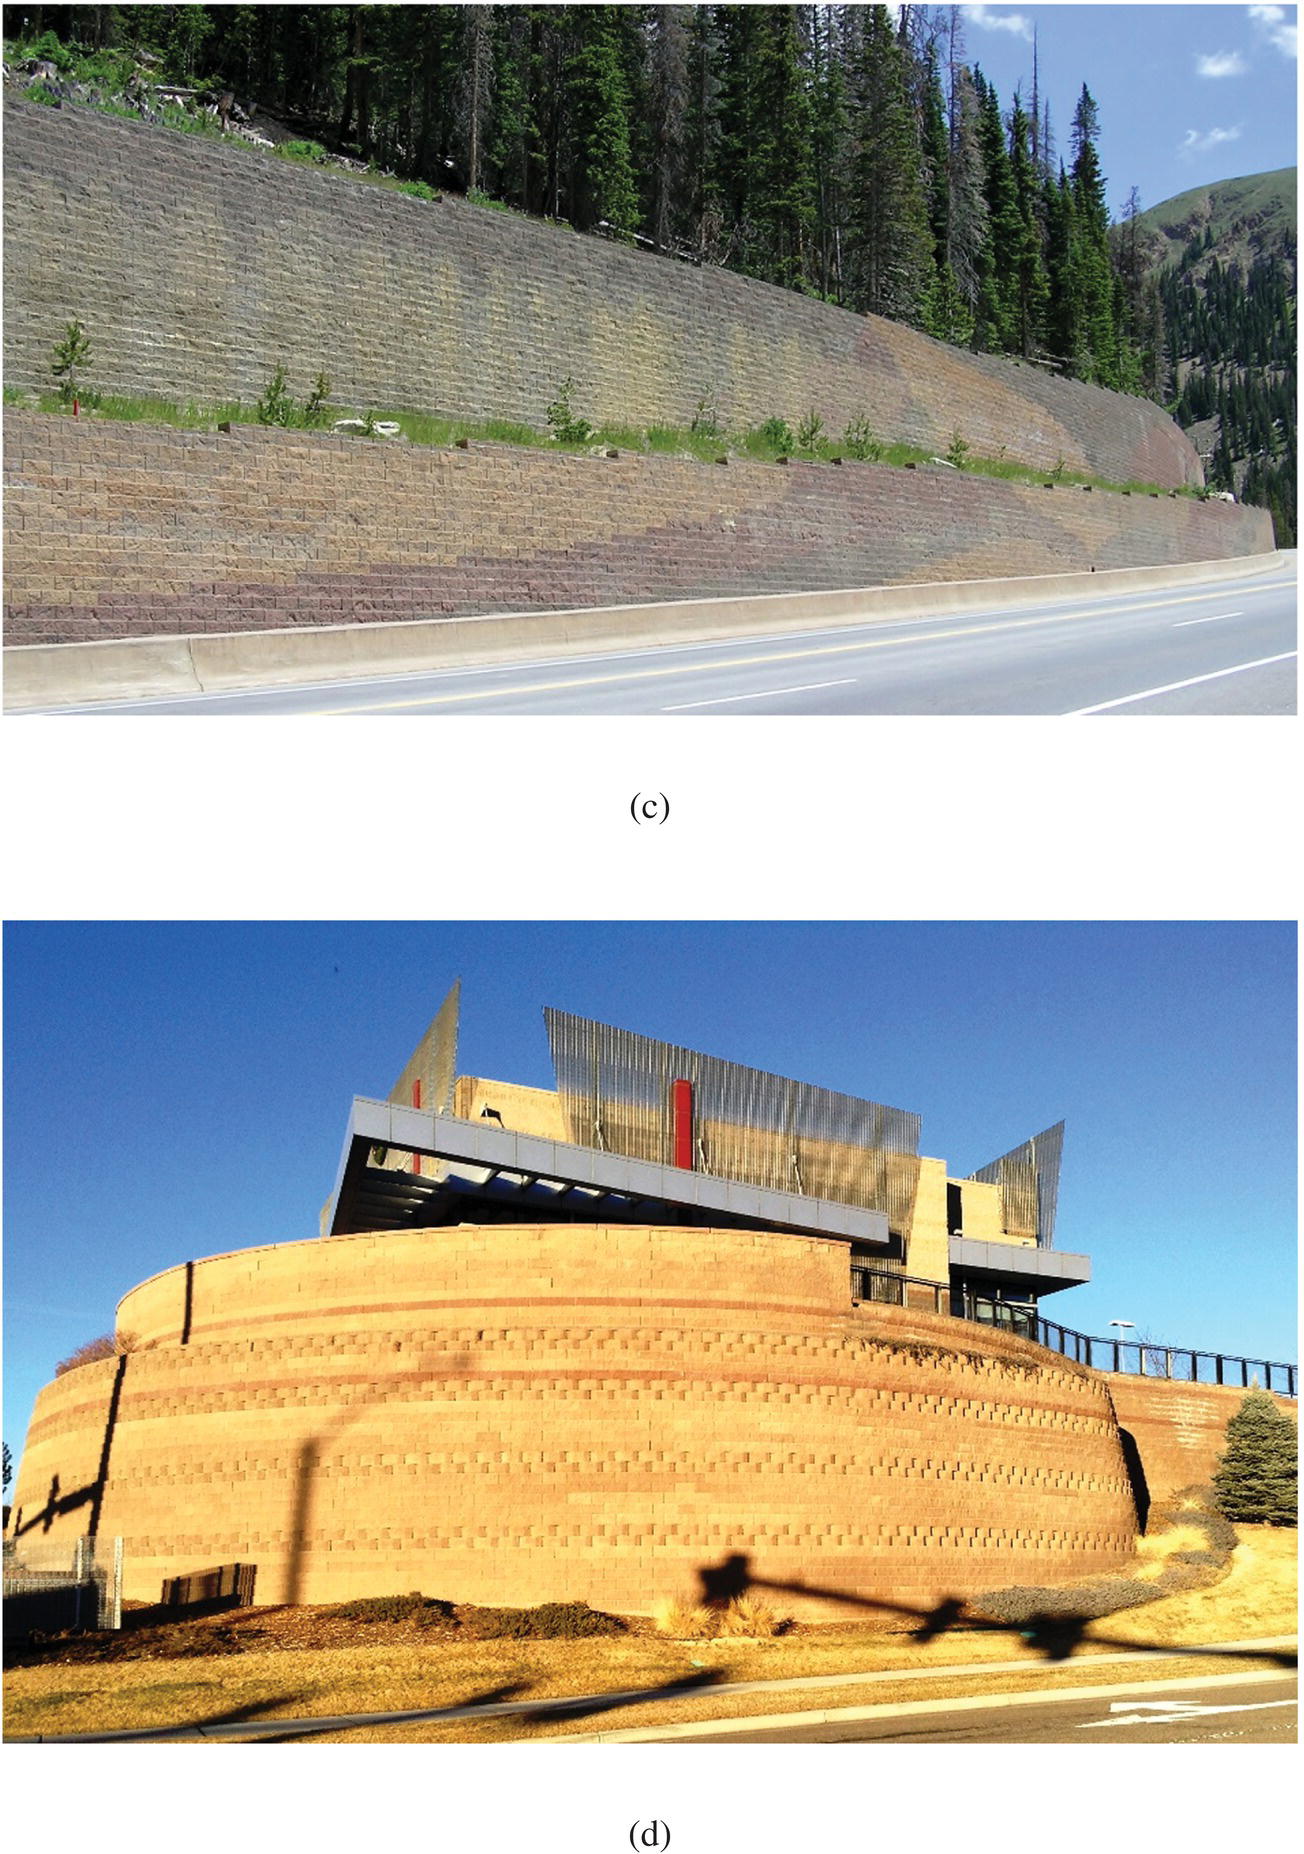
Figure 3.28 Examples of completed concrete block GRS walls: (a) a single‐tier concrete block wall transitioned into a three‐tier concrete block wall (courtesy of Bob Barrett), (b) a concrete block wall with the highest point standing 16.7 m tall (courtesy of Bob Barrett), (c) a concrete block wall in a rural setting, and (d) a curved‐face concrete block wall with SRW units in an urban setting
The facing of concrete block GRS walls is typically formed by dry‐stacking concrete blocks, which are usually made light and small enough to be handled by a worker with bare hands. The blocks may be dry‐ or wet‐cast machine molded, with the former being far more common. A variety of split face concrete masonry units (CMUs) and segmental retaining wall (SRW) units varying in size, shape, weight, color and texture are available commercially (see Figure 3.29). The most common dimensions of split face CMUs used in the construction of GRS walls are 410 × 200 × 200 mm (16 × 8 × 8 in.). SRW units, on the other hand, are concrete blocks specifically made for segmental retaining walls, typically ranging from 100 to 200 mm (4 to 8 in.) in height and 200 to 750 mm (8 to 30 in.) in width. CMU blocks cost about $1.50 per block, depending on the region and the cement content. SRW blocks, on the other hand, typically cost between $4.50 and $6.50 per block.
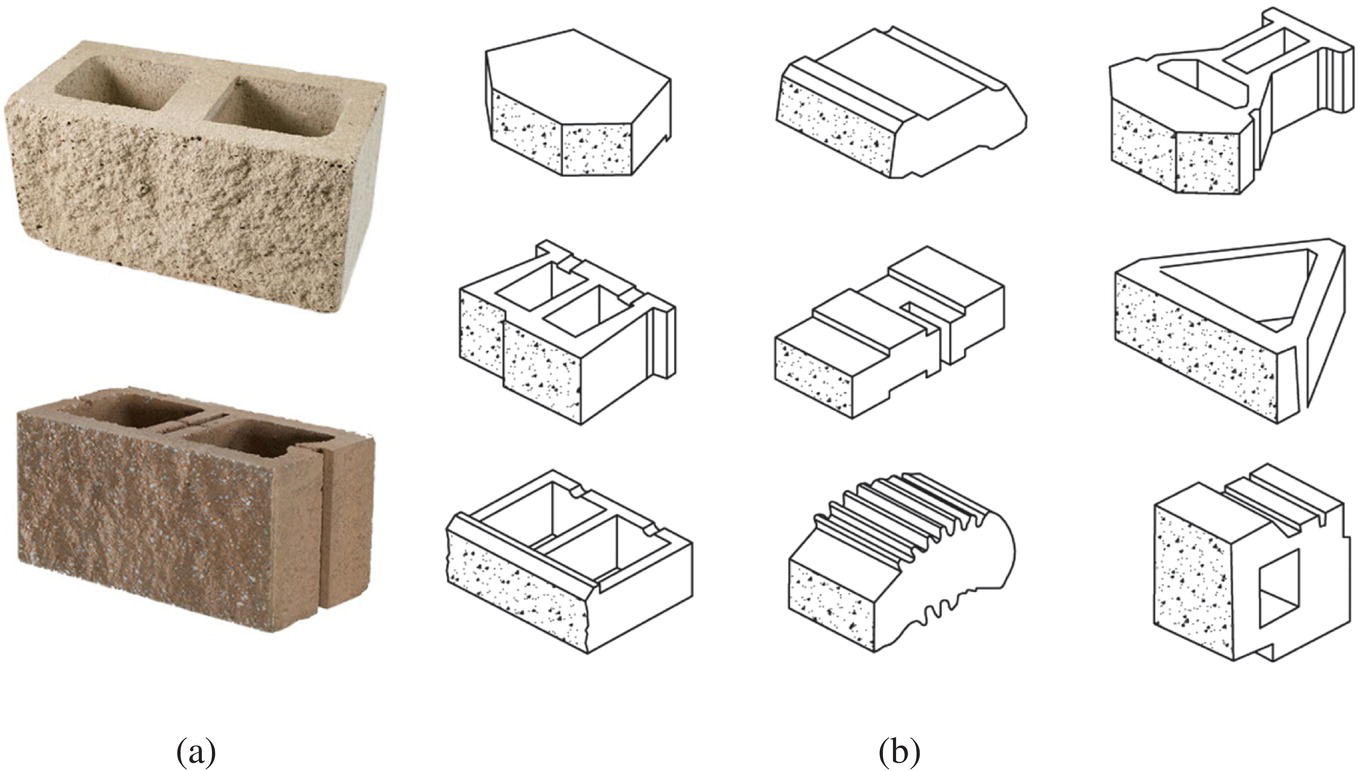
Figure 3.29 Concrete facing blocks: (a) examples of split face concrete masonry units (CMUs) and (b) examples of segmental retaining wall (SRW) units
((b) was modified after Bathurst and Simac, 1994)
Concrete blocks are either stacked vertically or at a small batter (usually less than 10° degrees from the vertical) to form the face of a concrete block GRS wall. Most concrete blocks have built‐in hollow cores/cells which may be filled with crushed stone or sand/gravel during construction to increase block weights. Some blocks have cast‐in lips or keys to help with facing alignment and to increase the bond strength between blocks. Geosynthetic reinforcement is usually sandwiched between vertically adjacent blocks through interface friction to connect the reinforced soil mass with the wall face. Some wall builders also install mechanical shear pins between blocks to help maintain facing alignment. The facing connection stability of concrete block walls is discussed in detail in Section 5.3.5.
When concrete block walls were first introduced to the wall industry, they were used mostly for landscaping, with typical wall height less than 2 m (6 ft). The use of geosynthetic inclusion, however, took the wall system to new heights because geosynthetic inclusion (especially when deployed on tight spacing) strengthens the backfill and reduces the lateral earth pressure. Concrete blocks, while providing a certain degree of local bending resistance, can be merely an architectural façade in an internally stabilized wall system (see opening statement of this chapter). Concrete block GRS walls typically range from 2 to 9 m (6 to 30 ft) in height, although walls over 20 m (65 ft) in height have been constructed without problems. Concrete block GRS walls are commonly built with a slightly battered face, although some wall builders consider the batter of little practical value. When the total height of a wall exceeds about 6 m (20 ft), most concrete block GRS walls are built in tiers.
In addition to the advantages for all GRS walls noted in Section 3.1, concrete block GRS walls enjoy the distinct advantage of being rather aesthetically pleasing. A combination of a concave face and the rough textured finish (“split face”) of concrete blocks (see Figure 3.28(a) to (c)) can help mask minor construction misalignment. Both CMUs and SRW units of different colors, textures, shapes, and sizes can be used to improve the aesthetic appeal of a GRS wall (see Figure 3.28). CMU blocks can be cut to fit or the block tails broken off to accommodate tight curves. Specially‐made narrow SRW units also serve the same purpose.
Material and engineering costs for concrete block GRS walls typically range from $5 to $10 per square foot of wall face (or $50 to $100 per square meter of wall face), excluding the cost of fill material. Not unlike other GRS walls, judicious use of on‐site soils may be permitted for construction of concrete block GRS walls, although it is generally not recommended especially if the on‐site soil is cohesive or poorly drained. Construction of concrete block GRS walls is addressed in Section 6.1.1.
3.4.3 Cast‐in‐Place Full‐Height Facing GRS Wall
Beginning in the mid‐1980s, Fumio Tatsuoka at the University of Tokyo and researchers at the Japan Railway Technical Research Institute jointly developed a GRS wall system with cast‐in‐place full‐height rigid facing (Tatsuoka et al., 1992, 1997). This system is herein referred to as the cast‐in‐place full‐height facing (CIP‐FHF) GRS wall system.
Figure 3.30 shows the detailed construction sequence of a CIP‐FHF system. The construction involves two major stages. In the 1st stage, a wrapped‐face GRS wall, with layers of geosynthetic inclusion approximately 0.3H to 0.4H (H = wall height) in length on 0.3 m spacing (typical), is erected using stacked gravel‐filled gabions as temporary facing. This temporary wrapped‐face GRS wall is allowed to deform under its own weight (Step 5, Figure 3.30). In the 2nd stage, full‐height rigid concrete facing (cast‐in‐place) is constructed over the temporary face of the GRS wall (Step 6, Figure 3.30). The rigid concrete facing is securely attached to the reinforced soil mass via protruded steel anchors that are embedded in the reinforced soil mass during the 1st stage construction (Step 4, Figure 3.30). Figure 3.31 shows photos of CIP‐FHF systems soon after the 1st stage construction, in‐service condition, and 15 years after being in service.
When rigid facing is employed in a GRS wall, a major problem is with mobilization of loads in the reinforcement, as the rigid facing will restrain lateral deformation and inhibit the reinforcing function. This problem is resolved by the CIP‐FHF system, which involves a two‐stage construction procedure. Reinforcement loads in the system are mobilized during 1st stage construction before installation of cast‐in‐place facing in the 2nd stage.

Figure 3.30 Construction sequence of the cast‐in‐place full‐height facing (CIP‐FHF) GRS wall
(modified after Tatsuoka, 2008)
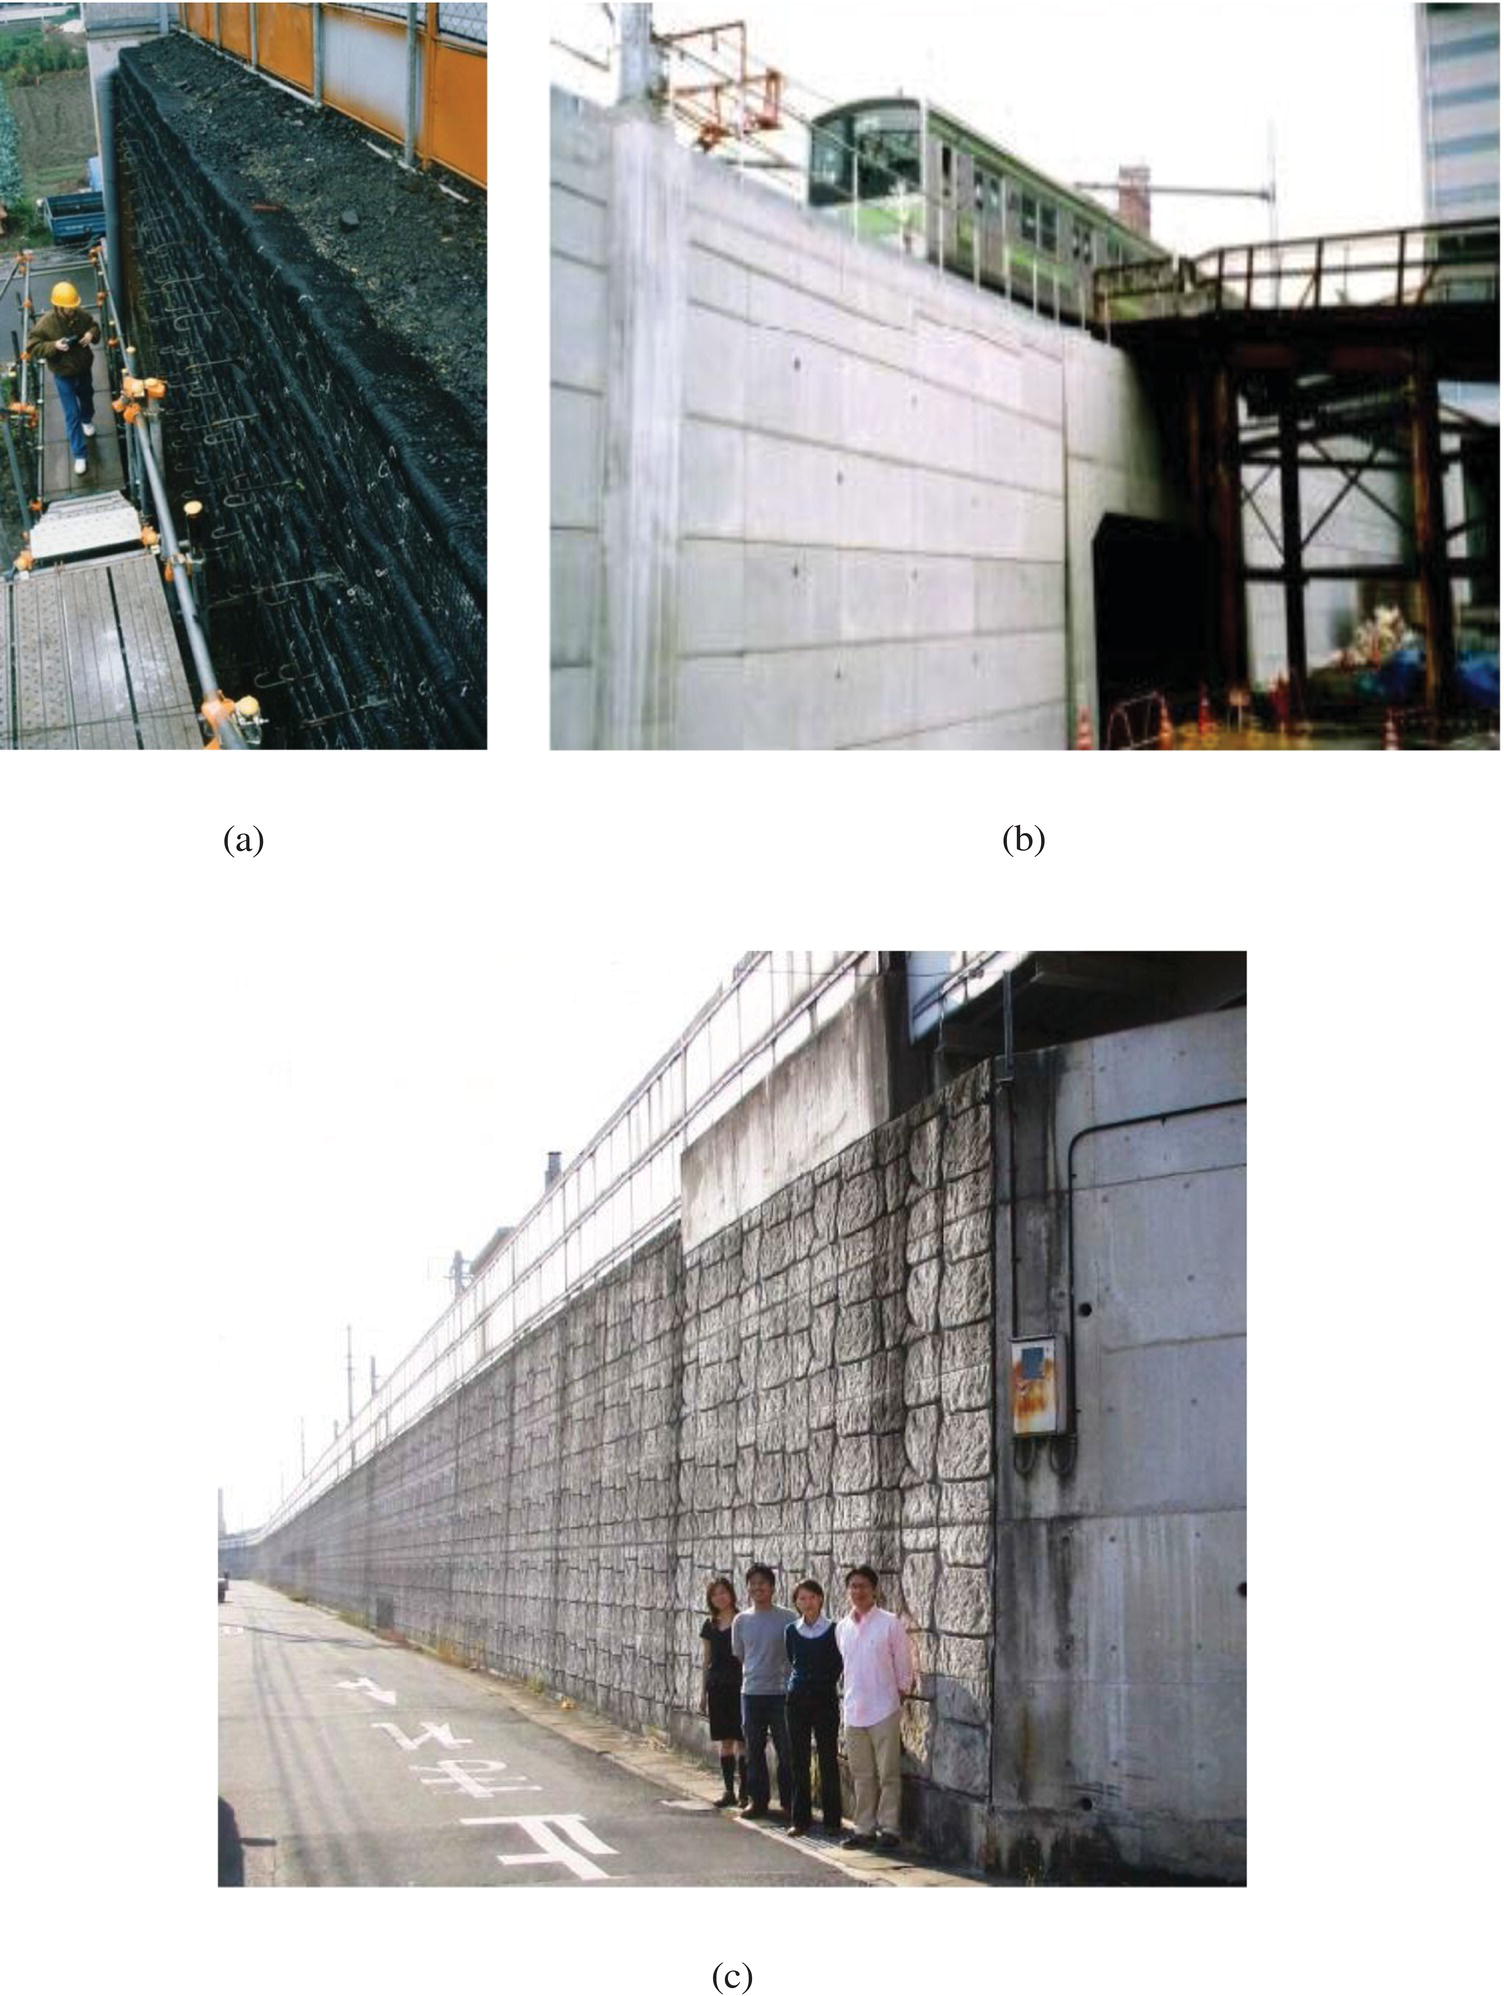
Figure 3.31 The CIP‐FHF GRS wall system: (a) completion of the 1st stage of construction (stacked gravel‐gabions temporary GRS wall with hooked steel bars protruding from wall face), (b) in‐service condition (carrying the Yamanote‐sen, a busy train line in Tokyo, Japan), and (c) a CIP‐FHF GRS wall 15 years after putting into service
(courtesy of Fumio Tatsuoka)
Since the temporary GRS wall in the 1st stage construction has deformed under its self‐weight, the lateral earth pressure exerted on a completed cast‐in‐place full‐height facing is negligible. This allows the wall system to withstand much greater subsequent external loads, including seismic loads due to earthquakes. The rigid facing, in combination with the tight connection between the reinforced soil mass and the facing, also serves to increase lateral stress in the soil mass hence increase stiffness and strength of the soil behind the facing.
Due to its superior capability to withstand earthquakes and prolonged heavy rainfalls, the CIP‐FHF system became the default retaining wall type in Japan Railway’s wall repertoire. Figure 3.32 shows a CIP‐FHF GRS wall before and after the 1995 Kobe earthquake, which measured 7.9 on the Richter scale. The wall’s capability to survive major earthquakes is evident. As of 2008, over 120 km of CIP‐FHF walls had been built for railway embankments in Japan with great success (Tatsuoka, 2008). In other parts of the world, however, the CIP‐FHF system has seen few applications, primarily because of cost considerations and longer construction time.
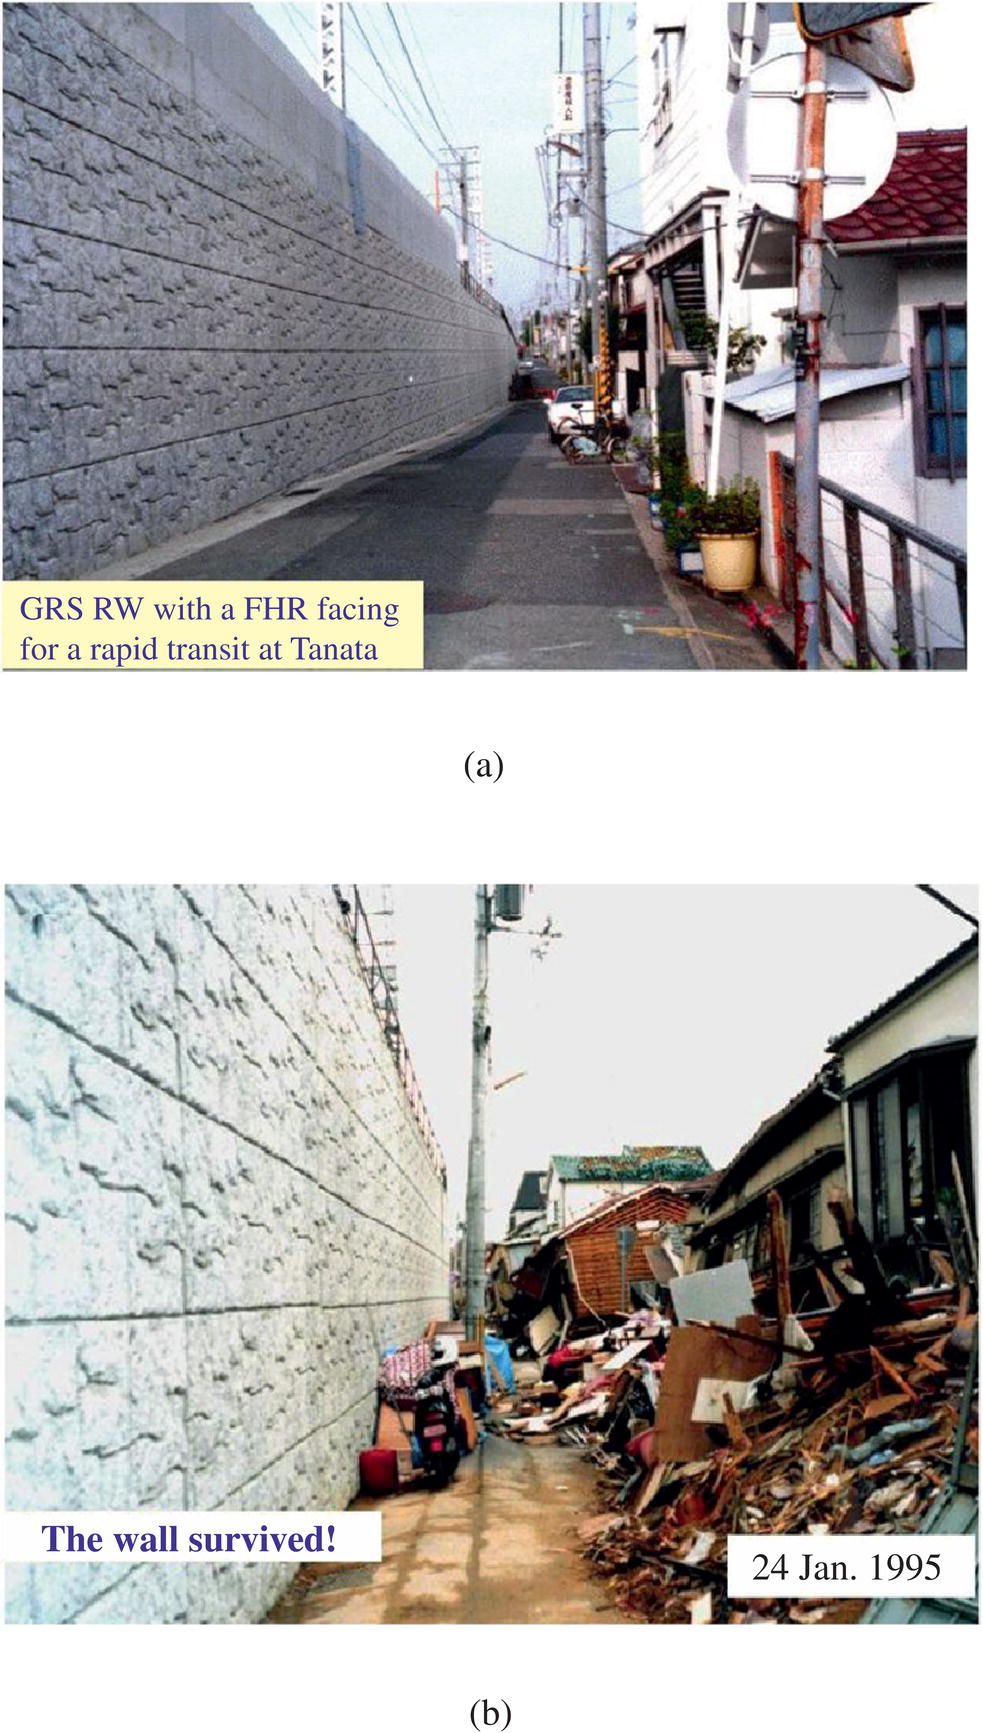
Figure 3.32 A cast‐in‐place full‐height facing (CIP‐FHF) GRS wall: (a) in 1992, after the wall was put into service, and (b) in 1995, after the Kobe earthquake, which measured 7.9 on the Richter scale
(courtesy of Fumio Tatsuoka)
3.4.4 Precast Full‐Height Panel Facing GRS Wall
In 1996, the Colorado Department of Transportation (CDOT) developed a new reinforced soil wall system with full‐height precast panel facing, referred to as an independent full‐height facing (IFF) reinforced soil wall. An IFF reinforced soil wall system, as shown schematically in Figure 3.33, comprises three major components: (i) precast full‐height reinforced concrete facing panel, (ii) reinforced soil mass, and (iii) flexible face anchor. The face anchor serves to connect the first two components, i.e., facing panels and reinforced soil mass, into an integral system. In this system, the connection needs to allow outward movement of the facing panel to take place during construction (hence, referred to as “flexible” face anchors). In the absence of this feature, the reinforcement in the reinforced soil mass would hardly be able to mobilize any loads, and would serve hardly any reinforcing function. Also, since outward movement of the facing panel is allowed during construction, a mechanism for adjusting the final positions of the panels must be in place so that the panels can be aligned in the final phase of the construction.
Figure 3.33 Schematic diagram of an independent full‐height facing (IFF) GRS wall (Ma and Wu, 2004)
An IFF reinforced soil wall, locally known as the Fox wall, was constructed in 1996 along the entrance ramp from Interstate‐25 to Interstate‐70. The wall was an extension of an existing cantilever reinforced concrete retaining wall, of which the facing had the appearance of full‐height grooved concrete. For aesthetic reasons, the GRS wall must bear the same appearance as the existing wall, hence full‐height facing was needed. The total cost of an IFF reinforced soil wall system was estimated to be about half the cost of a conventional reinforced concrete cantilever wall on piles. The decision to go with the IFF reinforced soil wall system, however, was not based on cost, rather it was because little or no excavation would be needed for construction of an IFF wall system. This is important for two reasons. First, the wall was situated along a very busy section of Interstate‐25, so minimal excavation meant minimal traffic disruption. Second, the subsoil on the project site was found to have been contaminated in the past. Excavation of the contaminated soil, if needed, would have involved laborious laboratory testing and securing permits, and would likely have resulted in undue delay. Since construction, the Fox wall has performed very satisfactorily.
To construct an IFF reinforced soil wall, the facing panels are first erected at a slight batter in a shallow trench with the aid of temporary bracing. The reinforced soil mass is then constructed behind the facing with inclusion of tensile reinforcement layers on prescribed spacing. Face anchors are installed at pre‐selected elevations to attach facing panels to the reinforced soil mass. The temporary bracing is removed after the facing panels have been securely attached to the reinforced soil mass. The final step of construction involves adjusting the positions of the facing panels to achieve proper alignment. Construction of IFF reinforced soil walls is discussed in more detail in Section 6.1.3. Figure 3.34 shows two photos of the Fox wall during construction. Figure 3.35 shows the Fox wall in a service condition.
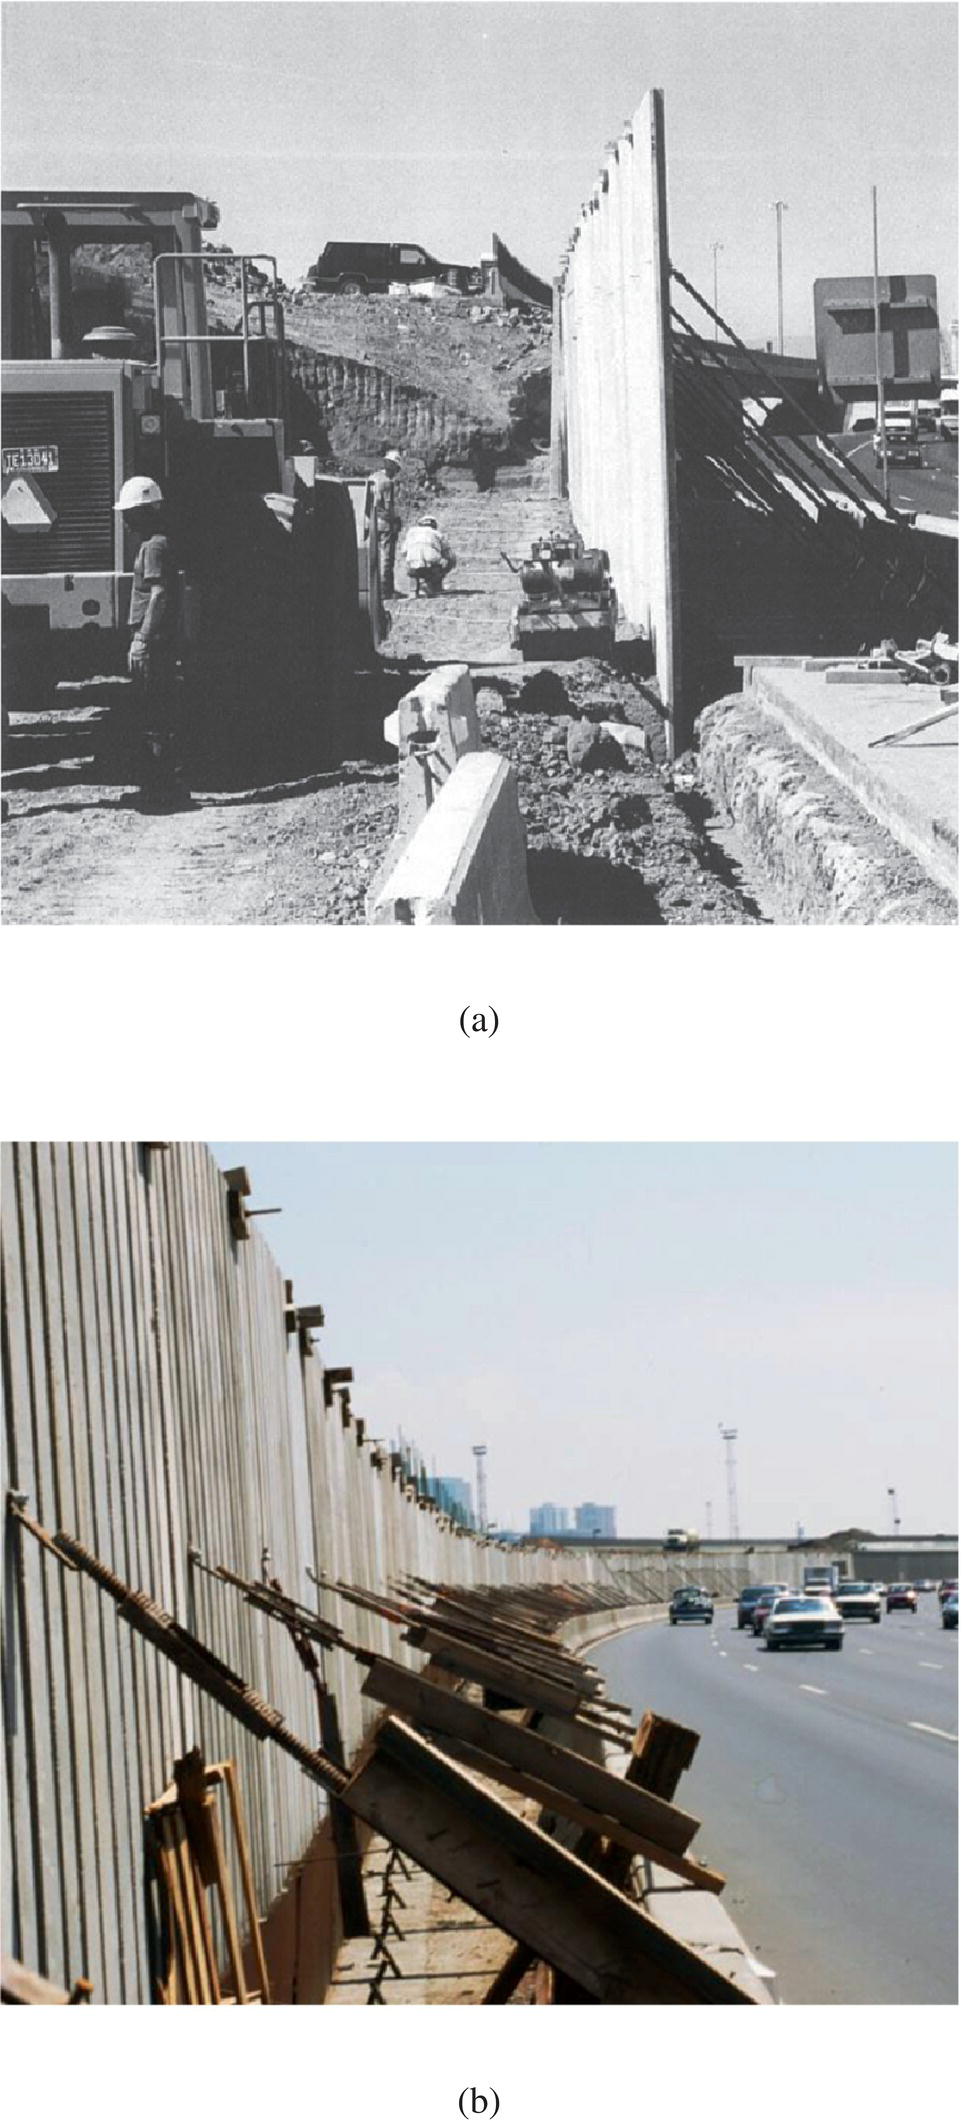
Figure 3.34 An IFF reinforced soil wall, known locally as the “Fox wall”: (a) during construction, with facing panels positioned in a shallow trench, and (b) temporary bracing in front of the facing panels; note that traffic remained open during construction (Ma and Wu, 2004)
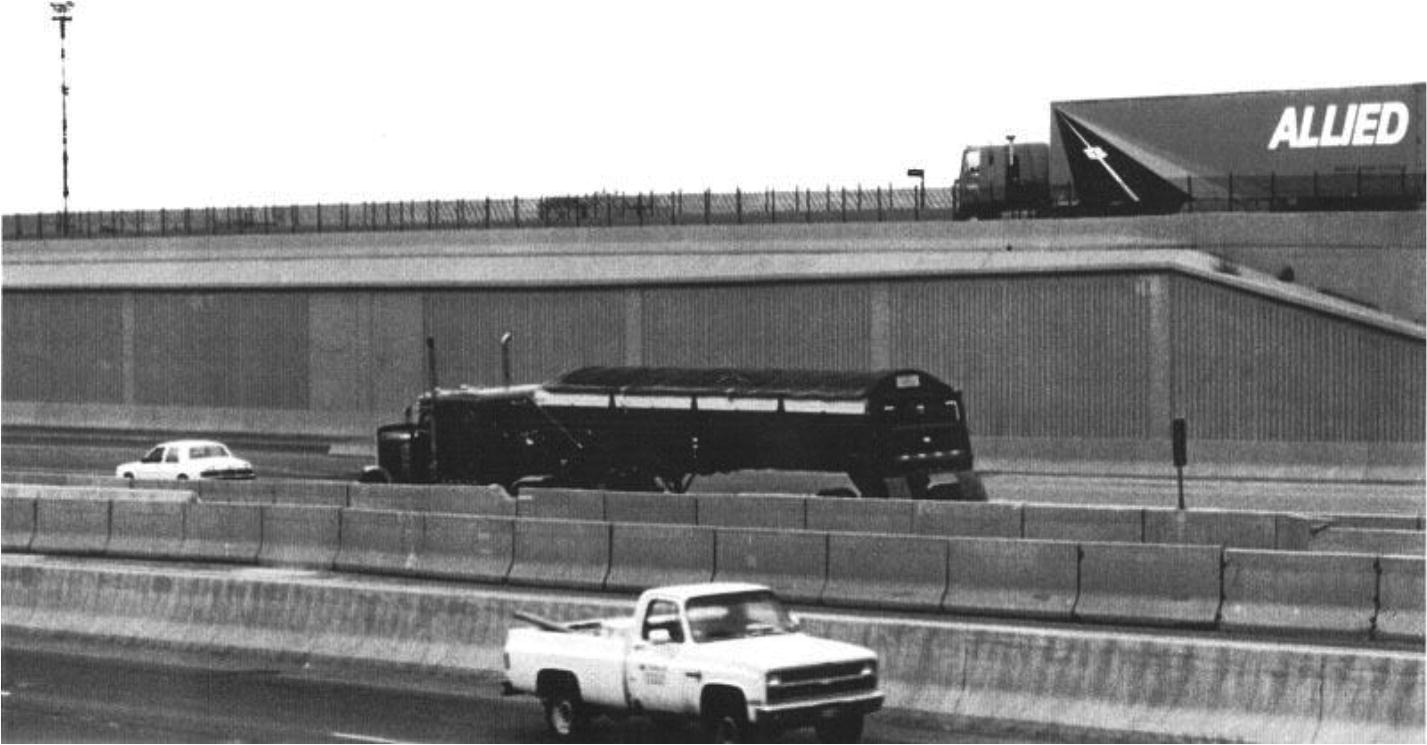
Figure 3.35 The completed Fox wall, an IFF reinforced soil wall along Interstate‐25 (Ma and Wu, 2004)
The IFF reinforced soil wall system is under‐used in the repertoire of reinforced soil walls. The IFF system offers a few distinct advantages over conventional cantilever reinforced concrete retaining walls, including the following:
- The full‐height facing gives the appearance of a strong and permanent structure.
- Construction of IFF reinforced soil walls is relatively rapid; it does not require any on‐site concrete formwork or piles.
- Construction of IFF reinforced soil walls requires no over‐excavation, hence little traffic disruption during construction.
- IFF reinforced soil walls are low in cost. The total cost of an IFF GRS wall is comparable to that of a concrete block GRS wall, and is about half the cost of a conventional cantilever reinforced concrete retaining wall on piles.
3.4.5 Timber Facing GRS Wall
A GRS wall system with timber facing was developed in the early 1980s by the U.S. Forest Service. In areas where timber logs can be obtained economically, timber facing GRS walls may be the least expensive wall type. Figure 3.36 shows two completed timber facing GRS walls, one in an urban setting and the other in a rural setting. The facing of the GRS wall is made of wooden timber logs that serve as temporary forming and also as final facing. All the timber logs need to be preservative‐treated, and are inter‐connected behind the facing by forming elements (e.g., plywood boards) with nails, as shown in Figure 3.37. Geosynthetic reinforcement is attached to the facing between forming elements and timber logs, and with a “tail” folding flat toward the back of wall. The inter‐connected timber facing offers both local and (small) global bending stiffness. Construction of timber facing GRS walls is discussed in Section 6.1.4.
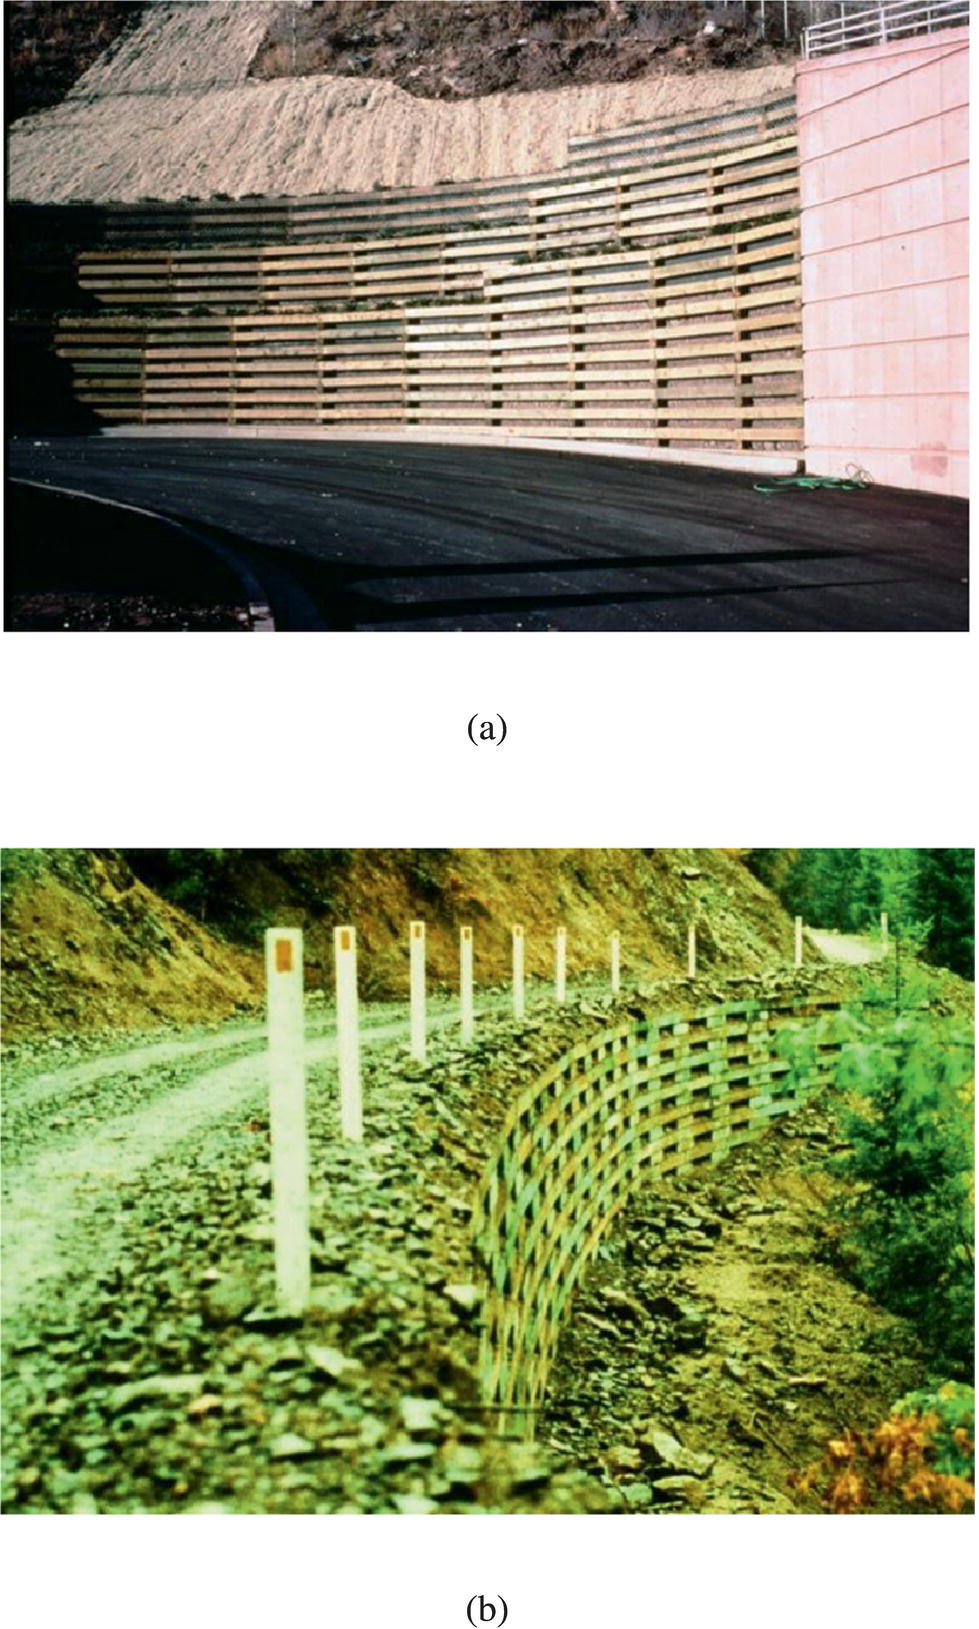
Figure 3.36 Timber facing GRS walls: (a) in an urban setting (courtesy of Bob Barrett) and (b) in a rural setting (courtesy of Gordon Keller)
Figure 3.37 Inter‐connected timber logs of a timber facing GRS wall
Timber facing GRS walls that have been constructed to date are typically less than 6 m (20 ft) in height. Higher walls are commonly built in tiers, which allow room for planting in the setback area and enhance aesthetics. A wide variety of soils, ranging from granular soil to low‐quality clayey soil, have been used as backfill. Various geosynthetics, including woven geotextiles, nonwoven geotextiles, and geogrids, have been used as reinforcement.
Timber facing GRS walls have been researched rather extensively. In 1991, two 2.8‐m (9.2‐ft) high timber facing geotextile reinforced soil walls (known as the Denver test walls), one with a cohesive backfill and the other a granular backfill, were constructed and load‐tested under well‐controlled conditions in the laboratory. The reinforcement was a light‐weight (3 oz/yd2) nonwoven heat‐bonded polypropylene geotextile on 0.28‐m (11‐in.) vertical spacing (Wu, 1992a,b). The test walls were featured in the International Symposium on Geosynthetic‐Reinforced Soil Retaining Walls, in which researchers were invited to predict wall behavior. The material properties, construction, measured behavior, and predictions of the two walls were documented (Wu, 1992c). A few highlights of the test wall are as follows:
- With a very weak geotextile as reinforcement, the surcharge pressure at failure for the granular‐backfill wall was 200 kPa (29 psi), and for the cohesive‐backfill wall was slightly over 230 kPa (33 psi). Available design methods for GRS walls predicted surcharge pressures at failure (i.e., for factor of safety = 1.0) ranging from 0 (i.e., the wall cannot be erected) to 50 kPa (7.3 psi) for the granular‐backfill wall, much lower than the measured value (Claybourn and Wu, 1992). None of the design methods allows cohesive backfill. Additional details about how measured behavior compared to design methods as well as their implications are given in Section 5.2.
- The cohesive‐backfill wall is at least as strong as the granular‐backfill wall provided that the moisture of the soil is kept relatively constant (at 2% wet of optimum in this case).
- Neither wall exhibited appreciable creep deformation under 103 kPa (15 psi) surcharge, typical traffic load used in design.
Timber facing geosynthetic reinforced walls have shown satisfactory performance in actual construction. Wu (1994) reported applications of timber facing GRS walls in Colorado, including the use of double‐sided walls as rock fall barriers developed by wall builder Bob Barrett.
Timber facing GRS walls offer a number of advantages over other types of GRS walls, including the following:
- With timber being a natural material, timber facing GRS walls have the distinct advantage of a natural appearance, as compared to GRS walls with concrete facing.
- Where there is abundant supply of timber logs, a timber facing GRS wall is usually the least expensive wall type.
- Construction of timber facing GRS walls is simple and rapid; there is no requirement for an external forming system for construction. The wall can be built by a general contractor.
- Timber facing GRS walls can withstand fairly large settlement and differential settlement without hindering their function.
- The lifespan of the timber facing tends to dictate the service life of the wall system. When the timber is properly treated, the design life of a timber facing wall can be around 50 years.
3.4.6 Other Types of GRS Walls
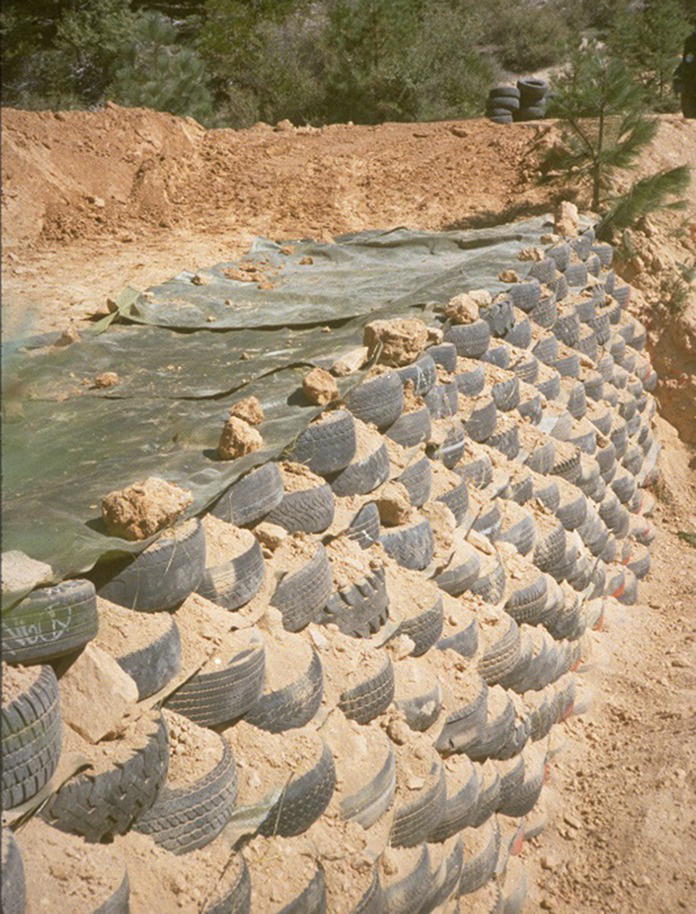
In addition to the five wall types described in Sections 3.4.1 to 3.4.5, a number of reinforced soil walls (both GMSE walls and GRS walls) with different facing systems have been constructed. Examples of such walls are rock facing GRS walls, articulated panel facing GRS walls, tire facing GRS walls, welded wire mesh facing GRS walls, and gabion facing GRS walls, as shown in Figures 3.38 to 3.42, respectively. Note that the latter two wall types are sometimes constructed as the first‐stage wall of a two‐stage wall system, with the second stage often being concrete panel facing.
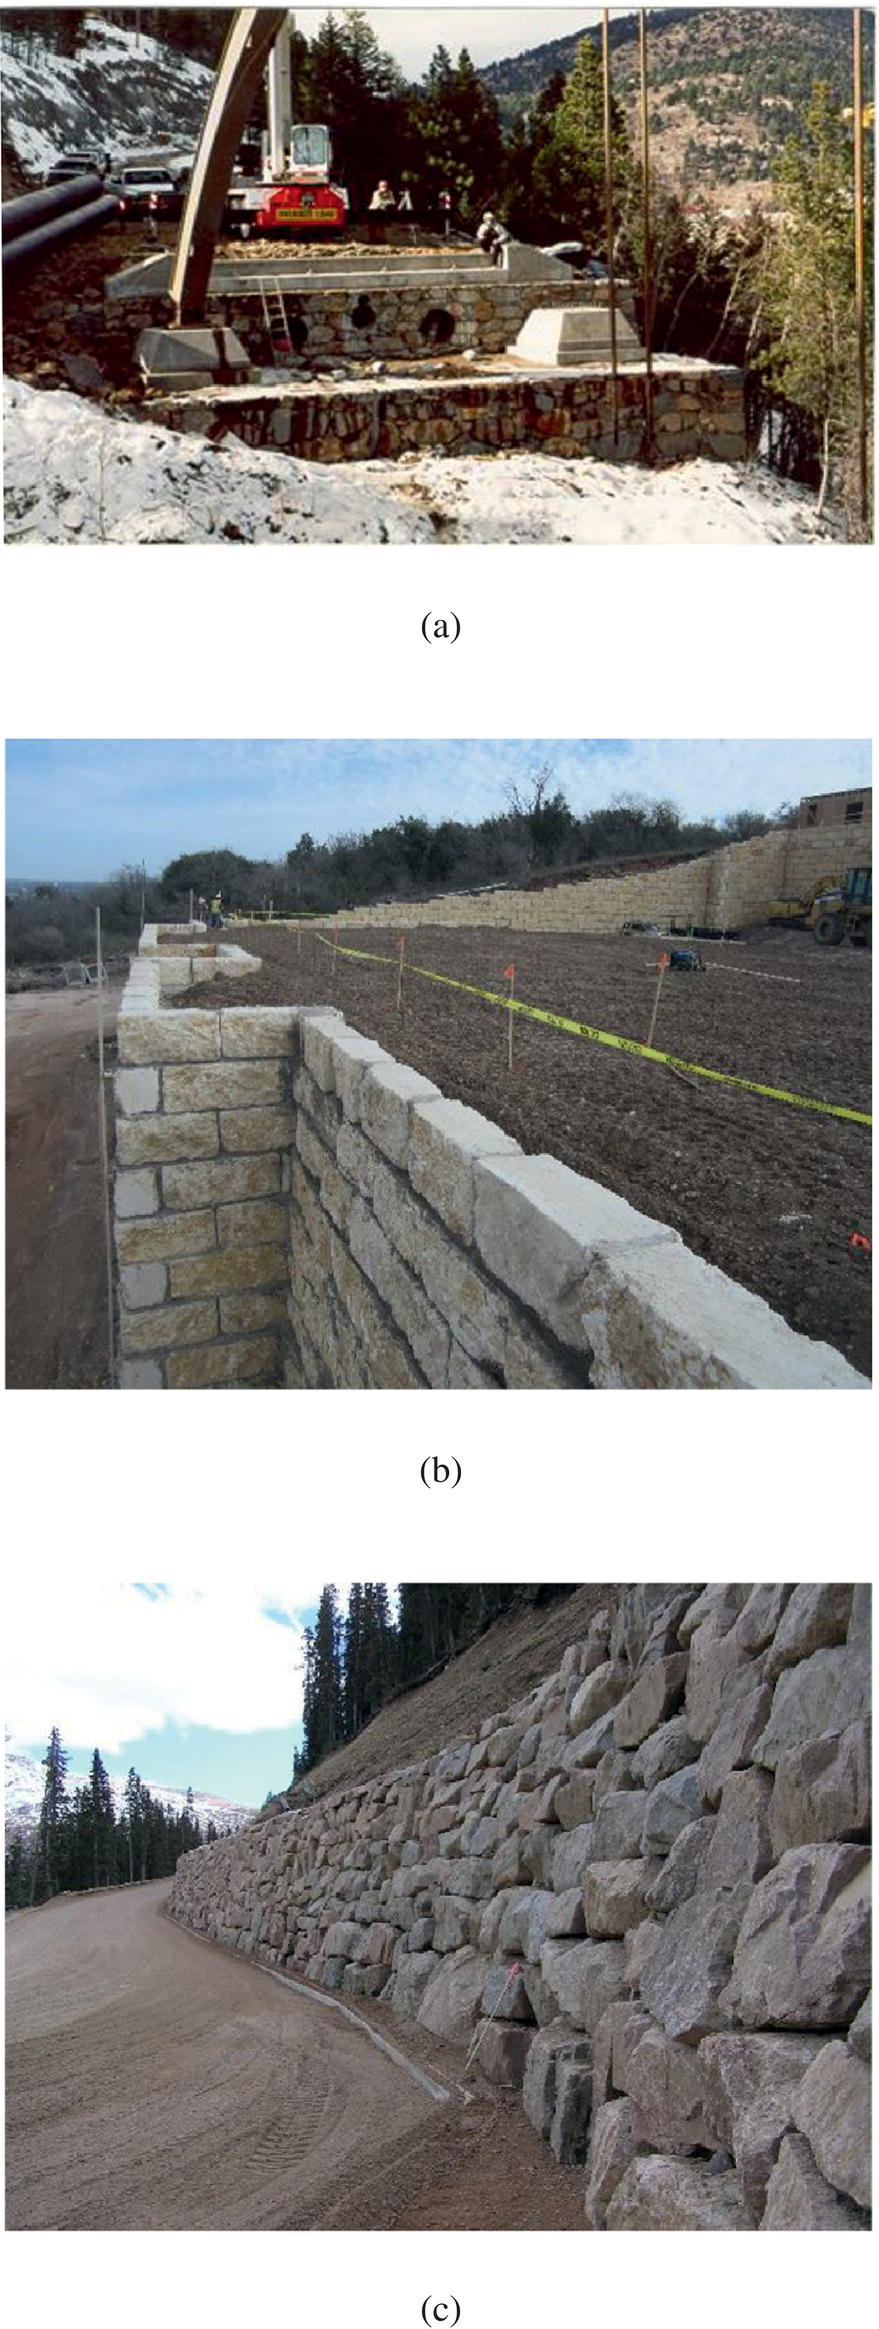
Figure 3.38 Rock facing GRS: (a) bridge abutment, (b) limestone block facing wall
(courtesy of Geosolutions, Inc.), and (c) rockery

Figure 3.39 (a) An articulated panel facing reinforced soil wall during construction and (b) articulated panel facing as the façade of a gabion facing wall during construction
(courtesy of Tensar International Corporation)
(courtesy of Gordon Keller)
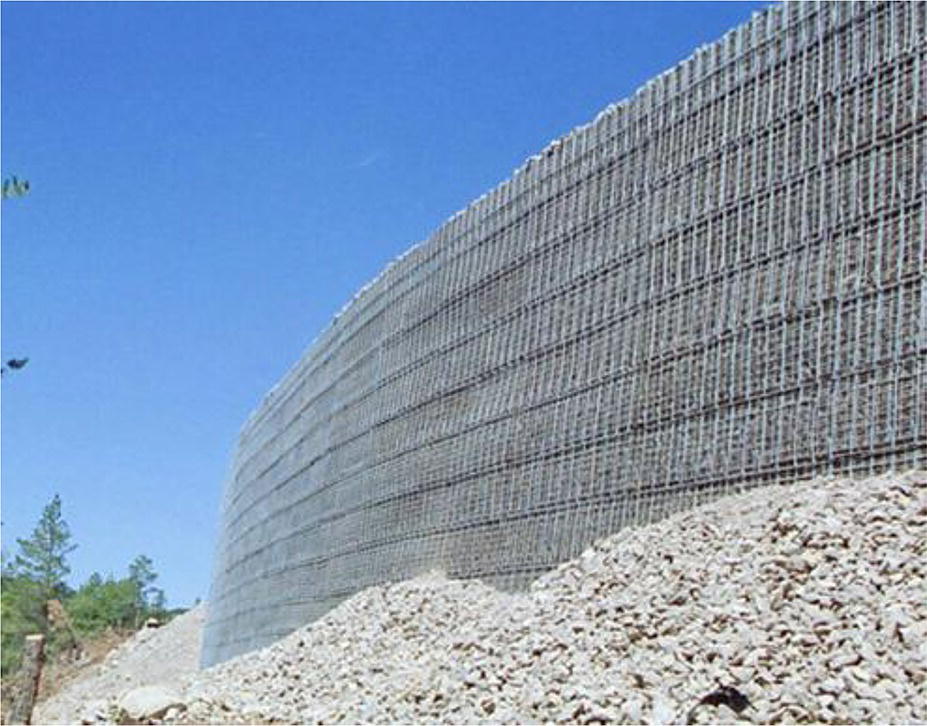
Figure 3.41 Welded wire mesh facing wall
(courtesy of Hilfiger Retaining Walls).

Figure 3.42 Gabion facing walls with metal wire baskets
(courtesy of NAUE, Germany)
3.5 Advantages and Disadvantages of Different Types of GRS Walls
In this section we shall discuss the advantages and disadvantages of wrapped‐face geotextile reinforced soil walls, concrete block GRS walls, and timber facing GRS walls. Note that the terms “advantages” and “disadvantages” have to be addressed in a relative sense. We will begin by addressing the advantages and disadvantages of wrapped‐face GRS walls relative to conventional earth retaining walls. Wrapped‐face GRS walls are then used as a baseline when addressing the advantages and disadvantages of GRS walls with other types of facing.
3.5.1 Wrapped‐Face GRS Walls
Advantages
Wrapped‐face GRS walls have demonstrated the following advantages over conventional reinforced concrete walls:
- Construction of wrapped‐face GRS walls is rapid and requires no heavy construction equipment.
- Wrapped‐face GRS walls are inherently flexible, hence can tolerate larger differential settlement without visible distress.
- When properly designed and constructed and with well‐compacted granular fill, wrapped‐face GRS walls have high load‐carrying capacity (see Figure 3.43, where a wrapped‐face GRS composite with bed sheets as reinforcement and a road base as fill material is seen to be able to carry 22 “Jersey barriers” made of solid concrete; no time‐dependent deformation was observed), and exhibit high ductility (i.e., can deform considerably without sudden collapse).
- Wrapped‐face walls do not require embedment into the foundation soil, thus eliminate the need for sub‐excavation. This feature is especially important when environmental constraints are present. Potential damage to adjacent steams and root systems due to excavation can also be avoided to protect natural environments.
- High‐quality granular backfill, although highly preferred, is not mandatory for the construction of wrapped‐face GRS walls.
- A wide variety of geosynthetics with different stiffness/strength and costs are readily available and can usually be easily transported to remote construction sites; geosynthetics are free from corrosion problems and generally have strong resistance to bacterial action.
- Other than reinforcing, geotextiles can serve multiple functions, e.g., facilitate drainage of fill material, preserve soil integrity, and maintain separation of different soils during construction and under repeated external loading (see Section 4.1 for further discussion).
- The overall cost of wrapped‐face GRS walls is low. In many applications, it has proven to be the lowest cost of all reinforced soil walls.
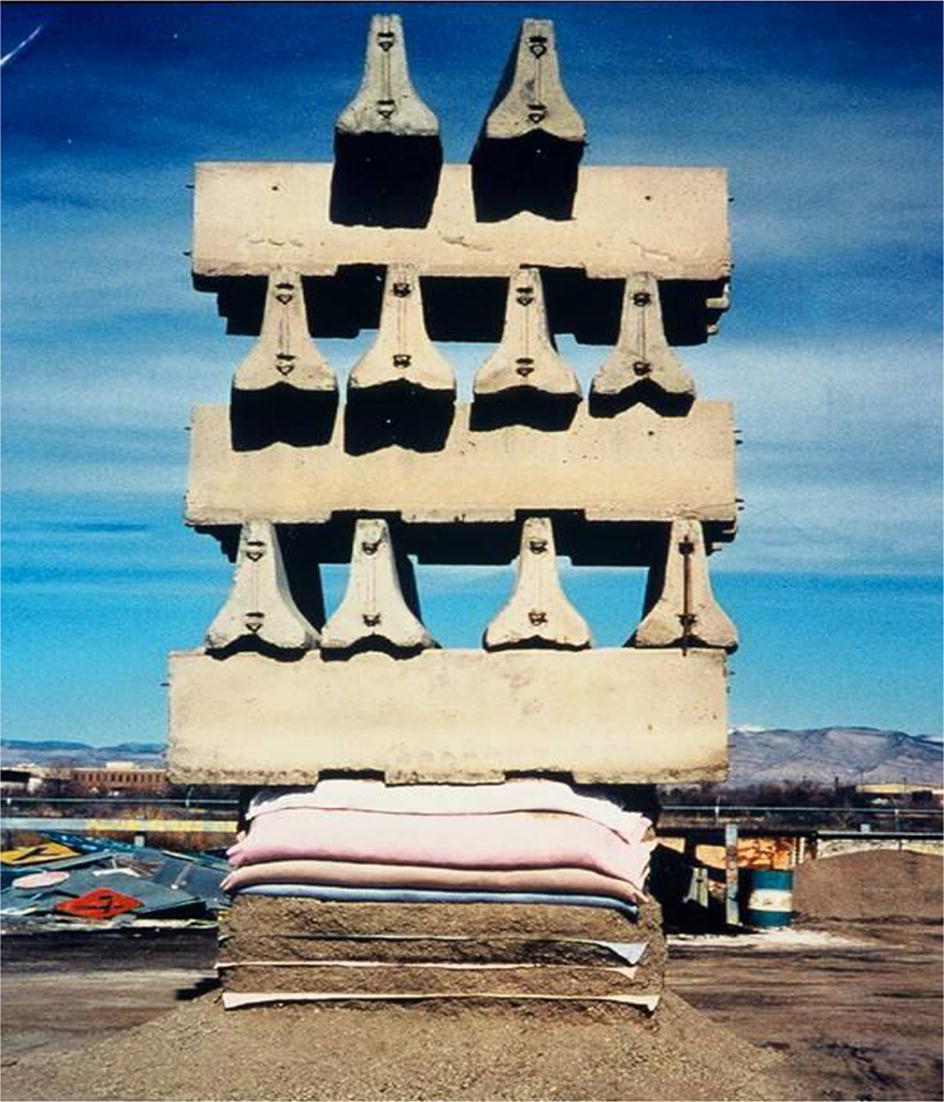
Figure 3.43 A GRS mass with bed sheets (purchased from J.C. Penny) as reinforcement was able to carry 22 Jersey barriers; no noticeable time‐dependent deformation was observed
(courtesy of Bob Barrett)
Disadvantages
Wrapped‐face GRS walls have a number of disadvantages compared to conventional reinforced concrete retaining walls:
- Wrapped‐face GRS walls lack the appearance of a permanent structure. When the face is covered with asphalt products or shotcrete, it is less than aesthetically pleasing.
- Wrapped‐face GRS walls may experience appreciable deformation, especially if a weak geotextile reinforcement is employed or if the fill is not well compacted.
- Some geotextiles are susceptible to chemical degradation and may deteriorate when exposed to UV lights for an extended period of time (say, more than a few days).
3.5.2 Concrete Block GRS Walls
Advantages
In addition to all the advantages of wrapped‐face geotextile reinforced walls described in Section 3.5.1, concrete block GRS walls offer a few advantages:
- A concrete block wall face is durable and can be aesthetically appealing. Concrete block GRS walls generally give the perception of a more “permanent” structure.
- A wide variety of concrete blocks with different sizes, shapes, weights, textures, and colors are readily available as facing units of GRS walls (see Figure 3.29).
- Concrete block GRS walls can be easily adapted to situations where fairly sharp curves in the longitudinal direction are needed or desired.
- Since concrete blocks offer high local compressive and some bending resistance, the deformation of concrete block GRS walls is typically much smaller than that of wrapped‐face GRS walls.
- When very small reinforcement spacing (say 0.1 m or 4 in.) is used, it promotes better compaction near the face of the wall hence improved performance near the wall face, which is especially important for GRS bridge abutments (Adams, personal communication).
Disadvantages
Concrete block GRS walls can overcome most of the disadvantages of wrapped‐face GRS walls described in Section 3.5.1, especially problems with aesthetics and deformation. However, close attention and control of facing block placement is required for concrete block GRS walls to avoid misalignment or uneven batter of the wall face. Effloresence (mineral salts leached from soil and concrete to the surface; see Figure 3.44) will leave stains on a concrete wall face if not properly treated. In addition, concrete block facing may experience problems with deterioration within a few years after it is put into service. Figure 3.45 shows an example of severe block deterioration. The cause of such deterioration, which has been seen to occur in both SRW blocks and CMU blocks, may be multi‐fold, including insufficient cement content, poor quality control, reactive aggregates, etc. Adherence to specifications for the use of concrete blocks as facing units of GRS walls is needed. Moreover, proper control of surface runoff to direct the runoff away from the wall face is a key requisite.

Figure 3.44 Mineral salts leached onto the surface of concrete blocks
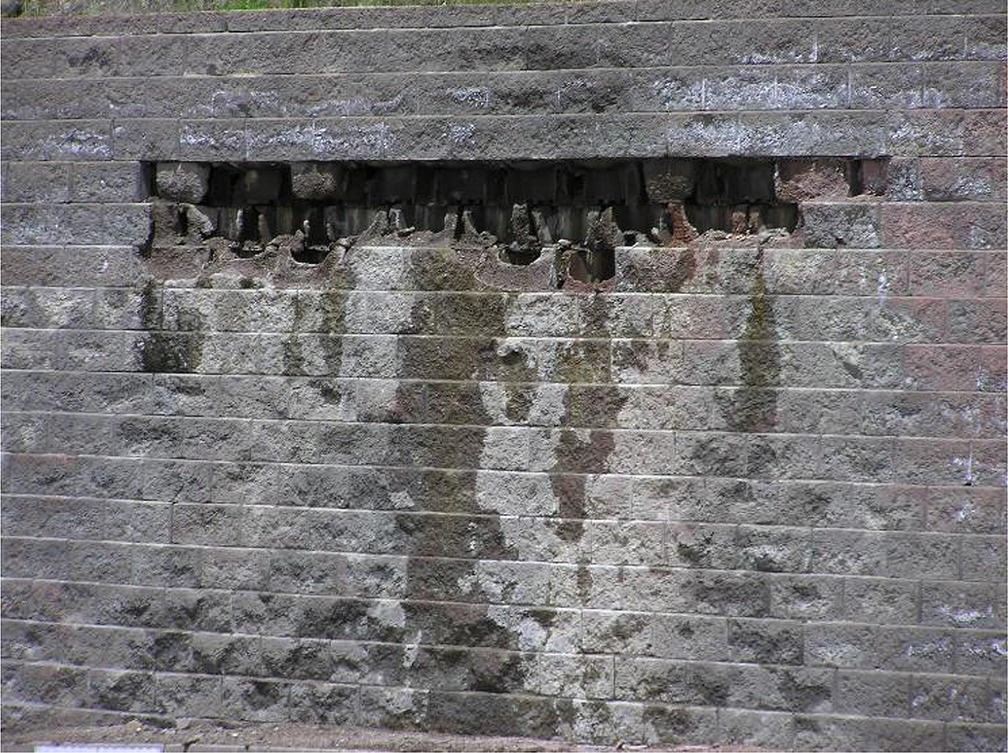
Figure 3.45 Deterioration of concrete block facing
3.5.3 Timber Facing GRS Walls
Advantages
In addition to all the advantages of wrapped‐face GRS walls described in Section 3.5.1, timber facing GRS walls offer a few advantages, including the following:
- Construction is simple and rapid as there is no requirement for external forming work for wall construction.
- Timber facing has a natural appearance and can be very aesthetically pleasing.
- Where timbers are readily available, timber facing GRS walls are inexpensive.
- Since timber facing offers a moderate degree of local and global compressive and bending resistance, the deformation of timber facing GRS walls is typically smaller than that of wrapped‐face GRS walls.
Disadvantages
Timber‐facing GRS walls share the disadvantages of wrapped‐face GRS walls described in Section 3.5.1. In addition, they also suffer from the following drawbacks:
- Timber must be acquirable at a reasonable cost to make it a cost‐effective wall system.
- The lifespan of the timber facing tends to dictate the wall’s service life. When timber is not treated properly, the facing can deteriorate within only a few years.
References
- Adams, M.T., Lillis, C.P., Wu, J.T.H., and Ketchart, K. (2002). Vegas Mini Pier Experiment and Postulate of Zero Volume Change. Proceedings, Seventh International Conference on Geosynthetics, Nice, France, pp. 389–394.
- Adams, M.T., Ketachart, K., and Wu, J.T.H. (2007). Mini Pier Experiments – Geosynthetic Reinforcement Spacing and Strength as Related to Performance. Proceedings, Geo‐Denver 2007, ASCE, Denver.
- Adams, M.T., Nicks, J., Stabile, T., Wu, J.T.H., Schlatter, W. and Hartmann, J. (2011a). Geosynthetic Reinforced Soil Integrated Bridge System Interim Implementation Guide. Report No. FHWA‐HRT‐11‐026, Federal Highway Administration, McLean, Virginia, 169 pp.
- Adams, M.T., Nicks, J., Stabile, T., Wu, J.T.H., Schlatter, W. and Hartmann, J. (2011b). Geosynthetic Reinforced Soil Integrated Bridge System Synthesis Report. Report No. FHWA‐HRT‐11‐027, Federal Highway Administration, McLean, Virginia.
- Aggour, M.S. and Brown, C.B. (1974). The Prediction of Earth Pressure on Retaining Walls Due to Compaction. Geotechnique, 24(4), 489–502.
- Athanasopoulos, G.A. (1993). Effect of Particle Size on the Mechanical Behavior of Sand‐Geotextile Composite. Geotextiles and Geomembranes, 12, 255–273.
- Bassett, A.K. and Last, N.C. (1978). Reinforcing Earth below Footings and Embankments. Proceedings, ASCE Spring Convention and Exhibit, Pittsburgh, Pennsylvania.
- Bathurst, R.J. and Simac, M.R. (1994). Geosynthetic Reinforced Segmental Retaining Wall Structures in North America. Proceedings, Fifth International Conference on Geotextiles, Geomembranes and Related Products, Singapore, pp. 1–41.
- Berg, R.R. Christopher, B.R., and Samtani, N.C. (2009). Design of Mechanically Stabilized Earth Walls and Reinforced Soil Slopes, Design & Construction Guidelines. Report No. FHWA‐NHI‐00‐043. Federal Highway Administration, 394 pp.
- Bolton, M.D. (1991). Geotechnical Stress Analysis for Bridge Abutment Design. Transportation Research Laboratory Contractor Report, London, 270 pp.
- Broms, B.B. (1971). Lateral Earth Pressure due to Compaction of Cohesionless Soils. Proceedings, 4th Budapest Conference on Soil Mechanics and Foundation Engineering, pp. 373–384.
- Broms, B.B. (1977). Triaxial Tests with Fabric‐Reinforced Soil. Proceedings, International Conference on Use of Fabrics in Geotechnics, L'Ecole Nationale des Ponts et Chaussees, Volume Ill, Paris, France, pp. 129–133.
- Chandrasekaran, B., Broms, B.B., and Wong, K.S. (1989). Strength of Fabric Reinforced Sand under Axisymmetric Loading. Geotextiles and Geomembranes, 8(4), 293–310.
- Claybourn, A. and Wu, J.T.H. (1992). Failure Loads of the Denver Walls by Current Design Methods. In International Symposium on Geosynthetic‐Reinforced Soil Retaining Walls. A.A. Balkema, Rotterdam, pp. 61–77.
- Duncan, J.M., Williams, G.W., Sehn, A.L., and Seed R.M. (1991). Estimation of Earth Pressures due to Compaction. Journal of Geotechnical Engineering, 117(12), 1833–1847.
- Edgar, T.V., Puckett, J.A., and D’Spain, R.B. (1989). Effects of Geotextiles on Lateral Pressure and Deformation in Highway Embankments. Geotextiles and Geomembranes, 8(4), 275–306.
- Elton, D.J. and Patawaran, M.A.B. (2005). Mechanically Stabilized Earth (MSE) Reinforcement Tensile Strength from Tests of Geotextile Reinforced Soil. Technical Report, Alabama Highway Research Center, Auburn University.
- Gray, D.H. and Al‐Refeai, T. (1986). Behavior of Fabric‐ versus Fiber‐Reinforced Sand. Journal of Geotechnical Engineering, 112(8), 804–820.
- Hausmann, M.R. (1976). Strength of Reinforced Soil. Proceedings, 8th Australian Road Research Conference, Volume 8, Section 13, pp. 1–8.
- Ingold, T.S. (1982). Reinforced Earth. Thomas Telford Ltd, London.
- Ketchart, K. and Wu, J.J.H. (2001). Performance Test for Geosynthetic‐Reinforced Soil Including Effects of Preloading. FHWA‐RD‐01‐018, Turner‐Fairbank Highway Research Center, Federal Highway Administration, McLean, Virginia, 270 pp.
- Koerner, R.M. (1994). Designing with Geosynthetics, 3rd edition. Prentice Hall, Upper Saddle River, New Jersey, 783 pp.
- Leonards, G.A. (1962). Engineering Properties of Soils. In Foundation Engineering. McGraw‐Hill, New York.
- Liu, H.C. (1987). Dynamic Behavior of a Geotextile Reinforced Sand. M.S. Thesis, Department of Civil Engineering, University of Colorado Denver.
- Ma, C. and Wu, J.T.H. (2004). Performance of an Independent Full‐Height Facing Reinforced Soil Wall. Journal of Performance of Constructed Facilities, 18(3), 165–172.
- Maher, M.H. and Woods, R.D. (1990). Dynamic Response of Sand Reinforced with Randomly Distributed Fibers. Journal of Geotechnical Engineering, 116(7), 1116–1131.
- Mitchell, J.K. and Villet, W.C.B (1987). Performance of Earth Slopes and Embankments. NCHRP Report No. 290, Transportation Research Board, Washington, D.C.
- Monley, G.J. and Wu, J.T.H. (1993). Tensile Reinforcement Effects on Bridge‐Approach Settlement. Journal of Geotechnical Engineering, 119(4), 749–762.
- Nicks, J.E., Adams, M.T. and Ooi, P.S.K. (2013). Geosynthetic Reinforced Soil Performance Testing – Axial Load Deformation Relationships. Report No. FHWA‐HRT‐13‐066, Federal Highway Administration, McLean, Virginia, 169 pp.
- Pham, T.Q. (2009). Investigating Composite Behavior of Geosynthetic‐Reinforced Soil (GRS) Mass. Doctoral Dissertation, Department of Civil Engineering, University of Colorado Denver.
- Rowe, P.W. (1954). A Stress‐Strain Theory for Cohesionless Soil with Applications to Earth Pressures at Rest and Moving Walls. Geotechnique, 4(2), 70–88.
- Schlosser, F. and Long, N.T. (1974). Recent Results in French Research on Reinforced Earth. Journal of the Construction Division, 100(CO3), 223–237.
- Seed, R.M. (1983). Compaction‐induced Stresses and Deflections on Earth Structure. Ph.D. Dissertation, University of California, Berkeley, California, 447 pp.
- Steward, J.E. and Mohney, J. (1982). Trial use Results and Experience for Low Volume Forest Roads. Proceedings, 2nd International Conference on Geotextiles, Las Vegas, Volume II, pp. 335–340.
- Tafreshi, S.N.M. and Asakereh (2007). Strength Evaluation of Wet Reinforced Silty Sand by Triaxial Test. International Journal of Civil Engineering, 5(4), 274–283.
- Tatsuoka, F. (2008). Recent Practice and Research of Geosynthetic‐Reinforced Earth Structures in Japan. Journal of GeoEngineering, 3(3), 77–100.
- Tatsuoka, F., Murata, O., and Tateyama, M. (1992). Permanent Geosynthetic‐Reinforced Soil Retaining Walls Used for Railway Embankments in Japan. In Geosynthetic‐Reinforced Soil Retaining Walls, Denver, Colorado, 8–9 August 1991, Wu (ed.). A.A. Balkema, Rotterdam, pp. 101–130.
- Tatsuoka, F., Tateyama, M., Uchimura, T., and Koseki, J. (1997). Geosynthetic‐reinforced Soil Retaining Walls as Important Permanent Structures. In Mechanically‐Stabilized Backfill, Wu (ed.). A.A. Balkema, Rotterdam, pp. 3–24.
- Tatsuoka, F., Tateyama, M., Aoki, H., and Watanabe, K. (2005). Bridge Abutment Made of Cement‐Mixed Gravel Backfill. In Ground Improvement – Case Histories. Elsevier Geo‐Engineering Book Series, Volume 3, pp. 829–873.
- Wu, J.T.H. (1992a), Predicting Performance of the Denver Walls: General Report. In Proceedings, International Symposium on Geosynthetic‐Reinforced Soil Retaining Walls, Wu (ed.), A.A. Balkema, Rotterdam, pp. 3–20.
- Wu, J.T.H. (1992b). Construction and Instrumentation of the Denver Walls. In Proceedings, International Symposium on Geosynthetic‐Reinforced Soil Retaining Walls, Wu (ed.), A.A. Balkema, Rotterdam, pp. 21–30.
- Wu, J.T.H. (1992c). Measured Behavior of the Denver Walls. In Proceedings, International Symposium on Geosynthetic‐Reinforced Soil Retaining Walls, Wu (ed.). A.A. Balkema, Rotterdam, pp. 31–42.
- Wu, J.T.H. (1994). Design and Construction of Low Cost Retaining Walls: The Next Generation in Technology. Report No. CTI‐UCD‐1‐94, Colorado Transportation Institute, Colorado Department of Transportation, Denver, Colorado, 162 pp.
- Wu, J.T.H. and Helwany, H. (1990). Alleviating Bridge Approach Settlement with Geosynthetic Reinforcement. In Proceedings, 4th International Conference on Geotextiles, Geomembranes and Related Products, The Hague, Volume 1, A.A. Balkema, Rotterdam, pp. 107–111.
- Wu, J.T.H. and Pham. Q. (2010). An Analytical Model for Evaluation of Compaction‐Induced Stresses in Geosynthetic‐Reinforced Soil (GRS) Mass. International Journal of Geotechnical Engineering, 4(4), 549–556.
- Wu, J.T.H. and Pham, T.Q. (2013). Load Carrying Capacity and Required Reinforcement Strength of Closely Spaced Soil‐Geosynthetic Composites. Journal of Geotechnical and Geoenvironmental Engineering, 139(9), 1468–1476.
- Wu, J.T.H., Pham, T.Q., and Adams, M.T. (2010). Composite Behavior of Geosynthetic‐Reinforced Soil (GRS). Technical Report, Civil Engineering Department, University of Colorado Denver, 277 pp.
- Wu, J.T.H., Pham, T.Q., and Adams, M.T. (2013). Composite Behavior of Geosynthetic Reinforced Soil Mass. Publication No. FHWA‐HRT 10‐077, Federal Highway Administration, McLean, Virginia. 211 pp.
- Wu, J.T.H., Yang, K.‐H., Mohammed, S., Pham, T.Q., and Chen, R.‐H. (2014). Suppression of Soil Dilation – A Reinforcing Mechanism of Soil‐Geosynthetic Composites. Transportation Infrastructure Geotechnology, 1(1), 68–82.
- Yamauchi, H. (1987). Use of Nonwoven geotextiles for Reinforcing Clayey Embankment (in Japanese). Doctoral Dissertation, University of Tokyo, Japan, 507 pp.
- Yang, Z. (1972). Strength and Deformation Characteristics of Reinforced Sand. Doctoral Dissertation, Department of Civil Engineering, University of California at Los Angeles.