
Lesson 10: Working with Canvas
Canvas is a two-dimensional drawing API that is part of the HTML5 specification. The inclusion of a native drawing API enables developers to create drawings dynamically on a web page, often based on retrieved data or user interaction. Unlike the familiar formats for images such JPGs and PNGs, drawings created with Canvas can be updated in real-time.
What you’ll learn in this lesson:
- • Understanding the Canvas element
- • Drawing shapes and paths
- • Applying colors and gradient brushes
- • Animating compositions
Starting up
You will work with several files from the HTML5_10lessons folder in this lesson. Make sure you have loaded the HTML5lessons folder onto your hard drive from www.digitalclassroombooks.com/HTML5. See “Loading lesson files” in the Starting Up section of this book.
To accurately preview the HTML5 content you will create in this lesson, you need a browser that supports HTML5 tags. See “Using web browsers that support HTML5 tags” in the Starting Up section of this book to determine whether you are using such a browser, or for instructions on downloading one.
You can use the Canvas HTML element to define the drawing surface, but you must define the drawing instructions and the resulting lines, shapes, and colors in JavaScript. In this lesson, you will learn the fundamentals of the Canvas API, which include drawing shapes, paths, text and using colors and gradients. Afterwards, you will progress to more advanced concepts of drawing images, shadows, using transforms, and creating an animated drawing.
Understanding the Canvas element
The Canvas element is a little different than most other elements in HTML5. It is more complex in that it requires the help of JavaScript to work. Your first step is to add (or define) a canvas element in your HTML. Once you have defined the element, you must store a reference to the drawing context for that element as a variable in JavaScript. You can then use the context itself to write the drawing instructions.
1 Open the canvastemplate.html file in the HTML5_10lessons folder to find the template you will use for the upcoming exercises. This template defines a Canvas HTML element set to a width and height of 300, which declares the drawing surface. After the body of the page opens, the <setup()> JavaScript function is called. The function locates the Canvas HTML element by name and sets a variable to the drawing context of the Canvas. Once a reference to the drawing context is available, you can draw dynamic graphics. The HTML for your canvas template looks like this:
<body onload="setup();">
<canvas id="lessonCanvas" width="300" height="300"style="margin:100px;"></canvas>
</body>
The code for your JavaScript looks like this:
<script type="text/javascript">
function setup() {
var canvas = document.getElementById('lessonCanvas'),
if (canvas.getContext) {
var ctx = canvas.getContext('2d'),
<!--drawing instructions here -->
}
}
</script>
You will not be making any modifications to this file, but once you are ready to create canvas-based work on your own, you may use this as a starting point.
2 Choose File > Close without making any change to this file.
The benefits of the Canvas element
If you are a designer and begin to go through the following exercises, you may find the amount of scripting involved a bit unexpected. The canvas element allows you to create graphics that might otherwise be created in a program such as Photoshop, Illustrator, or, if they are animated graphics, created in Flash. The difference is that instead of using those program’s drawing tools, you will be creating the shapes, gradients, text, and other objects in code.
The goal of this lesson is not to convert you to a programmer, but to expose the fundamentals of how the Canvas element works. Undoubtedly, there will be future applications that will allow you to create canvas based objects and animations without the need for writing the code by hand. In fact, we discuss a few of these developments at the end of the chapter. For now, though, building these objects from the ground up is the best way to understand the logic of working with the Canvas element.
The Canvas element has had reasonably good browser support over the years, and we can imagine that it will be used as a substitute for the sort of experiences you associate with Flash: games, animations, charts, graphs, data visualizations, and for creating vector user interfaces, among other uses.
One benefit of using Canvas for these scenarios is the lack of requirement for a browser plugin. There are additional benefits: user interface icons are one example of the type of graphics you could create with Canvas elements. Images created with Canvas elements can be saved out of a page as png files, so you could imagine a version of a web application that allows you to export images. Additionally, using a feature of Canvas output called data uri, you can embed images created in Canvas directly into CSS. As with many of the HTML5 features, it will fall upon designers and developers to begin creating unique implementations of the Canvas element. In the following exercises, you can begin the process yourself.
Drawing paths
Paths and basic shapes are the building blocks of drawing graphics with the canvas element. After you gain an understanding of the basic functions, you can draw more complex visuals, such as graphs based on data, animated game sprites, and other interesting visuals. The first few functions in this chapter also provide a high-level overview of how the Canvas element works.
Drawing rectangles
A rectangle is the simplest path to draw. The <fillRect(x, y, width, height)> function, which you must call within the context object, creates a rectangular path positioned and sized based on the parameters, and fills the rectangle based on the current fillStyle. The parallel function of strokeRect creates the same path and draws an outline based on the current strokeStyle, in place of a fill. The clearRect function uses the same parameters, but it clears all pixels on the canvas in the given rectangle.
1 Open the drawingrectangles.html file and save a copy of the file as drawingrectangles_work.html. In the code, you will find a Canvas element already defined, and a JavaScript function called setup that runs when the page opens. In the setup function, a reference to the 2D context of the Canvas element has been saved to a variable that you will use to draw.
2 In the if statement, after the ctx variable is set, add the following code to draw a rectangle that outlines the Canvas:
function setup() {
var canvas = document.getElementById('lessonCanvas'),
if (canvas.getContext) {
var ctx = canvas.getContext('2d'),
ctx.strokeRect(0, 0, 300, 300);
}
}
Notice that the x and y coordinates are set to 0, which starts the rectangle path in the upper left corner; the width and height are set to 300, thus matching the size of the Canvas element.
3 After the line from the previous step, add the following two lines, which change the current stroke color from the default black to red, and draw a smaller rectangle outline:
ctx.strokeStyle = 'rgb(255, 0, 0)';
ctx.strokeRect(0.5, 0.5, 100, 100);
4 Save your drawingrectangle_work.html file and open the file in your browser. You should see a drawing similar to the following figure. As in many examples of HTML5, if you see nothing in your browser, you will need to make sure it supports the canvas element. For a list of past, current and future browsers that support this element, visit http://caniuse.com/#feat=canvas.
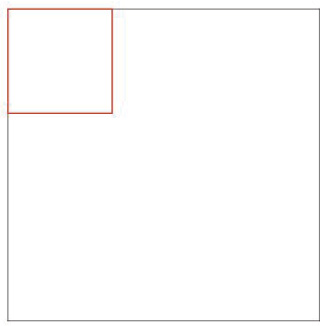
Black and red outlined rectangles.
Notice the Canvas element has a margin defined in CSS added as a visual aid only. This also illustrates that you can style the Canvas element with CSS, as with other HTML elements.
5 Return to your text editor, and after the lines from the previous step, add the following line of code to draw a filled rectangle:
ctx.fillRect(20, 20, 100, 100);
6 Add two more lines of code to change the current fill color from the default black to green and draw another filled rectangle using the new color:
ctx.fillStyle = 'rgb(0, 255, 0)';
ctx.fillRect(50, 50, 100, 100);
7 Choose File > Save, then switch to your web browser. If the page is still open, refresh the page in your web browser, or re-open the work file you are using for this lesson. Your browser should display the following figure:
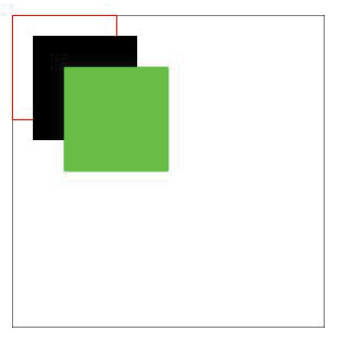
Black and red outlined rectangles with black and green filled rectangles created using HTML 5.
You can use fillRect to create the same path and fill it, rather than add an outline.
8 Keep the browser page open, and switch back to your text editor. In your text editor, after the lines from step five, add the following line of code to clear the pixels within the given rectangle:
ctx.clearRect(80, 80, 30, 30);
9 Save the document in your text editor, then move to your web browser and refresh the page; you should see a drawing similar to the figure below. The clearRect function resets the pixels to transparent, partially removing the color changes made by the previous calls to strokeRect and fillRect.
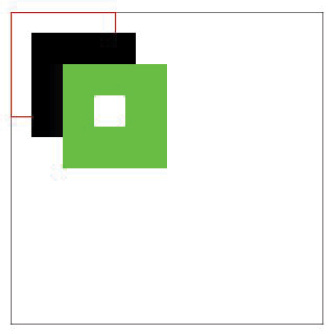
Black and red outlined rectangles with black and green filled rectangles and a rectangular hole.
Drawing lines and circles
The rectangle functions from the previous section are basic drawing functions combined for ease of use. Imagine you wanted to recreate this same rectangle using more basic functions. Look at the rectangle function code again:
ctx.strokeRect(0, 0, 300, 300);
You could draw this rectangle with the following series of basic functions:
ctx.moveTo(0, 0);
ctx.lineTo(300, 0);
ctx.lineTo(300, 300);
ctx.lineTo(0, 300);
ctx.lineTo(0, 0);
ctx.stroke();
The moveTo(x, y) function creates a new sub path at the given coordinates. The lineTo(x, y) function adds a new point to the current sub path, connecting the previous one with a straight line. Finally, the stroke function draws the lines without filling the area within. It makes more sense to use the rectangle function because it is only a single line of code, however, understanding how the basic functions work is important because you can use them to create custom paths of any shape.
1 Open the drawinglinesandcircles.html file and save a copy of the file as drawingcircles_work.html. This file already has the drawing context enabled with the setup function. You will now add a rectangle and a series of zigzagging lines.
2 Within the setup function, after the line var ctx = canvas.getContext('2d'),, add the following code:
ctx.strokeRect(0, 0, 300, 300);
ctx.moveTo(20, 20);
ctx.lineTo(100, 100);
ctx.lineTo(80, 200);
ctx.lineTo(200, 80);
ctx.lineTo(200, 200);
ctx.lineTo(280, 280);
ctx.stroke();
3 Save your work in your text editor, then switch to your browser. Refresh your browser page to review the HTML in your browser. The resulting page should be similar to the figure below:
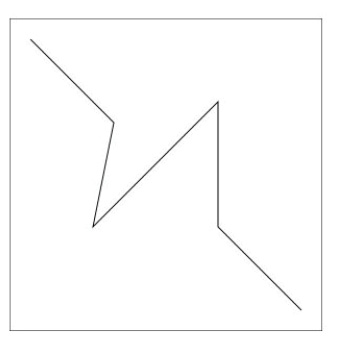
A black outline and a zigzag across the canvas.
You can see that the lineTo function is useful for drawing lines or rectangles. You will now change the fill color of the zigzag lines and add a red circle onto the path.
4 Switch to your text editor and add the following lines of code after the lines from step 2:
ctx.fillStyle = 'rgb(255,0,0)';
ctx.arc(100, 100, 16, 0, Math.PI * 2, false);
ctx.fill();
The first line changes the current fill color from the default black to red. The second line draws a full circle with a center point at the coordinates of (100, 100) and a radius of 16. The last three parameters of the arc function determine the length of the arc. startAngle and endAngle, measured in radians, define the start and end points; the direction the line is drawn between the two points is determined by the final anticlockwise parameter. The code above defines an arc that starts at 0 (the rightmost vertically centered point of a circle) and continues clockwise until it reaches the point of 2 π radians, or a full 360 degree rotation, thus forming a circle. Finally, the fill function colors the path.
5 Choose File > Save, and then switch to your browser and preview the HTML page. As you can see, the circle was added to the current sub path of lines. Since the lines and the circle were part of the same sub path, the whole area was colored, not just the circle.

A black outline and a filled zig-zag.
6 To draw separate paths, you must use the beginPath function, which clears the current sub path and provides a fresh start. Return to your text editor and between the fillStyle and the arc function, insert the following lines as follows:
ctx.fillStyle = 'rgb(255,0,0)';
ctx.beginPath();
ctx.arc(100, 100, 16, 0, Math.PI * 2, false);
ctx.fill();
ctx.stroke();
The second line you added, ctx.stroke();, adds a separate stroke to the circle.
7 Save your work in your text editor and switch to your browser to preview the HTML page. Your drawing will appear as follows:
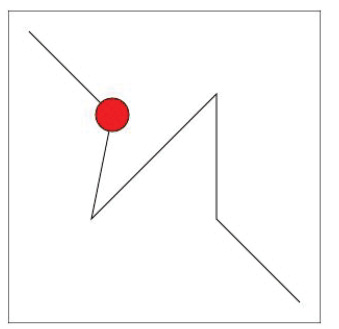
A black outline, zigzag, and a red circle.
8 With the circle created, you will now add a new object, in this case a semi-circle. Add the following lines of code:
ctx.beginPath();
ctx.arc(170, 170, 16, 0, Math.PI, true);
ctx.fill();
The code above starts a new path, keeping this arc independent of the previous circle. The values 170 and 170 define the center point, the value 16 defines the radius. The value 0 represents the startAngle and the endAngle is set to π, which will only draw a half circle, or 180 degrees, starting from 0. The value “true” is for the anticlockwise parameter, which means an arc will be drawn upwards.
9 Choose File > Save, and then preview the HTML page in your browser; you will see the following figure:
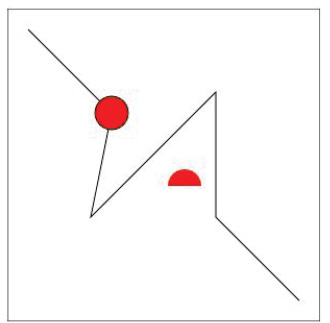
A black outline, zigzag, a red circle, and a red semi-circle.
If you set the anticlockwise parameter to false, the arc would trace clockwise, resulting in a half circle that curves downward.
Drawing with curves
The canvas element provides two drawing functions to help create curves: quadraticCurveTo(cpx, cpy, x, y) and bezierCurveTo(cp1x, cp1y, cp2x, cp2y, x, y). Both functions use control points to determine the curve of the path when drawing from one point to the next.
1 In the HTML5_10lessons folder, open the drawingcurves.html file and save a copy of the file as drawingcurves_work.html. The code is identical to the initial exercise for setting up a canvas element and saving the 2D context to a variable for reuse. In this exercise, you will draw several shapes to create a flower composition.
2 In the if statement after the ctx variable is set, add the following code to draw a rectangle that outlines the canvas.
ctx.strokeRect(0, 0, 300, 300);
This is the same outline rectangle as the last section, providing a visual reference for the borders of the canvas element.
3 Add the following lines after the line from the previous step to draw the stem of the flower:
ctx.fillStyle = 'rgb(0,173,104)';
ctx.moveTo(145, 150);
ctx.quadraticCurveTo(120, 200, 170, 280);
ctx.lineTo(190, 280);
ctx.quadraticCurveTo(125, 190, 155, 150);
ctx.fill();
The first line of code changes the fill to green. The remaining lines of code define the starting points, curves, and lines of the stem shape.
4 Choose File > Save. Switch to your browser, and then preview the HTML page. You will see the following figure:
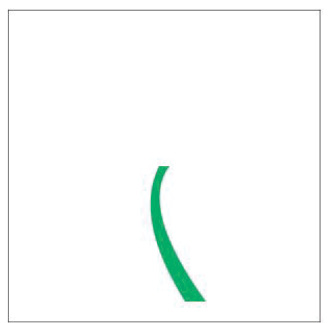
The green flower stem shape.
You will now create a flower petal using the bezierCurveTo function, which uses two control points, unlike the single control point used with the quadraticCurveTo function from the last step. In addition, you will draw a number of guidelines using the same points to help visualize how the bezierCurveTo function works.
Since you will use a number of the same points to draw the petal and the guidelines, you can store the point values in variables for reuse.
5 Switch back to your text editor, then add the following of code after the lines from step 3.
var pt1 = { x: 155, y: 145 };
var pt2 = { x: 93, y: 106 };
var cp1 = { x: 111, y: 154 };
var cp2 = { x: 66, y: 131 };
6 Add the lines indicated below after the code from the previous step. This code changes the stroke and fill colors, and draws the first petal of the flower.
ctx.fillStyle = 'rgb(115,206,226)';
ctx.strokeStyle = 'rgb(0,111,174)';
ctx.beginPath();
ctx.moveTo(pt1.x, pt1.y);
ctx.bezierCurveTo(cp1.x, cp1.y, cp2.x, cp2.y, pt2.x, pt2.y); ctx.bezierCurveTo(89, 65, 159, 118, 155, 145);
ctx.fill();
ctx.stroke();
The first two lines of code change the stroke to a dark blue color and the fill to a light blue color. The next four lines create a new path using the bezierCurveTo function to create smooth curves. The path is then filled and outlined.
7 Save the HTML file, then switch to your browser and preview the HTML page, reflecting your changes:
The stem shape with a single flower petal.
8 Switch back to your text editor and add the following lines of code after the lines from the previous step; these lines change the stroke and fill colors and draw the center of the flower, tying the illustration of the flower together:
ctx.fillStyle = 'rgb(243,237,99)';
ctx.strokeStyle = 'rgb(253,183,58)';
ctx.beginPath();
ctx.arc(155, 145, 10, 0, Math.PI * 2, false);
ctx.fill();
ctx.stroke();
9 To visualize how the bezierCurveTo function makes use of control points to define a curve, you will add a guideline using the same points as the first curve of the flower petal. Create the guidelines by adding the following lines of code after the lines from the previous step:
ctx.strokeStyle = 'rgb(255,0,0)';
ctx.beginPath();
ctx.arc(pt1.x, pt1.y, 2, 0, Math.PI * 2, false);
ctx.arc(cp1.x, cp1.y, 2, 0, Math.PI * 2, false);
ctx.arc(cp2.x, cp2.y, 2, 0, Math.PI * 2, false);
ctx.arc(pt2.x, pt2.y, 2, 0, Math.PI * 2, false);
ctx.stroke();
The first line changes the stroke to a bright red, which stands out from the flower drawing. The next six lines create a connected path of small circles at each point used by the first Bezier curve.
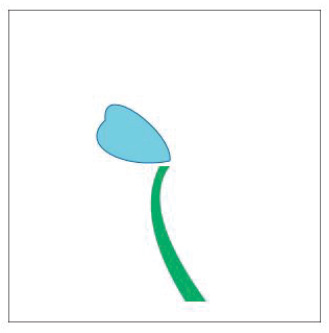
10 Save the HTML file, then switch to your browser and preview the HTML page, reflecting your changes.
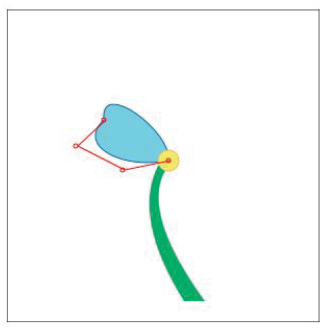
The flower with a single petal and visualization lines.
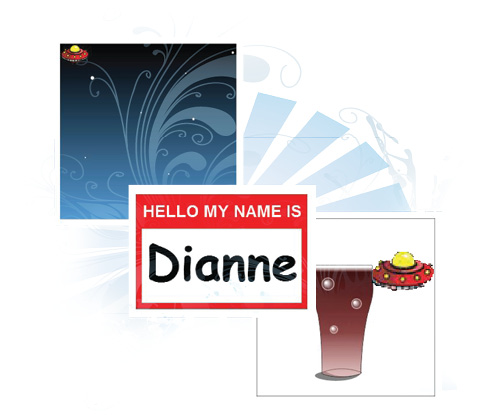
Adding text
You can draw text, in addition to lines and shapes, on a canvas. Font family, size, and text-weight are set in a manner similar to CSS, and follow the same rules according to the fonts, sizes, and text weight values that are available. Unlike CSS, there is no concept of margins or padding, rather, text is positioned absolutely according to coordinates given in a XY format. In this section, you will create a greeter’s name badge to explore drawing text on the canvas.
1 Open the addingtext.html file located in the HTML5_10lessons folder and save a copy of the file as addingtext_work.html. The file uses the same template you have been using, with the exception of two rectangles placed to make the background of the greeter’s name badge.
2 Locate the second strokeRect function, add the following code to draw the header text:
ctx.fillText('HELLO MY NAME IS', 12, 40);
This line of code draws the text value of the first parameter at the coordinates of the second (x) and third (y) parameters. The default font is used and the color of the text is white, based on the fillStyle value set previously in the code.
3 Save the HTML file, then switch to your browser and preview the HTML page, reflecting your changes:
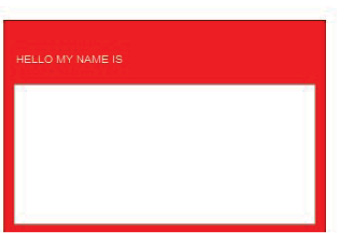
The greeter’s name badge with a small header.
4 To increase the size and weight of the header text, insert the following line of code before the line from the previous step:
ctx.font = "bold 1.8em sans-serif";
ctx.fillText('HELLO MY NAME IS', 12, 40);
Notice that as with CSS, you can set font size using relative values. In this case, the header text will be 1.8 times the size of the canvas HTML element’s font size, which is inherited from the body of the HTML page, unless you set it explicitly.
5 Save the HTML file, then switch to your browser and preview the HTML page, reflecting your changes:
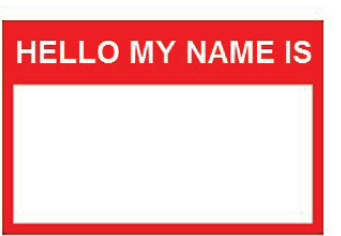
The greeter’s name badge with a more fitting header.
6 To add the name of the greeter to the badge, add another call to fillText. To make the text stand out and appear handwritten, you will use a different font at a larger size. After the code from step 2, add the follow lines.
ctx.fillStyle = 'rgb(0, 0, 0)';
ctx.font = 'bold 84px Comic Sans MS';
ctx.textAlign = 'center';
ctx.fillText('Dianne', 150, 150);
The first line sets the color of the text to black. The second line sets the font to an absolute height of 84 pixels and the default font family to Comic Sans MS, which is a script font. The next sets the horizontal alignment of the text in relation to the position coordinate to center. Other possible options for horizontal alignment are right or the default value, left.
7 Save the HTML file, then switch to your browser and preview the HTML page, reflecting your changes:
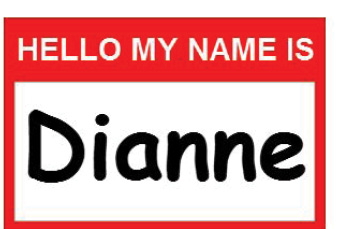
The greeter’s name badge with a nice header and the greeter’s name.
Using colors, styles, and gradients
You have used solid colors so far, but most objects transition smoothly from one color to another. This type of transition in Canvas is called a gradient, which is available as a linear or radial brush. Additionally, in this section, you will learn different ways to define colors, including areas of transparency.
1 Open the colorsstylesandgradients.html file located in the HTML5_10lessons folder and save a copy of the file as colorsstylesandgradients_work.html. The file makes use of a few paths that were included to make the shape of a soda glass.
2 Open your browser and preview the HTML page to see the empty soda glass.
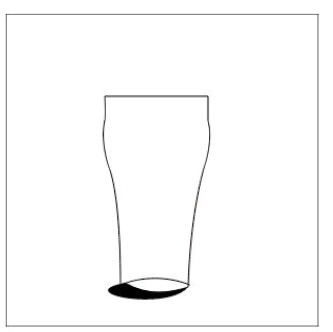
An empty soda glass with a hard shadow.
3 Return to your text editor and after the strokeRect function, change the fillStyle color from black to gray, as shown here:
ctx.fillStyle = 'gray';
Previous sections of this lesson have all used rgb to define colors, but there are reserved keywords available for ease of use. Other keywords include basic colors, such as red, blue, orange, and purple.
4 Save the HTML file, then switch to your browser and preview the HTML page, reflecting your changes.
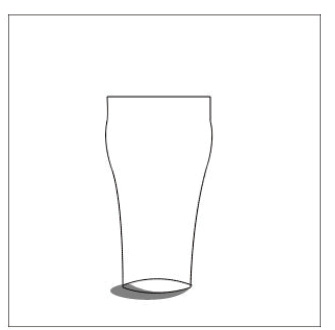
An empty soda glass with a softer shadow.
5 You can also fill up the glass with soda using a linear gradient. After the section commented as the “cup inline” and before the section commented as “cup outline”, insert the following lines of code:
var lineGrad = ctx.createLinearGradient(150, 81, 150, 268);
lineGrad.addColorStop(0, '#fff'),
lineGrad.addColorStop(0.05, '#450c0c'),
lineGrad.addColorStop(0.6, '#874040'),
lineGrad.addColorStop(1, 'rgba(202, 147, 147, 0.6)'),
ctx.fillStyle = lineGrad;
The first line defines a new linear gradient brush where the first two parameters determine the start point of the gradient, and the next two parameters determine the end point of the gradient. The locations use x and y coordinates, as if you were positioning a rectangle or a circle.
The next four lines define the different color stops in the gradient. The first parameter determines the position of the color stop relative to the start and end point of the gradient (0 representing the start point and 1 representing the end point). The second parameter defines the color of the color stop.
The hexadecimal format is used to define the first three colors. The last color is defined using the rgba function, which extends the rgb function by adding another parameter used as the alpha or opacity of the color. Opacity is set on a scale from 0 to 1, where 0 represents a fully transparent color and 1 represents a fully opaque color.
 We cover the concepts of RGBA in more detail in Lesson 11, Styling with CSS3.
The last line changes the fillStyle to the new linear gradient brush.
6 With the fillStyle set to the new linear gradient, your last step is to fill the cup outline. In the cup outline commented section, add the following line after the stroke function.
ctx.fill();
7 Save the HTML file, then switch to your browser and preview the HTML page, reflecting your changes:
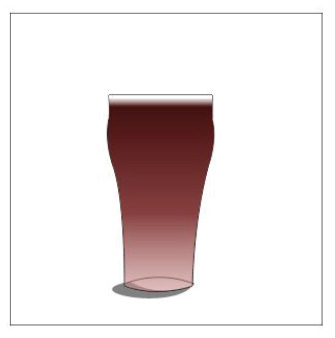
A full soda glass.
8 Return to your text editor, using multiple radial gradients, you will add a few bubbles to the soda glass. After the ctx.fill line of code you added in step 6, add the following lines:
ctx.strokeStyle = 'rgba(255, 255, 255, 0.5)';
ctx.lineWidth = 2;
The first line changes the strokeStyle from the default black to a semi-transparent white. The second line changes the width of the stroke from the default 1 pixel to 2 pixels.
9 After the lines from the previous step, add the following lines:
var radGrad = ctx.createRadialGradient(116, 107, 1, 120, 110, 10);
radGrad.addColorStop(0, 'white'),
radGrad.addColorStop(0.9, 'rgba(255, 255, 255, 0)'),
The first line defines a radial gradient in a manner similar to the linear gradient. Start and end points for the gradient are set (first and second parameters for the start point, fourth and fifth for the end point). The main difference is the third and sixth parameters, which are used as the radius of the respective points.
In this example, the start point is defined at an x position of 116 and a y position of 107 with a radius of 1. The end point is defined at an x position of 120 and a y position of 110 with a radius of 10.
10 With the radial gradient appearance defined, you can use it to fill a circle to represent a bubble. After the lines from the previous step, add the following lines.
ctx.fillStyle = radGrad;
ctx.beginPath();
ctx.arc(120, 110, 10, 0, Math.PI * 2, false);
ctx.fill();
ctx.stroke();
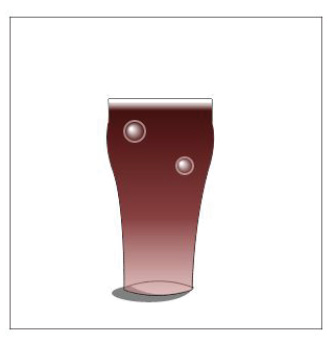
11 Save the HTML file, then switch to your browser and preview the HTML page, reflecting your changes:

A full soda glass with a bubble.
12 To add another bubble, you must define a new brush because the coordinates are set to an absolute position. If you move or change the size of a bubble, you must move the brush as well. After the code from step 10, add the following lines.
radGrad = ctx.createRadialGradient(164, 140, 1, 168, 143, 8);
radGrad.addColorStop(0, 'white'),
radGrad.addColorStop(0.9, 'rgba(255, 255, 255, 0)'),
ctx.fillStyle = radGrad;
ctx.beginPath();
ctx.arc(168, 143, 8, 0, Math.PI * 2, false);
ctx.fill();
ctx.stroke();
13 Save the HTML file, then switch to your browser and preview the HTML page, reflecting your changes:
A full soda glass with two bubbles.
14 Add one more bubble to finish the composition: after the code from the previous step, add the following lines:
radGrad = ctx.createRadialGradient(127, 185, 1, 130, 188, 6);
radGrad.addColorStop(0, 'white'),
radGrad.addColorStop(0.9, 'rgba(255, 255, 255, 0)'),
ctx.fillStyle = radGrad;
ctx.beginPath();
ctx.arc(130, 188, 6, 0, Math.PI * 2, false);
ctx.fill();
ctx.stroke();
15 Save the HTML file, then switch to your browser and preview the HTML page, reflecting your changes:
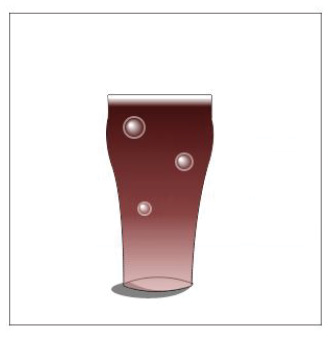
A full soda glass with three bubbles.
Adding images
You can use a simple, single function called drawImage to draw an image to a canvas. The most difficult part is to ensure that when you call the function, the external image file has enough time to open. Once the image is available, the drawImage function provides you with great flexibility to decide the size and section of the image to show.
1 In the HTML5_10lessons folder, open the addingimages.html file and save a copy of the file as addingimages_work.html. The file is set up as a copy of the original canvas template introduced in the first section of this lesson.
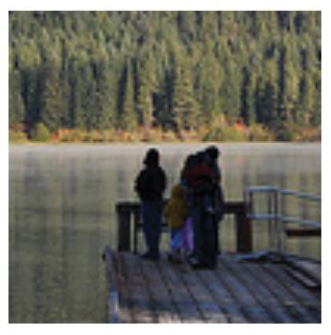
2 Preview the fishlake.jpg found in the images folder to see the image that you will use in this section.
3 In the if statement, after the ctx variable is set, add the following code:
var img = new Image();
img.onload = function(){
}
img.src = 'images/fishlake.jpg';
The first line declares a new Image object and the second line defines a function for the onload event of the image. The last line sets the source file for the image; after that file is downloaded by the browser, the function from the second line is called.
4 Within the curly brackets ({, }) of the onload function, add the following code as follows:
img.onload = function(){
ctx.drawImage(img, 0, 0);
}
This tells the canvas to draw the image at the XY position of 0,0.
5 Save the HTML file, then switch to your browser and preview the HTML page, reflecting your changes:
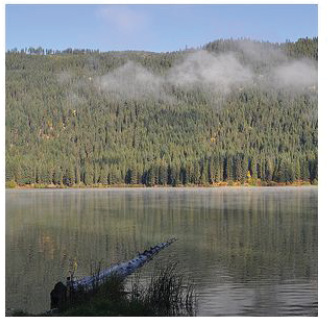
The fishlake image cropped.
The image opened, but it was also cropped because the original size of the image file is larger than the canvas element.
6 To resize the image to fit within the space, add the destination width of 300 and the destination height of 200 to the drawImage function. Modify the line from step 4 to the following:
ctx.drawImage(img, 0, 0, 300, 200);
This tells the canvas to draw the image at the XY position of 0,0, and then resize it to a width of 300 pixels and a height of 200 pixels.
7 Save the HTML file, then switch to your browser and preview the HTML page, reflecting your changes:
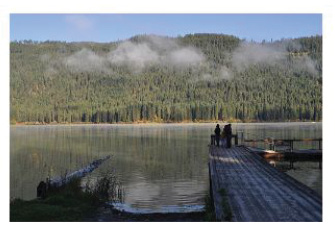
The fishlake image resized to fit within the available space.
8 As a final variant of the drawImage function, you can define the source position, width, and height along with the destination position, width, and height. Modify the line from step 4 to the following:
ctx.drawImage(img, 287, 132, 100, 100, 0, 0, 300, 300);
This tells the canvas to draw the image at the XY position of 0,0 at a width and height of 300, using a rectangular slice of the source image beginning at the position of 287,132 at a width and height of 100.
9 Save the HTML file, then switch to your browser and preview the HTML page, reflecting your changes.
 Typically, this technique is not ideal, as it will tend to pixelate your images. In this case, it is for demonstration purposes.
The fishlake image zoomed in on a specific spot.
Using transforms
Transformations combined with Canvas drawing states enable the creation of complex and dynamic drawings. As discussed earlier in the lesson, global changes, such as strokeStyle, fillStyle, and lineWidth, are all stored in different layers of state change that you can save and restore. The three types of transformations (scaling, rotating, and translating) are also stored in the global state change layers and are easy to use once you understand how to use them in conjunction with the save and restore functions.
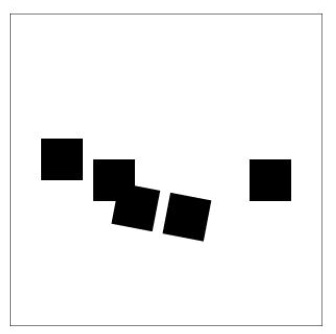
1 In the HTML5_10lessons folder, open the usingtransforms.html file and save a copy of the file as usingtransforms_work.html. The file has five rectangles drawn across the canvas.
2 Open your browser and preview the HTML page to see the rectangles.
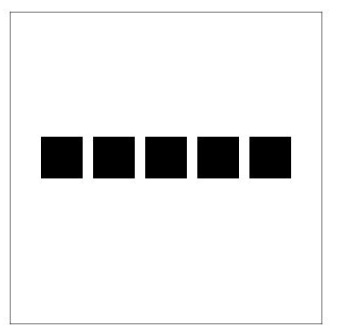
Five rectangles.
3 After the rectangle1 commented section and before rectangle2, add the following line of code as seen here:
//rectangle1
ctx.fillRect(30, 120, 40, 40);
ctx.translate(0, 20);
//rectangle2
ctx.fillRect(80, 120, 40, 40);
The translate transform offsets any subsequent drawing instructions based on the first parameter, which is the x offset value, and the second parameter, which is the y offset value.
4 Save the HTML file, then switch to your browser and preview the HTML page, reflecting your changes.
The last four rectangles pushed further down the y-axis.
5 You can see that once set, the translate transform applies to every drawing instruction following it. After the rectangle1 commented section and before the code from step 3, add the following line as follows:
//rectangle1
ctx.fillRect(30, 120, 40, 40);
ctx.save();
ctx.translate(0, 20);
6 After the rectangle 4 commented section and before rectangle5, add the following line as follows:
//rectangle4
ctx.fillRect(180, 120, 40, 40);
ctx.restore();
//rectangle5
ctx.fillRect(230, 120, 40, 40);
Before you add the translate transform, you save a snapshot of the global canvas state. Once the fourth rectangle is drawn, you restore the global canvas state to its condition before the translate transform was applied.
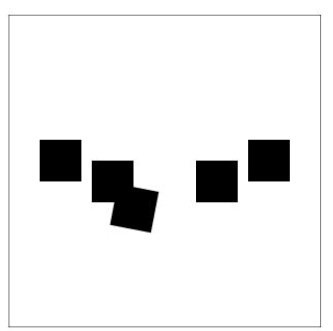
7 Save the HTML file, then switch to your browser and preview the HTML page, reflecting your changes.
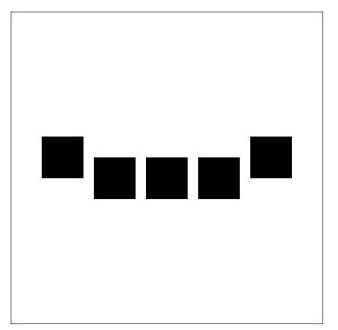
Only the middle three rectangles are pushed further down the y-axis.
8 Return to your text editor, after the rectangle 2 commented section and before rectangle3, add the following lines:
ctx.save();
ctx.rotate(0.19);
The first line saves another snapshot of the global canvas state. The second line adds a rotate transform where the parameter is equal to the angle of rotation measured in radians.
9 Save the HTML file, then switch to your browser and preview the HTML page, reflecting your changes.
The last four rectangles are pushed down and the middle two are rotated.
Since you call the save function twice and the restore function once, the last rectangle is affected by the translate transform, but not the rotate transform.
10 After the rectangle 3 commented section and before rectangle4, add the following line:
ctx.restore();
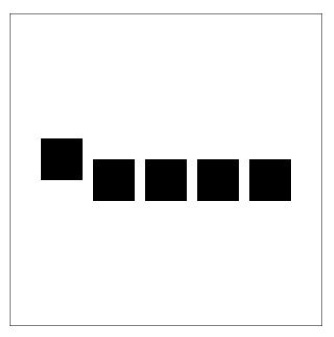
11 Save the HTML file, then switch to your browser and preview the HTML page, reflecting your changes.
Three rectangles are pushed down and one is rotated.
12 After the restore function from step 5 and before rectangle5, add the following line:
ctx.scale(0.5, 0.7);
13 Save the HTML file, then switch to your browser and preview the HTML page, reflecting your changes:
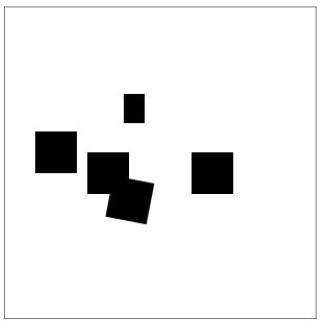
Three rectangles are pushed down, one is rotated, and one is scaled.
Creating a drawing loop
With a fundamental understanding of drawing, you can learn about the dynamic aspect of Canvas. JavaScript functions, such as setInterval, enable you to repeatedly call a drawing function. During each repetition, you can slightly modify your drawing, thus creating the illusion of an animation.
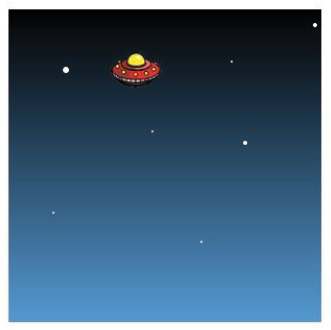
1 In the HTML5_10lessons folder, open the drawingloop.html file and save a copy of the file as drawingloop_work.html. The file is set up to draw a night sky with a UFO image.
2 Open your browser and preview the HTML page to see the night sky scene.
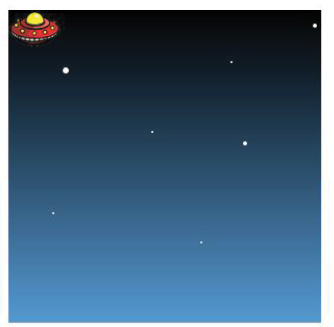
A night sky and a UFO.
3 Examine the JavaScript that creates the drawing loop.
As with previous sections, the onload event of the body calls the setup function that opens the image object and downloads the ufo.png file. You should note that both the ctx and img variables are initially declared outside the setup function. This enables the variables to be used in other functions, in this case, the draw and drawbackground functions.
After the image opens, you can use the setInterval function to call the draw function every 36 milliseconds.
The draw function then calls the drawbackground function, which draws the sky and stars. Then the “ufo” comment is reached, which is where the image of the UFO is drawn.
4 After the img variable is defined and before the setup function, add the following lines of code as follows:
<script type="text/javascript">
var ctx;
var img;
var x = 0;
var y = 40;
These variables are used to update the position of the UFO, but you then need to modify the draw function in order to make use of these new variables.
5 In the draw function, modify the drawImage to use the new variables and update the x variable as follows:
function draw() {
drawBackground();
<!--ufo-->
ctx.drawImage(img, x, y);
x += 1;
}
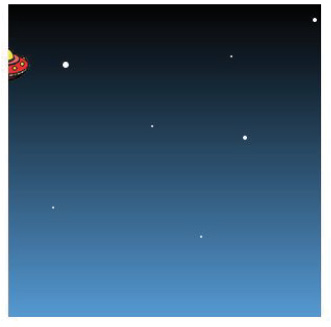
6 Save the HTML file, then switch to your browser and preview the HTML page, reflecting your changes. The UFO will slowly move horizontally across the canvas.
The UFO flying across the night sky.
7 To repeat the loop so the UFO returns after leaving the viewable area, reset the x variable when it becomes larger than the width of the Canvas. Additionally, increase the speed by adding more to the x variable, as follows:
x += 3;
if(x > 300){
x = -50;
}
The value of the x variable is reset to –50 rather than 0 to account for the width of the UFO image.
8 Save the HTML file, then switch to your browser and preview the HTML page, reflecting your changes. When the UFO hits the right edge of the canvas, it will reappear at the left edge.
The UFO flying across the night sky and returning.
9 To create dynamic images, you can also use the Math.random function in JavaScript. For example, change the y variable randomly, so the UFO returns at an unknown level. In the if statement used to reset the x variable, insert the following line as follows:
x += 3;
if(x > 300){
x = -50;
y = Math.random() * 300;
}
Math.random returns a number between 0 and 1 that is multiplied by the maximum number you want returned. In this case, 300 is used to match the height of the Canvas.
10 Save the HTML file, then switch to your browser and preview the HTML page, reflecting your changes. When the UFO hits the right edge of the screen, it will reappear at a random position on the left edge.
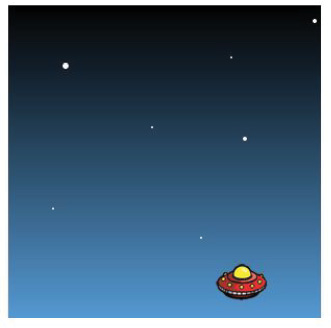
The UFO flying across the night sky and returning randomly.
Self study
Continue experimenting with the Drawing Loop exercise by changing the animated image and the composition of the background scene. To add an extra level of interaction, change the position of the animated image based on the position of the user’s mouse. Try adding transforms to the composition, as well, to review how the effects of multiple transforms are applied.
Review
Questions
1 What are the basic requirements to draw with Canvas in HTML5?
2 How do you draw a circle in Canvas?
3 How do you define a semi-transparent color?
Answers
1 A Canvas element must be defined and added to the body of the page. Drawing instructions are then applied using a reference to the 2D Context of the Canvas element.
2 Using the arc function, a full circle can be drawn when the startAngle and endAngle are set to 0 and Math.PI*2. Angles are measured in radians and the Math.PI function is equal to 180 degrees.
3 The rgba function has four parameters. The first three, representing red, green and blue, are set to a value between 0 and 255, which determines the strength of the respective color. The final parameter is set to a value between 0 and 1, determining the opacity of the color.