
Chapter 6
Financial Contagion From US to African Frontier Markets During the 2007–09 Global Financial Crisis
J. Ahmadu-Bello
T. Rodgers School of Economics, Finance and Accounting, University of Coventry, Coventry, United Kingdom
Abstract
This chapter investigates financial contagion from the United States to eight African frontier markets during the 2007–09 financial crisis using a dynamic conditional correlation-based methodology. The crisis is explored from the perspectives of it being, first, a single long-period event and, second, a series of cumulative short-period subevents. For comparative purposes, contagion from the United States to a set of seven developed markets is also examined. We find strong evidence of contagion in African frontier markets during the early phases of the crisis. In contrast, contagion in developed markets was observed to occur more slowly. We speculate that the differences found are consistent with herding behavior occurring at a faster rate in the frontier markets than in their developed market counterparts.
Keywords
contagion
correlation
financial integration
herding behavior
social networking
1. Introduction, Aims, and Literature
The term “contagion” became widely used in the financial lexicon following the seminal work of King and Wadhwani (1990) and Forbes and Rigobon (2002) on financial crises in 1987 and the 1990s. The latter authors describe contagion in terms of it being “a significant increase in cross-market linkages resulting from a shock hitting one country or group of countries” (Forbes and Rigobon, 2002, p. 2223). The crises examined in the literature have been predominantly country- or region-focused events—for example, the 1997 Asian financial crisis, the 1998 Russian financial crisis, and the Mexican economic crisis in 1994. The 2007–09 crisis was different in that its reach was truly global and in that it unfolded as a series of subevents over a prolonged period. From an African perspective, the 2007–09 crisis was unique as it was the first time that a major financial crisis in another part of the world had a major impact on the continent. In some African markets (eg, Egypt and Nigeria), losses exceeded those in any developed market in percentage terms (African Development Bank, 2009).
The 2007–09 crisis was also different in that it was not a single short sharp shock, but was an event that unfolded in the United States over a period of more than a year. The event can be characterized as being a series of crisis waves (see Section 2, Fig. 6.1). The question that arises from a behavioral finance perspective is: How will markets respond? Will they treat each subevent as separate and unrelated and anchor their decisions on the US market in each instance? Or will they become conditioned to crisis-related events in the United States and stop responding to them?

Figure 6.1 Volatility Index (VIX), 2008–09.
This chapter explores these questions by testing for evidence of financial contagion from the US to African frontier markets. We note that the financial linkages (measured in terms of market correlation) between US and African frontier markets are much weaker than they are between US and developed markets; we believe that this may have implications as to how contagion events unfold in these two sets of countries. A secondary objective of the chapter is therefore to examine any differences found in this respect and to speculate as to whether they have any plausible behavioral-finance-related explanation.
In the remainder of this section we briefly review some of the key literature in respect to the contagion mechanism. Section 2 then presents the data and descriptive statistics. The hypotheses and methodology are described in Section 3 and the results from the study are presented and discussed in Sections 4 and 5. Last, conclusions are drawn in Section 6.
The literature has identified a number of different channels through which contagion events may unfold, with the main focus being on asset market channels, banking channels, and currency channels (Fry-McKibbin et al., 2013; Tonzer, 2013; Lau, 2001). Elsewhere in the literature a distinction is drawn between the relative importance of fundamental causes and investor behavior (Claessens and Forbes, 2004; Dornbusch et al., 2000). Exploring contagion from a behavioral perspective, Calvo and Mendoza (2000) developed a formal model of herding. They argue that the cost of information will lead investors to follow market participants they believe are “well informed” and therefore market rumors will drive large swings in market prices through herding behavior.
A number of papers have attempted to examine the relative importance of behavioral and linkage-related factors. For example, Kaminsky et al. (2003) classify contagion theories into three groups: herding behavior, trade linkages, and financial linkages. They conclude that financial linkages and investor behavior are the most relevant factors in explaining contagion. Elsewhere in the literature a number of papers identify the importance of integration effects and note that during crises integration with global markets increases (Collins and Biekpe, 2003; Kassim, 2013; Cheng and Glascock, 2006).
The relatively low levels of integration may be of particular importance from an African perspective. Berger et al. (2011) analyze frontier market equities with respect to world market integration and diversification. They find little evidence of integration in respect to a number of African countries, including Kenya, Mauritius, and Nigeria. A similar picture is painted by Hatemi-J and Morgan (2007), who find that Nigeria and Zimbabwe have exhibited particularly low levels of integration with global markets.
There are considerable differences in the levels of integration that African and developed markets have with US markets (Table 6.1). There are also considerable differences in the sizes of these markets and the numbers of their respective participants (described in Sections 4 and 5). We believe that our study will show that the combination of these factors will result in considerable differences in the way in which contagion impacts African frontier markets and developed markets.
Table 6.1
Descriptive Statistics over the Period 01/01/07–10/15/2009
| Country | Mean Daily Return (%) | Standard Deviation (%) | Correlation with United Statesa | Skewness | Excess Kurtosis | |
| Frontier Africa | United State | −0.036 | 1.937 | 1 | −0.161 | 5.799 |
| Botswana | 0.017 | 0.569 | −0.014 | 1.263 | 21.198 | |
| Côte d’Ivoire | 0.026 | 25.272b | −0.054 | 0.039 | 331.493b | |
| Mauritius | 0.054 | 1.295 | 0.009 | 0.067 | 6.713 | |
| Morocco | 0.020 | 1.051 | −0.027 | −0.570 | 4.119 | |
| Namibia | −0.022 | 3.397 | 0.341 | 0.882 | 113.549c | |
| Nigeria | −0.058 | 1.333 | −0.040 | 0.060 | 0.603 | |
| Tunisia | 0.087 | 0.656 | 0.126 | −0.586 | 8.986 | |
| Zambia | 0.062 | 1.280 | −0.015 | 0.475 | 8.578 | |
| Developed | Canada | −0.014 | 1.854 | 0.653 | −0.526 | 5.100 |
| France | −0.053 | 1.916 | 0.660 | 0.207 | 5.435 | |
| Germany | −0.020 | 1.870 | 0.594 | 0.245 | 5.999 | |
| Italy | −0.078 | 1.567 | 0.484 | −0.408 | 4.825 | |
| Spain | −0.035 | 1.828 | 0.578 | 0.013 | 4.927 | |
| United Kingdom | −0.028 | 1.746 | 0.663 | −0.026 | 4.658 |

a Constant correlations are estimated for the precrisis period of Jan. 1, 2007–Sep. 14, 2008, only. This period is used in order to identify precrisis differences in the level of integration with the US market.
b This unadjusted data needs to be treated with caution for reasons identified in the description associated with Figure 6.2b.
c This high value is associated with a spike in returns toward the end of the crisis period.
2. Data and Descriptive Statistics
An issue that every study of contagion faces is that of identifying the crisis starting point and ending point. The 2007–09 crisis was unique among post-1945 financial shocks in that it developed over a relatively long period and contained a number of subevents. This makes identifying the event window potentially problematical.
However, since the crisis originated from the United States, we have the Volatility Index (VIX) of the Chicago Board Options Exchange (CBOE) at our disposal to identify which events produced the greatest “shock” to investors. The index is popularly known as the “fear gauge” given its forward-looking properties. It is presented in Fig. 6.1.
The VIX showed a series of spikes associated with a number of key crisis events. The first spike in the last quarter of 2008 was associated with the lead-up to the Lehman bankruptcy (Sep. 15). Additional spikes were associated with the federal takeover of Fannie Mae and Freddie Mac (Sep. 7), the emergency US$85 billion loan to insurer American International Group (AIG) (Sep. 17) and the crisis-induced sale of Merrill Lynch to Bank of America (Sep. 14).
The Lehman bankruptcy was the defining event of the crisis; we therefore use Sep. 15, 2008, to identify the start of what is defined as the long crisis period. The VIX remained high well into 2009, which is an indication that this particular crisis was not the type of short, sharp shock modeled previously in the contagion literature by the likes of Forbes and Rigobon (2002). Oct. 2008 saw further crisis measures such as the introduction of the US$700 billion Troubled Assets Relief Program (TARP) in the United States to stave off collapse in the banking system, and we saw further emergency mergers in this sector (eg, Wells Fargo taking over Wachovia). On Nov. 27 the US government had to rescue Citigroup after speculators drove its share price down 60%. Further afield, in the United Kingdom, the Royal Bank of Scotland (RBS) was rescued by the UK government on Oct. 13, and around the same time HBOS plc was forced to merge with Lloyds–TSB, which ultimately led to the partial collapse and bailout of this bank.
Defining the end point of the financial crisis is open to interpretation, but we again use the VIX. Using the mean index value from 2000 as a guide, the index can be identified as reverting back to its average by early Oct. 2009. This gives an indication of market expectations that the crisis was drawing to a close. Based on this, the long period contagion event is identified in this study as Sep. 15, 2008, to Oct. 15, 2009.a
The individual spikes observed in the VIX suggest that it may be more appropriate to treat the crisis as an accumulation of events rather than a single event. This has implications for the study of contagion from the United States to other markets from a behavioral finance perspective. We speculate that we may possibly find evidence of (1) a “decision fatigue” effect given that the crisis developed over such a long period or (2) a representativeness bias (Harman, 2009) where investors respond to each of the subcrises in the same way as they see the impact of the previous subcrisis as representative.
After the Lehman initial shock, there was a series of further fallout events and a whole series of emergency interventions into the financial markets by regulatory authorities. These are well documented in the historical studies of the crisis.b We can identify a series of subperiods in the market when fear spiked (Fig. 6.1).
Although individual subperiods are identified, the focus of this study is to examine the cumulative impact of the crisis in terms of changes in correlations as the crisis period lengthened. The subperiods identified are therefore: subperiod 1 (09/15/2008–10/10/2008), subperiod 2 (09/15/2008–10/17/2008), subperiod 3 (09/15/2008–10/27/2008), and subperiod 4 (09/15/2008–11/20/2008).
2.1. Data Sources and Descriptive Statistics
The study is based on the use of daily closing values of stock markets sourced from the Thomson Reuters Eikon Financial Database and shown in local currencies. The indices used are the principal indices from the respective countries. The data run from Jan. 1, 2007 to Sep. 15, 2009.
The daily logarithmic returns of the respective individual-country indices used are presented graphically in Fig. 6.2a–c, and the mean values and associated descriptive statistics are shown in Table 6.1.


Figure 6.2 Daily returns.
(a) US market, over the period 01/01/07–10/15/09; (b) African markets, over the period 01/01/07–10/15/09; and (c) developed markets, over the period 01/01/07–10/15/09
(a) US market, over the period 01/01/07–10/15/09; (b) African markets, over the period 01/01/07–10/15/09; and (c) developed markets, over the period 01/01/07–10/15/09
The Standard & Poor’s (S&P) 500 index is selected as the American index on the basis that it is an index that is reflective of a general cross section of US stocks. The African frontier markets used for the study are identified from the classifications of S&P and MSCI, Inc. The African frontier markets under study includec Botswana, Côte d’Ivoire, Mauritius, Morocco, Namibia, Nigeria, Tunisia, and Zambia. The developed markets sampled represent a cross section of developed markets and consist of Canada, France, Germany, Italy, Spain, and the United Kingdom.
Fig. 6.2a provides the chart of daily returns for the US S&P 500 for the full sample period. Volatility in the market can be identified as spiking dramatically in the last quarter of 2008. This corresponded with the Lehman bankruptcy announcement and also the jump in the VIX as observed in Fig. 6.1.
The logarithmic returns in Fig. 6.2b identify that there are significant differences in patterns of volatility between African markets. For example, Morocco and Nigeria exhibit high volatility throughout the period with significant increases during the crisis period. Botswana, however, appears more volatile before the crisis period, whereas Mauritius shows relatively low precrisis volatility, which increases significantly during the crisis. Côte d’Ivoire shows an important example of why researchers need to be very careful when modeling with this type of frontier market data. The long period of close to zero returns and the sudden spike around the crisis period reflect periods of limited trading in a low-liquidity market.
Fig. 6.2c provides a graphical presentation of the daily returns of the developed markets. It can be identified that volatility in all these markets increased during the crisis period (toward the end of 2008). The similarities in volatility patterns here can be contrasted with those of the African markets identified in Fig. 6.2b. These differences possibly reflect the stronger financial linkages between US and developed markets, as can be identified in the much higher correlation levels illustrated in Table 6.1.
Table 6.1 shows there to be clear differences in the constant correlation estimates between the United States and African countries and between the United States and developed countries in the precrisis period. This can be seen as a reflection of the strength of developed countries’ financial linkages with the United States. We argue that African frontier countries, with their relatively weak linkages, can be described as being “low integration” countries and developed countries as “high integration” countries. Under normal market conditions, the standard deviations of returns would be expected to be appreciably higher in the higher-risk frontier markets. The fact that this is not the case is possibly a reflection of the extreme volatility levels in developed markets during the crisis period. It can be noted that mean returns in developed markets were negative during this period, and their standard deviations were very high relative to these returns. The values of the kurtosis and skewness presented in Table 6.1 identify that returns do not follow a normal distribution in either set of markets.
3. Hypotheses and Methodology
From the analysis of the data in Section 2, a long period and a series of shorter subperiods have been identified. We have also identified considerable differences in terms of precrisis constant correlations, returns, and risk profiles between African and developed markets. On this basis we identify the following sets of hypotheses.
3.1. Hypothesis 1
The hypothesis that contagion occurred in both African frontier and developed markets during the long crisis period of 2007–09 is formally tested as:
H1.a: There is a statistically significant increase in correlations between US and developed markets over the period 09/15/2008–10/15/2009.
H1.b: There is a statistically significant increase in correlations between US and African frontier markets over the period 09/15/2008–10/15/2009.
3.2. Hypothesis 2
The secondary hypothesis is that the crisis developed as a series of subevents and that contagion events occurred in each of these subperiods. This is formally tested as:
H2.a: There is a statistically significant increase in correlations between US and developed markets over the cumulative subperiods: 09/15/2008–10/10/2008, 09/15/2008–10/17/2008, 09/15/2008–10/27/2008, and 09/15/2008–11/20/2008.
H2.b: There is a statistically significant increase in correlations between US and African frontier markets over the cumulative subperiods 09/15/2008–10/10/2008, 09/15/2008–10/17/2008, 09/15/2008–10/27/2008 and 09/15/2008–11/20/2008.
3.3. Methodology
Contagion literature identifies four commonly used models for investigating contagion and markets’ comovement: (1) time-varying correlation techniques such as the dynamic conditional correlation (DCC) model (Engle, 2002; Chiang et al., 2007), (2) correlation coefficient analysis (King and Wadhwani, 1990; Forbes and Rigobon, 2002), (3) cointegration-based techniques (Longin and Solnik, 1995), and (4) the transmission mechanism approach (Eichengreen et al., 1996; Forbes, 2004).
This chapter adopts the DCC–MGARCH model to test for contagion using daily time-varying correlations. The test for contagion is then a one-tailed hypothesis test for a statistically significant increase in the mean conditional correlation between the precrisis and crisis periods.
Following Forbes and Rigobon (2002), the first step of the procedure is to develop vector autoregression (VAR)–based equations to estimate the residual returns for pairs consisting of the US market and “a second market.” The returns used are 2-day averages; these are used to control for differences in market trading times. It can also be noted that the use of VAR-based mean equations in the MGARCH is necessary to control for high levels of autocorrelation in returns. The equations used take the following format:
 (6.1)
(6.1)
 (6.2)
(6.2)Where r represents returns, i identifies the United States, and j is “a second market.”
The optimal lag structures for these equation pairs are determined using information criteria. Their residuals are then used to estimate time-varying variance equations, which take a GARCH(1,1) format:d
where  is the conditional variance, α0 the intercept, ɛ the standardized residuals, α1 the ARCH parameter, and β1 the GARCH parameter. The conditional correlation coefficients are estimated from the DCC equation:
where Qt is the covariance matrix and  represents residuals standardized by the conditional standard deviation. The model is mean reverting as long as the nonnegative scalars satisfy the constraint: α + β < 1. A significant alpha coefficient value in the DCC equation is also an indication that correlations will vary appreciably over time. The alpha parameter was found to be insignificant for Mauritius, Nigeria, Tunisia, and Zambia. Although other GARCH specifications were tested in respect to these countries, the respective models failed to converge.
The estimated daily time-varying conditional correlations are shown graphically in Appendices 6.1 and 6.2. In order to test for contagion, mean values are calculated for the “precrisis” and “crisis” periods. Comparison-of-means tests are then used to test for contagion where the null hypothesis is that mean daily correlations during the crisis are less than or equal to those in the precrisis period. If the null is rejected, contagion is deemed to have been found. If a statistically insignificant increase in correlation is found, the result is interpreted as interdependence rather than contagion (Forbes and Rigobon, 2002).
This hypothesis is illustrated as:
where y2 and y1 are the mean daily correlation values between countries i and j during the crisis and precrisis periods, respectively. If variances are equal, the pooled variance t-test is used:
 (6.7)
(6.7)where 
n1 = precrisis sample size, and n2 = sample size during crisis.
If variances are unequal, the Satterthwaite (1946) approximation is used:
 (6.8)
(6.8)where  and
and 
and 3.4. Robustness Testing
To add to the robustness of the analysis, an alternative regression-based test is also undertaken to act as a confirmatory test. This takes the form of a test of significance in respect to a regression dummy variable representing the crisis periods.
where Cij,t is the conditional correlation at time t between the United States (i) and the second country (j). Crisis DUMMYt is a dummy variable taking on a value of 1 over the crisis period. A positive and statistically significant parameter value in respect to the dummy variable is an indication that financial contagion has occurred.
4. Results
The results from a series of tests in respect to hypotheses 1 and 2 are presented in Tables 6.2 and 6.3. These show considerable differences in respect to African frontier and developed countries. The results are presented and described next, and possible reasons for the differences found are then discussed in Section 5.
Table 6.2
Comparison-of-Means Based Contagion Tests: Long Crisis Period
| African Markets | Stable Period | Crisis Period | Test for Equality of Variancesb | T-test for Equality of Meansc,d | Evidence of Contagione | |||
| Mean Corr.a | Standard Deviation | Mean Corr.a | Standard Deviation | F | Sig | |||
| Botswana | −0.028 | 0.035 | 0.011 | 0.043 | 30.776 | 0.000 | 12.060*** | Yes |
| Côte d’Ivoire | 0.028 | 0.035 | 0.036 | 0.074 | 187.983 | 0.000 | 1.659** | Yes |
| Mauritius | 0.043 | 0.000 | 0.043 | 0.000 | 24.590 | 0.000 | 1.881** | Yes |
| Morocco | 0.011 | 0.036 | 0.017 | 0.081 | 159.192 | 0.000 | 1.060 | No |
| Namibia | 0.342 | 0.217 | 0.318 | 0.093 | 164.047 | 0.000 | −1.965 | No |
| Nigeria | 0.043 | 0.000 | 0.043 | 0.000 | 4.982 | 0.026 | 0.904 | No |
| Tunisia | 0.066 | 0.002 | 0.066 | 0.002 | 1.811 | 0.179 | 0.935 | No |
| Zambia | −0.016 | 0.000 | −0.016 | 0.000 | 8.478 | 0.004 | −1.269 | No |
| Developed Markets | ||||||||
| Canada | 0.763 | 0.112 | 0.828 | 0.046 | 121.101 | 0.000 | 10.486*** | Yes |
| France | 0.713 | 0.053 | 0.745 | 0.053 | 4.051 | 0.045 | 7.795*** | Yes |
| Germany | 0.664 | 0.059 | 0.769 | 0.030 | 67.056 | 0.000 | 30.620*** | Yes |
| Italy | 0.531 | 0.101 | 0.567 | 0.052 | 123.984 | 0.000 | 6.169*** | Yes |
| Spain | 0.602 | 0.065 | 0.704 | 0.046 | 34.937 | 0.000 | 23.574*** | Yes |
| United Kingdom | 0.665 | 0.033 | 0.720 | 0.028 | 3.672 | 0.056 | 22.150*** | Yes |

a Mean daily time-varying correlation over the period.
b Levine’s test of variance equality; where rejection of the null hypothesis indicates inequality.
c The t-value reported is the form appropriate for the variance identified.
d *Significant at 10%, **significant at 5%, ***significant at 1%.
e Contagion is defined as statistical significance at 5% level. Note that the test results for Mauritius, Nigeria, Tunisia, and Zambia need to be treated with caution due to an insignificant alpha in the DCC model.
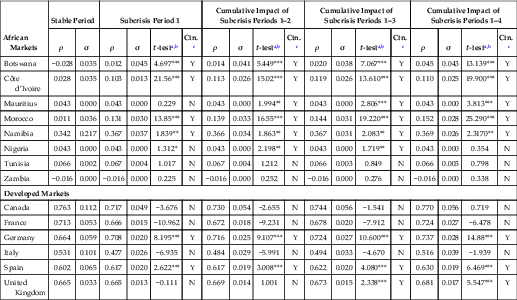
Table 6.3
Comparison-of-Means Based Contagion Tests: Subcrisis Periods
| African Markets | Stable Period | Subcrisis Period 1 | Cumulative Impact of Subcrisis Periods 1–2 | Cumulative Impact of Subcrisis Periods 1–3 | Cumulative Impact of Subcrisis Periods 1–4 | |||||||||||||
| ρ | σ | ρ | σ | t-testa,b | Ctn.c | ρ | σ | t-testa,b | Ctn.c | ρ | σ | t-testa,b | Ctn.c | ρ | σ | t-testa,b | Ctn.c | |
| Botswana | −0.028 | 0.035 | 0.012 | 0.045 | 4.697*** | Y | 0.014 | 0.041 | 5.449*** | Y | 0.020 | 0.038 | 7.067*** | Y | 0.045 | 0.043 | 13.139*** | Y |
| Côte d’Ivoire | 0.028 | 0.035 | 0.103 | 0.013 | 21.56*** | Y | 0.113 | 0.026 | 15.02*** | Y | 0.119 | 0.026 | 13.610*** | Y | 0.110 | 0.025 | 19.900*** | Y |
| Mauritius | 0.043 | 0.000 | 0.043 | 0.000 | 0.229 | N | 0.043 | 0.000 | 1.994** | Y | 0.043 | 0.000 | 2.806*** | Y | 0.043 | 0.000 | 3.813*** | Y |
| Morocco | 0.011 | 0.036 | 0.131 | 0.030 | 13.85*** | Y | 0.139 | 0.033 | 16.55*** | Y | 0.144 | 0.031 | 19.220*** | Y | 0.152 | 0.028 | 25.290*** | Y |
| Namibia | 0.342 | 0.217 | 0.367 | 0.037 | 1.839** | Y | 0.366 | 0.034 | 1.863** | Y | 0.367 | 0.031 | 2.083** | Y | 0.369 | 0.026 | 2.3170** | Y |
| Nigeria | 0.043 | 0.000 | 0.043 | 0.000 | 1.312* | N | 0.043 | 0.000 | 2.198** | Y | 0.043 | 0.000 | 1.719** | Y | 0.043 | 0.000 | 0.354 | N |
| Tunisia | 0.066 | 0.002 | 0.067 | 0.004 | 1.017 | N | 0.067 | 0.004 | 1.212 | N | 0.066 | 0.003 | 0.849 | N | 0.066 | 0.003 | 0.798 | N |
| Zambia | −0.016 | 0.000 | −0.016 | 0.000 | 0.225 | N | −0.016 | 0.000 | 0.252 | N | −0.016 | 0.000 | 0.276 | N | −0.016 | 0.000 | 0.338 | N |
| Developed Markets | ||||||||||||||||||
| Canada | 0.763 | 0.112 | 0.717 | 0.049 | −3.676 | N | 0.730 | 0.054 | −2.655 | N | 0.744 | 0.056 | −1.541 | N | 0.770 | 0.056 | 0.719 | N |
| France | 0.713 | 0.053 | 0.666 | 0.015 | −10.962 | N | 0.672 | 0.018 | −9.231 | N | 0.678 | 0.020 | −7.912 | N | 0.724 | 0.027 | −6.478 | N |
| Germany | 0.664 | 0.059 | 0.708 | 0.020 | 8.195*** | Y | 0.716 | 0.025 | 9.107*** | Y | 0.724 | 0.027 | 10.600*** | Y | 0.737 | 0.028 | 14.88*** | Y |
| Italy | 0.531 | 0.101 | 0.477 | 0.026 | −6.935 | N | 0.484 | 0.029 | −5.991 | N | 0.494 | 0.033 | −4.670 | N | 0.516 | 0.039 | −1.939 | N |
| Spain | 0.602 | 0.065 | 0.617 | 0.020 | 2.622*** | Y | 0.617 | 0.019 | 3.008*** | Y | 0.622 | 0.020 | 4.080*** | Y | 0.630 | 0.019 | 6.469*** | Y |
| United Kingdom | 0.665 | 0.033 | 0.665 | 0.013 | −0.111 | N | 0.669 | 0.014 | 1.001 | N | 0.673 | 0.015 | 2.338*** | Y | 0.681 | 0.017 | 5.547*** | Y |
a As in Table 6.2, the t-value reported is appropriate for the form of variance identified.
b *Significant at 10%, **significant at 5%, ***significant at 1%.
c Contagion (Ctn.) is defined as statistical significance at 5% level. Note that the test results for Mauritius, Nigeria, Tunisia, and Zambia need to be treated with caution due to an insignificant alpha in the DCC model. For example, contagion shown in periods 1–2 in respect to Nigeria reflects changes in correlation beyond three decimal places.
Table 6.2 identifies evidence of contagion in both data sets over the long period (09/15/2008–10/15/2009). Although evidence of contagion is found in all developed markets, the picture in Africa is mixed. Contagion is found in Botswana, Côte d’Ivoire, and Mauritius. Increases in correlation that were not statistically significant at 5% were also found in respect to Morocco, Nigeria, and Tunisia. Reductions in correlation are found in Namibia and Zambia.
A series of interesting differences between African frontier and developed markets are also found in respect to hypothesis 2. These primarily relate to the issue of timing, as they suggest that, although the crisis had an immediate contagion effect in Africa, contagion to developed markets proceeded at a much slower pace.
The results in respect to the first subperiod (09/15/2008–10/10/2008) appear to suggest that contagion developed faster in the African markets. Contagion was identified in Botswana, Côte d’Ivoire, Morocco, and Namibia. It can be noted that lack of contagion found in the other African markets has to be treated with caution (they showed an insignificant alpha in the DCC–MGARCH model). It is noticeable from Table 6.3 that a number of the developed markets that had initial high levels of correlation with the US market had a reduction in correlation during this first period (Canada, France, Italy, and the United Kingdom). Germany and Spain are the only developed markets to exhibit contagion in this early crisis phase.
The cumulative impact of subperiod 1–2 resulted in further increases in correlations for Botswana, Côte d’Ivoire, Morocco, and Namibia. In developed countries there was a considerable increase in Germany and less marked increases in Italy, France, and the United Kingdom.
As the crisis moved to its later phases (cumulative subperiod 1–4), the increases in correlation shown in the African frontier markets was maintained. This manifests itself in contagion terms in Botswana, Côte d’Ivoire, Morocco, and Namibia. In developed markets it can be noted that there is evidence of contagion and interdependence spreading more widely, with Germany, Spain, and the United Kingdom all showing contagion effects and with interdependence also being found in Canada and France.
4.1. Robustness Tests
With the statistical power of comparison-of-means tests questionable under some circumstances, dummy variable regressions were run to test for the robustness of results. There are some marginal differences between Tables 6.3 and 6.4. For example, in respect to subperiod 1 in African markets, the differences found in relation to Nigeria and Tunisia can, however, be discounted for the statistical reasons described earlier. This leaves Namibia, where, although the comparison- of-means test shows evidence of contagion, the dummy test indicates no contagion. There is also some difference in respect to the developed markets. For example, Spain indicates contagion for subperiod 1 in Table 6.3 but not in Table 6.4.
Table 6.4
Dummy Variable Based Robustness Tests for Contagion: All Periods
| African Markets | Long Crisis Period | Subcrisis Period 1 | Cumulative Impact of Subcrisis Periods 1–2 | Cumulative Impact of Subcrisis Periods 1–3 | Cumulative Impact of Subcrisis Periods 1–4 | ||||||||||
| Dummy Coefficient | t-valuea | Ctn.b | Dummy Coeff. | t-valuea | Ctn.b | Dummy Coeff. | t-valuea | Ctn.b | Dummy Coeff. | t-valuea | Ctn.b | Dummy Coeff. | t-valuea | Ctn.b | |
| Botswana | 0.039 | 12.642*** | Y | 0.040 | 4.697*** | Y | 0.042 | 5.449*** | Y | 0.048 | 7.067*** | Y | 0.073 | 13.139*** | Y |
| Côte d’Ivoire | 0.008 | 1.874** | Y | 0.075 | 8.912*** | Y | 0.085 | 11.316*** | Y | 0.092 | 13.609*** | Y | 0.082 | 15.377*** | Y |
| Mauritius | 0.000 | 2.001** | Y | 0.000 | 0.229 | N | 0.000 | 3.746*** | Y | 0.108 | 7.346*** | Y | 0.130 | 11.229*** | Y |
| Morocco | 0.006 | 1.221 | N | 0.120 | 13.846*** | Y | 0.128 | 16.553*** | Y | 0.000 | 4.861*** | Y | 0.000 | 5.699*** | Y |
| Namibia | −0.024 | −1.710 | N | 0.025 | 0.513 | N | 0.024 | 0.548 | N | 0.132 | 19.224*** | Y | 0.141 | 25.291*** | Y |
| Nigeria | 0.000 | 0.967 | N | 0.000 | 2.190** | Y | 0.000 | 2.198** | Y | 0.025 | 0.648 | N | 0.027 | 0.856 | N |
| Tunisia | 0.000 | 0.935 | N | 0.001 | 2.332*** | Y | 0.001 | 2.514*** | Y | 0.000 | 1.719** | Y | 0.000 | 0.560 | N |
| Zambia | 0.000 | −1.449 | N | 0.000 | 0.225 | N | 0.000 | 0.252 | N | 0.099 | 3.731*** | Y | 0.123 | 5.896*** | Y |
| Developed Markets | |||||||||||||||
| Canada | 0.066 | 9.090*** | Y | −0.046 | −1.802 | N | −0.033 | −1.418 | N | −0.018 | −0.873 | N | 0.007 | 0.427 | N |
| France | 0.032 | 7.795*** | Y | −0.046 | −3.906 | N | −0.041 | −3.851 | N | −0.035 | −3.679 | N | −0.025 | −3.345 | N |
| Germany | 0.106 | 27.332*** | Y | 0.045 | 3.387*** | Y | 0.053 | 4.470*** | Y | 0.060 | 5.653*** | Y | 0.073 | 8.628*** | Y |
| Italy | 0.037 | 5.523*** | Y | −0.054 | −2.372 | N | −0.046 | −2.281 | N | −0.036 | −2.001 | N | −0.015 | −1.004 | N |
| Spain | 0.102 | 22.071*** | Y | 0.014 | 0.981 | N | 0.015 | 1.136 | N | 0.020 | 1.660** | Y | 0.027 | 2.919*** | Y |
| United Kingdom | 0.054 | 22.154*** | Y | 0.000 | −0.050 | N | 0.003 | 0.486 | N | 0.007 | 1.249 | N | 0.016 | 3.350*** | Y |

a *Significant at 10%, **significant at 5%, ***significant at 1%.
b Contagion (Ctn.) is defined as statistical significance at 5% level. Note that the same caveat needs to be applied as in Tables 6.2 and 6.3; test results for Mauritius, Nigeria, Tunisia, and Zambia need to be treated with caution due to an insignificant alpha in the DCC model.
Although a number of differences can also be identified in the cumulative subperiod data, the general patterns identified are similar. Both tables indicate that contagion impacted African frontier markets quickly around the onset of the crisis and that it took significantly longer for contagion and interdependence effects to gather pace in developed markets.
5. Discussions
It was identified in Table 6.1 that the precrisis constant correlations were a lot lower in Africa frontier markets (low integration countries) than in developed markets (high integration countries). We also note that this chapter has found contagion to have occurred relatively early in the crisis period in Africa but that it took longer to develop in developed markets. In this section we explore potential behavioral explanations for these differences. We do not test the hypotheses put forward here, though, which means that they should therefore be treated as speculations.
There are massive differences between African frontier markets in terms of size, number of traders, the education of traders, and information systems. We therefore speculate that differences in trading behavior may reflect socionomics-related differences: specifically, information effects, social networking effects, and social mood effects.
Primary information from US financial markets (such as stock prices and volume data) travels almost instantly around the world to both developed and frontier markets. However, before this information is acted upon it has to be interpreted, and this secondary information will often depend on the advice or influence of friends and colleagues, as well as social influences. Social and professional networks are very important in the dissemination and interpretation of this information, and we argue that there are considerable differences between these networks in African and in developed markets. In times of crisis, investors may base their decisions on low-quality information and rumors disseminated through these networks, which can lead to noise trading (Thaler, 1993).
The forms of networks found in developed and frontier markets can be very different. Olsen (2004) suggests that when a network takes on an “aristocratic” structure, the speed with which information and informed opinion pass through society can be significantly faster. The structure, according to Olsen (2004), involves few perceived experts and a large number of investors who trust specific experts. We argue that such “aristocratic networks” are a characteristic of investment communities in frontier Africa, and as a result there is a rapid spread of influence and the emergence of trends. The network effect interacts with the social mood effects (Forgas, 1995; Nofsinger, 2005), and we wonder whether the aristocratic networks in Africa lead to relatively rapid adjustments in the social mood among African investors.
The results in Table 6.3 suggest that African markets reacted more quickly at the onset of the financial crisis than did their developed markets counterparts. We speculate that the reason for this may lie in the small, illiquid nature of African frontier markets resulting in small, aristocratic social networks. African exchanges generally have few listed companies and relatively low levels of capitalization. This will also be reflected in the relatively low numbers of active locally based traders and therefore, by implication, relatively small social networks of these traders. This can be contrasted with the vast, and liquid, nature of developed markets with large numbers of both active professional and nonprofessional traders. The social networks in these markets are, by implication, going to be much larger than those found in African markets. Whereas in African markets there may be a few dominant opinion formers in the social network, in developed-market social networks there are likely to be a number of competing high-profile opinion formers. This suggests to us that the generation of consensus in African market social networks is likely to be substantially quicker than the generation of consensus in their developed-market counterparts.
It has been suggested that social networking effects can be viewed as a vector of noise trading (Gai and Kapadia, 2010; Olsen, 2004). These processes are of particular importance in Africa, where it has been reported that markets are characterized by the concentration of trading in few stocks and the dominance of a few companies on the exchanges (Allen et al., 2011; Tafirenyika, 2012). Control of these stocks is often dominated by a few individuals or families. This would suggest that these individuals are dominant players within the aristocratic social networks found in Africa, and therefore information coming from them will spread quickly and can act as a vector of noise trading in the markets. This could, in turn, lead to herding behavior.
The implication of these differences in Africa for herding behavior within markets is likely to be highly significant. Specifically, it suggests that herding may occur at a faster speed in Africa, as secondary-information-based consensus is likely to develop at a faster rate.
The case for herding being found in this study is strong, given the observed increases in correlation (Prechter, 1985, 1999). It can also be noted that Hwang and Salmon (2009) argue that in developed markets the herding process can be relatively slow to develop (looked at in the context of stock market bubbles, which, they argue, can take a number of years to develop). We argue that in the 2007–09 crisis herding occurred more rapidly in African frontier markets than in developed markets and that this is reflected in our results.
Although speed of herding appears to be the most likely reason for the differences in the speed of contagion observed between African frontier and developed markets, other behavioral-related differences may also have been significant as well. We outline these later.
5.1. Decision Fatigue in Africa
From a behavioral perspective we can ask how the attitude of investors changed as subsequent phases of the crises unfolded. Did they become habituated to crisis in the United States and stop responding? We contend that the African data show evidence of decision fatigue. For instance, the correlations in Botswana, Côte d’Ivoire, and Morocco show increasing levels from the stable period through the cumulative impact of subperiod 1–4. However, it can be noted that the correlations dropped in the long period, which suggests that behavior changed. This, we speculate, was due to decision fatigue. Mood could have played a role in this regard. As the markets are small and moods are shared more quickly as a result of social networks, fatigue effects were likely to develop more quickly in African markets.
5.2. Loss Aversion in Developed Markets
Slow herding in developed markets may also be partly a function of greater loss aversion. Loss aversion can lead to a disposition effect whereby investors hold off realizing their losses until a final market capitulation occurs. It may very well be that the combination of the impact of slow decision making in large social networks and a disposition effect may explain the relatively slow process of herding becoming instigated between developed markets.
6. Conclusions
The key objective of this chapter has been to assess the impact of the 2007–09 financial crisis on financial contagion on African frontier markets. The 2007–09 crisis was unique from a contagion perspective, given that it was a truly global event that had a significant impact on most of the world’s financial markets. This has presented us with a unique opportunity to examine the impact of a single event on different types of markets (developed and frontier).
A number of previous papers in the contagion literature have identified herding as contributing to the transmission of crises. However, these have failed to identify the importance of the speed of the herding process in the transmission of contagion.
The contribution of this chapter is that we have identified differences in the speed with which contagion developed in African frontier markets and developed markets. We have also outlined a potential herding-related theoretical reason for this difference in speed—namely, that secondary information is processed and applied at a far quicker rate in markets where small social networks are observed.
The findings of this chapter will help African policy makers in their considerations of how to contain, and mitigate the impact of financial contagion on the continent. This research provides insights into the issue of contagion from the African frontier perspective. It is paramount for policy makers to be aware that it is unlikely that Africa will be immune from any future global financial crisis.
Appendix 1: Time-Varying Correlations of US with African Markets

Appendix 2: Time-Varying Correlations of US with Developed Markets

..................Content has been hidden....................
You can't read the all page of ebook, please click here login for view all page.