
Chapter 1
Herding in Middle Eastern Frontier Markets: Are Local and Global Factors Important?
N. Demir†
M.N. Solakoglu Bilkent University, Department of Banking and Finance, Bilkent, Ankara, Turkey
Abstract
In this study we look for sentimental herding in a sample of frontier markets in the Middle East, using a state-space approach. The stock markets we consider are Oman, Bahrain, Qatar, and Kuwait. We use daily data to estimate monthly betas from a market model and test to see whether estimated monthly betas are biased, which would indicate the existence of herding or adverse herding. We also analyze the effect of extreme global and local events, and market conditions, on herding behavior. For extreme global market conditions we use major events such as the 2007–08 global financial crisis, as well as extreme variations in market returns. Furthermore, given the significance of petroleum in these markets, extreme price changes in spot-oil prices are also used for extreme market conditions. As for local events, we also test to see if events during the so-called Arab Spring in the region—eg, the Syrian internal war and Egyptian political movements—have had any impact on herd behavior. We find the existence of herding and adverse herding in Kuwait and Qatar, but not in Bahrain and Oman, revealing that market category is not a determinant of herding. In addition, our results show that while herding in Kuwait is influenced by local and global factors, herding in Qatar is influenced by oil returns and oil return volatility.
Keywords
herding
state-space model
cross-sectional volatility
frontier market
JEL Classification
C12
C31
G12
G14
1. Introduction
Herding may be simply defined as copying the behavior of other investors intentionally or unintentionally (Bikhchandani and Sharma, 2001). Although herding can lead to market inefficiencies, for the individuals themselves herding behavior can be assumed to be rational (Hwang and Salmon, 2004). The question of why some investors/traders disregard market fundamentals in equity markets and follow what others do (Borensztein and Gelos, 2000) still remains open to discussion, despite evidence in the literature that herding is, in fact, an important type of investment behavior typical in developing markets rather than advanced ones. Theories and empirical research on herding have not seemed to converge yet on a generally accepted norm and computation. Hence, there is no generally accepted method that separates investor behavior due to herding or reaction to fundamentals (Hwang and Salmon, 2007).
There are different approaches to testing for herding, which can be classified into two groups. One group of studies focuses on explaining the behavior of investors—either institutional or private—in following the actions of others, a phenomenon which can be classified as rational when such investors are following the majority or a group of investors who may be perceived to have access to better information (Oehler and Chao, 2000; Gompers and Metrick, 2001; Kim and Sias, 2005; Puckett and Yan, 2007).
The second group of studies employs a “market-wide” approach, focusing on the cross-sectional standard deviation (CSSD) of dispersion of returns (Christie and Huang, 1995) and the cross-sectional absolute deviation (CSAD) of returns (Chang et al., 2000). Hwang and Salmon (2004) focus on the dispersion of beta coefficients instead of returns. Cross-sectional convergence or divergence of returns under extreme market conditions (Christie and Huang, 1995; Chang et al., 2000) assumes implicitly that investors’ behavior is based on total risk: market risk as well as firm-specific risks. In contrast, Hwang and Salmon (2004) focus on beta coefficients, given that the capital asset pricing model (CAPM) accounts only for market risks. Assuming that herding is an outcome of unobserved investors’ sentiment rather than market fundamentals, Hwang and Salmon (2004) use a state–space model to reveal herd behavior in the market empirically. Put simply, they assume that sentimental herding is proportional to the deviations of the true and unobserved betas from the unity; that is, the market beta. Hence the biased betas may follow certain dynamic paths, either converging toward (herding) or diverging from (adverse herding) the market beta depending upon investors/traders’ sentiments, given the economic, political, and social environment.
In this study, we look for sentimental herding in four Middle Eastern frontier markets: Bahrain, Kuwait, Oman, and Qatar. All of these countries are members of the Gulf Cooperation Council (GCC). In general, we can assume that investors/traders in these markets work with limited market information, and specifically lack firm-specific information on financial outcomes beforehand. Moreover, while there is some degree of openness to foreign investors, this comes with some limitations on market information and tax status.
The Middle East has been experiencing major political instability since the launch of the so-called Arab Spring. Markets within the region cannot possibly escape the likely impacts of the turmoil brought about by political and social events such as the Syrian Civil War,a the Egyptian military intervention,b the ongoing unrest within Iraqi borders, as well as the volatility of the oil prices that are vitally important for the regions’ economies. Middle Eastern stock markets have been considerably instrumental in mobilizing regional resources (eg, oil revenues) and are becoming more and more integrated with international markets, though not as fast as one might expect, given their potential. Markets are relatively new, not fully open, shallower, and smaller in size in terms of market capitalization relative to fully developed global markets. Investors/traders in the region either seem to be skeptical about, or isolated from, the social and political unrest, or lack information on significant events because of policies intentionally pursued to keep markets away from shocks, which may have destabilizing consequences. We learn from earlier empirical studies that markets in the region suffer (despite the efforts of modernization) from an information asymmetry problem, restrictions on foreign capital, issues with tax status, and sharp reversals in oil prices. Thus it is likely that investors/traders are not fully aware of market fundamentals, or even if they are, they ignore them and instead prefer to follow what others do.
The number of studies about Middle Eastern stock markets has grown rapidly in the last decade, due mostly to rising petroleum prices (returns) and their volatility, as well as the destabilizing effects of the political uprisings in the region. Research about this region aims at:
• Finding evidence of herding and what factors contribute to herding (El-Shiaty and Badawi, 2014; Hammoudeh, 2012; Balcilar et al., 2013a; Demirer and Ulussever, 2011).
• Integration and interactions between markets (Yu and Hassan, 2008; Ravichandran and Maloain, 2010; Cheng et al., 2010; Bouri and Yahchouchi, 2014).
• The association of markets with oil prices (returns) and volatility (Ajmi et al., 2014; Maghyereh and Al-Kandari, 2007).
• The impact of political and global shocks on regional stock markets (Chau et al., 2014).
For example, based on a sample of the 20 most-traded stocks and returns dispersion, El-Shiaty and Badawi (2014) find no herding in the Egyptian stock market. Hammoudeh (2012) detects herding in the extreme return volatilities for all GCC countries except Qatar. Demirer and Ulussever (2011) find herding based on returns dispersion in some of the Middle Eastern markets and conclude that oil prices are the driving force for herding behavior. Balcilar et al. (2013a), working with a dynamic model in the GCC countries, find (among other things) that herding in these frontier markets can be explained by global financial systematic risks. On the interdependency and integration of markets, Assaf (2003) finds that GCC stock markets are interdependent and that Bahrain plays an especially dominant role. He adds that the markets of the GCC are not fully efficient in processing regional news, especially concerning asymmetric information. Lagoarde-Segot and Lucey (2007) conclude that Middle Eastern and North African (MENA) markets are beginning to move toward international financial markets and point out that, in the region, Israel and Turkey are the most promising markets, followed by Egypt and Jordan. They also find in their later work (Lagoarde-Segot and Lucey, 2008) that MENA markets are more noticeably emerging markets than the markets of other emerging regions, such as Latin America and Eastern Europe, but that they lag behind Asian emerging markets. Yu and Hassan (2008), Ravichandran and Maloain (2010), and Cheng et al. (2010), looking at integration among Middle Eastern markets and with global markets, as well as the impact of global markets on Middle Eastern markets, conclude that integration is limited. Similarly, Chau et al. (2014), studying the impact of the Arab Spring on stock market volatility in MENA stock markets, conclude that there is little evidence that MENA markets, in the aftermath of the political uprising, are integrated with international markets. Interestingly, they also pointed out that financial asset prices are driven by political events as well as by common financial and economic factors. Bouri and Yahchouchi (2014) observe that MENA markets are interconnected by their volatilities through spillover effects, not by their returns. Finally, Ajmi et al. (2014) report significant interaction between oil prices and MENA stock markets. However, the findings on the impact of oil prices and/or returns on the region’s markets are not unanimous. Some find significant links between oil and stock markets (Basher and Sadorsky, 2006; Maghyereh and Al-Kandari 2007). Others find no direct effect or no significant impact of oil prices on stock markets (eg, Hammoudeh and Nandha, 2007; Khalifa et al., 2014). For example, Choi and Hammoudeh (2006) study the responses of five stock markets in the GCC to three global factors, including that of the WTI (West Texas Intermediate) oil spot-price index, and find that changes in oil prices have no direct effect on these GCC markets. On the other hand, Hammoudeh and Nandha (2007) work with a sample of 15 countries in the Asia-Pacific region, but find that only the stock markets in the Philippines and South Korea are sensitive to oil price changes. Still others refer to oil prices and/or returns as the underlying driving forces for herding behavior wherever they are detected (Demirer and Kutan, 2006; Tan et al., 2008; Balcilar et al., 2013b).
We contribute to the existing literature on herding by searching for answers to the following two specific questions: (1) have investors/traders in the four Middle Eastern frontier stock markets engaged in sentimental herding? and (2) have region-specific and global events affected herding in markets in which herding has been revealed? Answers to these questions are important because herding in the market can lead to mispricing of assets and bias views about returns and risks (Hwang and Salmon, 2004), and the presence of herding can be destabilizing and induce excess volatility in the financial markets as well as create price bubbles (Patterson and Sharma, 2007). Given that studies on herding in the region cited previously all focus on return dispersions, it is tempting to isolate sentimental herding based on the dispersion of betas (Hwang and Salmon, 2004, 2007).
It has been observed that generally people in the Middle East behave in an emotional manner and in particular than those who are not sufficiently informed about market fundamentals can be expected to herd, as they feel (perhaps instinctively) that they should be doing what others are doing. In other words, they may be looking for safety in cases in which they expect better outcomes by imitating others instead of relying on their own judgment. The root cause of herding, based on returns dispersions wherever detected in the region, is reported to be a problem of ignorance or asymmetric information and other factors, such as shocks from oil prices (Assaf, 2003; Lagoarde-Segot and Lucey, 2007; Balcilar et al., 2013b; Demirer and Ulussever, 2011). In this study, we also assume that beta-based sentimental herding in the market is practiced by those who face an information asymmetry problem and are anxious about signals received from the financial, political, and even social environments: simply, they prefer free riding (Truman, 1994; Kallinterakis and Ferreira, 2014) because the information comes at no cost of and there is no time-consuming effort involved in making decisions. In support of this argument there is recent and rather strong evidence (Solakoglu and Demir, 2014), at least for the Turkish stock market (the BIST), that uninformed investors/traders of the second national market show significant sentimental herding in contrast to the well-informed investors in the BIST 30 (an index covering the country’s top 30 corporations). Hence a model such as that of Hwang and Salmon (2004) may explain regional investors/traders’ behavior better and reveal unobserved sentimental herd behavior, if it in fact exists. As we mentioned in the introduction, the Middle East has been a pressure cooker, with recent turbulence brought about by popular uprisings, some of which have ended—such as the military takeover in Egypt—and with the consequences of some still continuing—such as the civil war in Syria and the unsettled internal struggle in Iraq. The political instability since the inception of the Arab Spring is likely to have affected markets within the region. Moreover, several studies cited previously point out the widespread impact of not only those political events but also oil prices on stock prices and herding in the region. The sample of markets studied constitutes less than 2% of the US market in market capitalization. In terms of market capitalization, Qatar is the largest market (close to 150 billion US dollars) and Oman is the smallest (around 30 billion US dollars). As for the relative size, or market cap/GDP, Qatar ranks first (about 111%) and Oman last (about 38%).
2. The Empirical Model
The hypothesis of Hwang and Salmon (2004) emphasizes the sentimental herding behavior of investors, a phenomenon which is unobservable and moves in association with the systematic risk indicator beta. They also use the cross-sectional behavior of assets, similarly to Christie and Huang (1995). However, given the focus of the CAPM, their model is different, as it assumes the notion of market-wide herding based on betas emphasizing the systematic risk, rather than the systematic and idiosyncratic risks, associated with returns. In market-wide herding, an investor may decide to follow other investors, and this may cause the individual asset returns to move in tandem with the market returns. As the sentiments of the investors vary, the beta values of the stocks will also change from their constant initial values and will confine themselves to the market beta of unity.
The model, which is based on a relationship between observed biased beta  and unobserved true beta (βimt) is as follows:
 (1.1)
(1.1)where  is the biased short-run conditional expectation for the excess returns of asset i at time t (omitting the country subscript for simplicity), and
  is the conditional expectation for the market excess return at time t. The unobserved herd behavior indicator
  is a parameter assumed to be proportional to the deviation of individual true beta from market beta, or unity. The cross-sectional variation of
  is:
is:
And for the logarithms of Eq. 1.2, we get:
We may now rewrite Eq. 1.3 as:
where  is an assumed constant in the short run and
  . Hwang and Salmon (2004) now allow herding, Hmt, to follow a dynamic process AR(1), and the system becomes:
where the two error terms,  and
and  , respectively, and the cross-sectional standard deviation for each month t and an n number of equities is calculated as follows:

The two equations in Eq. 1.5 constitute the standard state–space model, or Model 1. One of the key parameters of interest in Eq. 1.5 is the variance of the error term of state equation  . When is zero, it would imply that there is no herding, as Hmt = 0 for all t. A statistically significant value of , however, would indicate the presence of herding in the market. Furthermore, a significant ϕm, provided |ϕm|≤1, would support the autoregressive process AR(1). Hwang and Salmon (2004) further tested the robustness of their model by including both market volatility and market returns in the signal equation of the model. They argued that if Hmt becomes insignificant after the inclusion of these market fundamentals in the model, then changes in
  can be explained by market fundamentals rather than by herding. Model 1 can therefore be modified to include the following fundamentals:
 (1.6)
(1.6)
where ln σmt and rmt represent log market volatility and return in time period t. The two equations in Eq. 1.6 constitute Model 2.
Our focus is on the dynamics of the herding parameter, hmt = 1 − exp(Hmt), where Hmt is the latent state variable assumed to follow an AR(1) process. Once empirical estimates of the herding parameters are derived, one question that immediately follows is whether sentimental herding occurs within the domestic market only; that is, is sentimental herding a country-specific behavior, or is it also associated with other markets (Hwang and Salmon, 2004)? A simple test would be to check the significance of the correlation coefficients of herding scores among markets. Another question is what factors (such as global events, oil prices, and region-specific political events) explain changes in hmt in each of the markets in which sentimental herding is detected. Given the time frame of the data considered in this study, we hypothesize that shock events—such as the mortgage crisis, the Syrian Civil War, the Egypt political intervention, oil returns, and volatilities in returns—constitute significant factors in explaining sentimental herding within the region. The multiple regression equation employed is as follows:
 (1.7)
(1.7)where  . For the mortgage crisis, Dcrisis = 1 for the months during 2007–08, but is otherwise “0,” for the Syrian Civil War, DSyr = 1 from the beginning of Mar. 2011 through the end of the sample period, but is otherwise “0,” for the Egyptian military intervention DEgypt = 1 from Jul. 2013 to Jul. 2014, when the presidential election ended, but is otherwise “0,”c roil is the log of world Brent oil price returns; and ln(SDoil) is the log of the standard deviation of oil returns that stands for oil return volatility (a risk indicator for the region).
3. Data and Findings
The datad used for the analysis are the daily log of returns obtained from Datastream database, including national indices and stock prices covering roughly 30,000 daily observations. The range of data differs from market to market. Beta estimates are obtained using the ordinary least squares (OLS) method and based on the market model using daily data over monthly intervals. Returns on stocks and markets average close to zero, and are mildly skewed to the left with no excess kurtosis for all markets. The coefficients of variations reflect the relative risks in the region’s markets, which may be explained by the relatively small size and immaturities of the markets, a feature that underlies regional markets in general. The descriptive statistics indicate that is significantly different from zero for all markets. The Jarque–Bera statistics for normality clearly suggest that the distributions of for the markets in the study are not Gaussian. However, the log of the CSSDs does not seem to deviate significantly from Gaussianity—there are significant reductions in the values of Jarque–Bera statistics.
Table 1.1 presents the Kalman-filter estimates of the state–space model (Model 6) for the four frontier markets. The findings may be summarized as follows:
1. When market returns and return volatilities are inserted (Model 6), the parameters of Model 5 continued to be highly significant for two of the markets—Kuwait and Qatar—whereas the key parameters ϕm (the persistence indicator) of AR(1) and (the variance of the state equation) were insignificant for the remaining two frontier markets: Bahrain and Oman. These findings provide evidence to conclude that sentimental herding has occurred in two of the markets— Kuwait and Qatar—but not in the other two markets—Bahrain and Oman. It appears that the driving forces for sentimental herding in the region are factors other than market category. The only answer we can speculate about at this stage is that investors/traders in these markets are generally small and medium in size, act individually, and make decisions in line with what others do, even if markets are open widely to international markets with modern facilities. Simply, the problem may be of size. Another reason that may underline herding in these markets may be the mixture of stocks that are Shariah compliant and those that are noncompliant. We speculate that the heterogeneity of investors/traders due to religious restrictions imposed on stocks may be the driving force for herding or not herding.
2. The persistence parameters—that is, the autoregressive coefficient of the AR(1) process—range between 0.797 for Qatar and 0.915 for Kuwait, and all are highly significant.e This indicates that of the variance in Hmt, for the Qatar market 64% is explained by a 1-month lag of Hmt, while for the Kuwait market the explained variance is 84%. This is important because our sample of data indicates that herding dies out more quickly in Qatar than in Kuwait when market equilibrium is restored.f
3. Market return is highly significant with a negative sign in Kuwait, but not significant in Qatar. It appears that returns diminish beta dispersion and hence explain some of the contraction in beta dispersion not counted as herding.
4. Market risk (return volatility) is highly significant with a positive sign in both Qatar and Kuwait. The beta dispersion appears to be driven also by market risk in both markets.
5. The signal ratios range between 5.1% for Kuwait and 8.20% for Qatar. They all indicate that sentimental herding has been mild in the two markets over the period studied.
6. We should also point out that the Akaike information criteria of Model 6 (with robust tests) for each market was smaller than that of the base solutions (Model 5), reflecting the fact that inclusion of the market returns and volatilities improve the explanatory power of the models.
Table 1.1
Estimation Results for Sentimental Herding (Model 6)
| Parameters | Herding detected | No herding | ||
| Kuwait | Qatar | Bahrain | Oman | |
| μm | −3.126** | −3.568** | −2.077** | −2.713** |
| ϕm | 0.915** | 0.797** | 0.822n | 0.438n |
| σmη | 0.044** | 0.046** | 0.000n | 0.0203* |
| σmv | 0.011** | 0.446** | 0.144** | 0.044** |
| Market ret. | −21.01** | 8.72n | −12.678n | −19.589n |
| Market vol. | 0.521** | 0.552** | −0.430** | −0.512** |
| σmη/SDLnβ % | 5.20 | 8.20 | ||
| Log-lik. | 13.32 | −61.02 | −54.775 | −6.951 |
| Akaike | −0.12 | 1,193 | 0.996 | 0.259 |

Highly significant, **; significant, *; insignificant, n.
Table 1.2
Data Coverage of Sample Countries
| Month–year range | Bahrain | Kuwait | Oman | Qatar |
| Begins | Jan. 2004 | Jan. 2004 | Nov. 2005 | Jan. 2005 |
| Ends | May. 2014 | Feb. 2014 | May. 2014 | May. 2014 |
| No. of months | 122 | 122 | 100 | 110 |

Figs. 1.1 and 1.2 show line charts of sentimental herding for the two markets (Kuwait and Qatar) in which herding was revealed. Inspection of these chart patterns, along with the regression results in Table 1.3, gives a better understanding of how global and region-specific events affected herding scores. The charts show that sentimental herding was mild in Qatar (swings between +0.2 and −0.3) but more volatile in Kuwait (swings between +0.4 and −0.3). The signal ratios (Table 1.3) ranging between 5.1% and 8.2% generally confirm the smooth herding patterns.
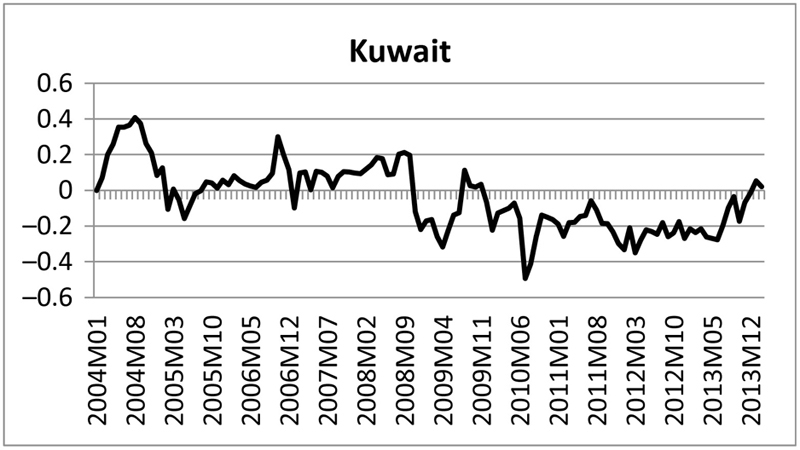
Figure 1.1 Herding pattern for Kuwait.
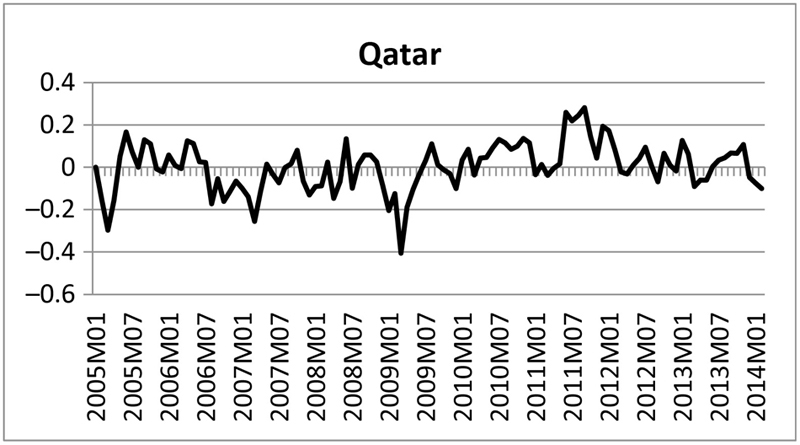
Figure 1.2 Herding pattern for Qatar.
Table 1.3
The Effect of Local and Global Factors on Herding
| Variables | Kuwait | Qatar |
| Mortgage crisis | 0.082 (0.037)** | −0.039 (0.017) |
| Syrian Civil War | −0.233 (0.040)** | 0.036 (0.028) |
| Egypt’s Coup D’état | 0.159 (0.063)** | −0.052 (0.044) |
| Oil returns | −0.026 (0.034) | −0.054 (0.025)** |
| Oil return volatility | −0.011 (0.020) | −0.033 (0.015)** |
| Adj. R-square | 0.306 | 0.125 |
| No. of observations | 122 | 110 |
Standard errors are provided in parentheses.
Highly significant, **α=0.01; significant, *α=0.05; insignificant, no script.
As for the regression results, our overall assessment is that while herding in the Kuwait market was significantly influenced by the mortgage crisis and the two major region-specific events, herding in the Qatar market was affected by the dynamics of the oil market, rather than the global crisis and regional events (Table 1.3). One explanation of why the Qatar market was not affected by the mortgage crisis may be Qatar’s opennessg to the flow of news and market information, and hence its higher degree of awareness of developments in international markets. It is widely known that the mortgage crisis brought about a mass outflow of foreign funds from developing markets in general, but in particular from frontier and emerging markets, with the deterioration in their financial markets. However, given the fact that Middle Eastern financial market investors/traders do not invest in derivative markets in significant amountsh and are generally individual investors with little investment in mortgage-linked stocks, a ruinous impact from the crisis was not expected. It appears that the crisis amplified the herd behavior for Kuwait, as the respective coefficient is positive and significant. It seems that investors/traders in the Kuwait market, contrary to those in Qatar market, were not ready for or conscious enough about the avalanche of the global crisis beforehand, and hence the mortgage crisis was a sudden unexpected shock to them “…in the sense that nobody was sure where the market was heading” (Hwang and Salmon, 2004). Hence investors/traders not knowing what to do turned to the fundamental values of firms, through adverse herding, as a result of which asset prices reverted back to the long-term risk-return equilibrium. This phenomenon boils down to the simple fact that investors/traders who are small and medium in size and yet constitute the majority in these markets had little or no access to market information at a time when it was most needed, and hence they were confused when the shock occurred.
Looking now at the political front, the Syrian Civil War, which started with small protests in Syria in Jan. 2011 and turned into mass protests against the government in Mar. 2011, has been continuing so far with intensified fighting between the Syrian army and the so-called Free Syrian Army and its allied forces. While Syria is suffering harsh effects from the deterioration of its economic and social life, the question of security within the region is serious and its impact on the region’s stock markets is worthy of investigation. From the regression estimates of Table 1.3, we see that herding in Kuwait is significantly linked to the conflict in Syria and the Egyptian military intervention in Jul. 2013. However, the coefficient of the dummy for the Syrian event is negative and for the dummy of the Egyptian event is positive, while both are significant. While the Syrian conflict lessened herd behavior, the Egyptian event amplified herding oscillations. The net effect of the two impacts was to create a mild pattern of adverse herding.i In contrast, the reason for insignificant coefficients of dummies for Qatar may be explained by weaker trade and financial connections with Egypt and Syria, as well as by a policy that kept the Qatar market away from these regional events intentionally.
Finally, while we observe no effect on herding in Qatar from the global and region-specific events, its herding is found to be significantly associated with oil market fundamentals. The coefficients of oil returns and return volatility on herding in Qatar (a net exporter of oil) are both highly significant and carry negative signs. They both dampen the swings of the herding path but cause no adverse herding. This finding is again in line with some of the previous studies that volatility in oil prices (returns), as a major source of risk, affects herding (Balcilar et al., 2013b; Demirer and Ulussever, 2011).
In conclusion, based on the findings of the regression, it seems that investors in the Qatar market were more prepared to shocks, perhaps due to better access to market information about the global crisis and the fact that they were kept away from information about region-specific events intentionally, as a result of which sentimental herding was not found in association with any of those events. Qatar investors/traders in the stock market appear to be more concerned about what is happening in the oil market. In contrast, the herding of investors/traders in Kuwait was guided by the mortgage crisis and region-specific events, rather than by the dynamics in the oil market.
4. Conclusions
In this study we looked for sentimental herding (ie, beta herding) in four Middle Eastern frontier stock markets—Kuwait, Qatar, Bahrain, and Oman—using the state–space model proposed by Hwang and Salmon (2004). We also looked for the impact on herding from global economic events—the mortgage crisis and oil returns—and region-specific political events—the Syrian Civil War and the Egyptian military intervention. Beta herding was revealed in Kuwait and Qatar but not in Bahrain and Oman. It appears that the driving forces for sentimental herding in the region are due to factors other than market category, as two of the frontier markets revealed herding while the other two, classified as frontier, did not. From the herding persistency parameter (ϕm), we saw that it took much less time for Qatar herders to go back to a risk–return equilibrium (where hmt = 0) once the market is clear in terms of its direction than those in Kuwait. This may be explained by better market transparency and investors/traders who quickly respond to fundamentals, as they are cognizant of incoming market news. Market return volatility was highly significant with positive signs in markets in which herding was revealed, signaling that the resulting herding was not spurious in either market. On the contrary, herding was still significant in the AR(1) process, even with the presence of variables standing for market movements.
The mortgage crisis was highly significant in herding scores for Kuwait but not in those for Qatar, which can be explained by relatively more market transparency and intermarket connections in Qatar. Contrary to expectations, the impact of the Syrian Civil War and the military intervention in Egypt were limited in the Kuwait market. Interestingly, oil returns and oil return volatility appeared to impact herding behavior only in the Qatar market and not in the Kuwait market.
..................Content has been hidden....................
You can't read the all page of ebook, please click here login for view all page.