
5
Principles and Practice of Image and Spatial Data Fusion*
Ed Waltz and Tim Waltz
CONTENTS
5.2 Motivations for Combining Image and Spatial Data
5.3 Defining Image and Spatial Data Fusion
5.4 Three Classic Levels of Combination for Multisensor Automatic Target Recognition Data Fusion
5.4.2.1 Discrete Model Matching Approach
5.4.2.2 Adaptive Model Matching Approach
5.5 Image Data Fusion for Enhancement of Imagery Data
5.5.3 Three-Dimensional Imagery
5.6 Spatial Data Fusion Applications
5.6.1 Spatial Data Fusion: Combining Image and Nonimage Data to Create Spatial Information Systems
5.6.2 Mapping, Charting, and Geodesy Applications
5.6.2.1 Representative Military Example
5.6.2.2 Representative Crime Mapping Examples
5.7 Spatial Data Fusion in GEOINT
5.1 Introduction
The joint use of imagery and spatial data from different imaging, mapping, or other spatial sensors has the potential to provide significant performance improvements over single-sensor detection, classification, and situation assessment functions. The terms imagery fusion and spatial data fusion have been applied to describe a variety of combining operations for a wide range of image enhancement and understanding applications. Surveillance, robotic machine vision, and automatic target cueing (ATC) are among the application areas that have explored the potential benefits of multiple-sensor imagery. This chapter provides a framework for defining and describing the functions of image data fusion in the context of the Joint Directors of Laboratories (JDL) data fusion model. The chapter also describes representative methods and applications.
Sensor fusion and data fusion have become the de facto terms to describe the general abductive or deductive combination processes by which diverse sets of related data are joined or merged to produce a product that is greater than the individual parts. A range of mathematical operators have been applied to perform this process for a wide range of applications. Two areas that have received increasing research attention over the past decade are the processing of imagery (two-dimensional [2D] information) and spatial data (three-dimensional [3D] representations of real-world surfaces and objects that are imaged). These processes combine multiple data views into a composite set that incorporates the best attributes of all contributors. The most common product is a spatial (3D) model, or virtual world, which represents the best estimate of the real world as derived from all sensors.
5.2 Motivations for Combining Image and Spatial Data
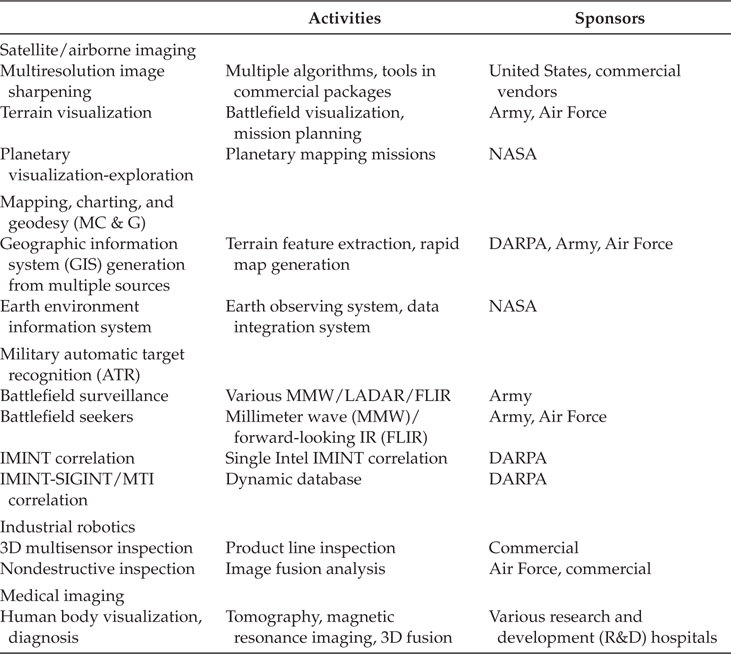
A diverse range of applications have employed image data fusion to improve imaging and automatic detection or classification performance over that of single imaging sensors. Table 5.1 summarizes representative and recent research and development in six key application areas.
Satellite and airborne imagery used for military intelligence, photogrammetric, earth resources, and environmental assessments can be enhanced by combining registered data from different sensors to refine the spatial or spectral resolution of a composite image product. Registered imagery from different passes (multitemporal) and different sensors (multispectral and multiresolution) can be combined to produce composite imagery with spectral and spatial characteristics equal to, or better than, that of the individual contributors.
Composite SPOT™ and LANDSAT™ satellite imagery and 3D terrain relief composites of military regions demonstrate current military applications of such data for mission planning purposes.1, 2 and 3 The Joint National Intelligence Development Staff (JNIDS) pioneered the development of workstation-based systems to combine a variety of image and nonimage sources for intelligence analysts4 who perform:
Registration. Spatial alignment of overlapping images and maps to a common coordinate system
Mosaicking. Registration of nonoverlapping, adjacent image sections to create a composite of a larger area
3D mensuration-estimation. Calibrated measurement of the spatial dimensions of objects within in-image data
TABLE 5.1
Representative Range of Activities Applying Spatial and Imagery Fusion
Similar image functions have been incorporated into a variety of image processing systems, from tactical image systems such as the premier Joint Service Image Processing System (JSIPS) to UNIX- and PC-based commercial image processing systems. Military services and the National Geospatial Intelligence Agency (NGA) are performing cross intelligence (i.e., IMINT and other intelligence sources) data fusion research to link signals and human reports to spatial data.5
When the fusion process extends beyond imagery to include other spatial data sets, such as digital terrain data, demographic data, and complete geographic information system (GIS) data layers, numerous mapping applications may benefit. Military intelligence preparation of the battlefield (IPB) functions (e.g., area delimitation and transportation network identification), as well as wide area terrain database generation (e.g., precision GIS mapping), are complex mapping problems that require fusion to automate processes that are largely manual. One area of ambitious research in spatial data fusion is the U.S. Army Topographic Engineering Center’s (TEC) efforts to develop automatic terrain feature generation techniques based on a wide range of source data, including imagery, map data, and remotely sensed terrain data.6 On the broadest scale, NGA’s Global Geospatial Information and Services (GGIS) vision includes spatial data fusion as a core functional element.7 NGA’s Mapping, Charting, and Geodesy Utility Software package (MUSE), for example, combines vector and raster data to display base maps with overlays of a variety of data to support geographic analysis and mission planning.
Real-time ATC/ATR (ATR—automatic target recognition) for military applications has turned to multiple-sensor solutions to expand spectral diversity and target feature dimensionality, seeking to achieve high probabilities of correct detection or identification at acceptable false alarm rates. Forward-looking infrared (FLIR), imaging millimeter wave (MMW), and light amplification for detection and ranging (LADAR) sensors are the most promising suite capable of providing the diversity needed for reliable discrimination in battlefield applications. In addition, some applications seek to combine the real-time imagery to present an enhanced image to the human operator for driving, control, and warning, as well as manual target recognition.
Industrial robotic applications for fusion include the use of 3D imaging and tactile sensors to provide sufficient image understanding to permit robotic manipulation of objects. These applications emphasize automatic object position understanding rather than recognition (e.g., the target recognition) that is, by nature, noncooperative.8
Transportation applications combine MMW and electrooptical imaging sensors to provide collision avoidance warning by sensing vehicles whose relative rates and locations pose a collision threat.
Medical applications fuse information from a variety of imaging sensors to provide a complete 3D model or enhanced 2D image of the human body for diagnostic purposes. The United Medical and Dental Schools of Guy’s and St. Thomas’ Hospital (London, U.K.) have demonstrated methods for registering and combining magnetic resonance (MR), positron emission tomography (PET), and computer tomography (CT) into composites to aid surgery.9
5.3 Defining Image and Spatial Data Fusion
In this chapter, image and spatial data fusion are distinguished as subsets of the more general data fusion problem that is typically aimed at associating and combining 3D data about sparse point objects located in space. Targets on a battlefield, aircraft in airspace, ships on the ocean surface, or submarines in the 3D ocean volume are common examples of targets represented as point objects in a 3D space model.
Image data fusion, however, is involved with associating and combining complete, spatially filled sets of data in 2D (images) or 3D (terrain or high-resolution spatial representations of real objects). Herein lies the distinction: image and spatial data fusion requires data representing every point on a surface or in space to be fused, rather than selected points of interest.
The more general problem is described in detail in the introductory texts by Waltz and Llinas10 and Hall,11 while the progress in image and spatial data fusion is reported over a wide range of the technical literature, as cited in this chapter.
The taxonomy in Figure 5.1 distinguishes the data properties and objectives that distinguish four categories of fusion applications.
In all the image and spatial applications cited in the text above, the common thread of the fusion function is its emphasis on the following distinguishing functions:
Registration involves spatial and temporal alignment of physical items within imagery or spatial data sets and is a prerequisite for further operations. It can occur at the raw image level (i.e., any pixel in one image may be referenced with known accuracy to a pixel or pixels in another image, or to a coordinate in a map) or at higher levels, relating objects rather than individual pixels. Of importance to every approach to combining spatial data is the accuracy with which the data layers have been spatially aligned relative to each other or to a common coordinate system (e.g., geolocation or geocoding of earth imagery to an earth projection). Registration can be performed by traditional internal image-to-image correlation techniques (when the images are from sensors with similar phenomena and are highly correlated)12 or by external techniques.13 External methods apply in-image control knowledge or as-sensed information that permits accurate modeling and estimation of the true location of each pixel in 2D or 3D space.

FIGURE 5.1
Data fusion application taxonomy.The combination function operates on multiple, registered layers of data to derive composite products using mathematical operators to perform integration; mosaicking; spatial or spectral refinement; spatial, spectral, or temporal (change) detection; or classification.
Reasoning is the process by which intelligent, often iterative search operations are performed between the layers of data to assess the meaning of the entire scene at the highest level of abstraction and of individual items, events, and data contained in the layers.
The image and spatial data fusion functions can be placed in the JDL data fusion model context to describe the architecture of a system that employs imagery data from multiple sensors and spatial data (e.g., maps and solid models) to perform detection, classification, and assessment of the meaning of information contained in the scenery of interest.
Figure 5.2 compares the JDL general model14 with a specific multisensor ATR image data fusion functional flow to show how the more abstract model can be related to a specific imagery fusion application. The level 1 processing steps can be directly related to image counterparts as follows:

FIGURE 5.2
Image of a data fusion functional flow can be directly compared to the Joint Directors of Laboratories data fusion subpanel model of data fusion.
Alignment. The alignment of data into a common time, space, and spectral reference frame involves spatial transformations to warp image data to a common coordinate system (e.g., projection to an earth reference model or 3D space). At this point, nonimaging data that can be spatially referenced (perhaps not to a point, but often to a region with a specified uncertainty) can then be associated with the image data.
Association. New data can be correlated with the previous data to detect and segment (select) targets on the basis of motion (temporal change) or behavior (spatial change). In time-sequenced data sets, target objects at time t are associated with target objects at time t – 1 to discriminate newly appearing targets, moved targets, and disappearing targets.
Tracking. When objects are tracked in dynamic imagery, the dynamics of target motion are modeled and used to predict the future location of targets (at time t + 1) for comparison with new sensor observations.
Identification. The data for segmented targets are combined from multiple sensors (at any one of several levels) to provide an assignment of the target to one or more of several target classes.
Level 2 and 3 processing deals with the aggregate of targets in the scene and other characteristics of the scene to derive an assessment of the meaning of data in the scene or spatial data set.
In the following sections, the primary image and spatial data fusion application areas are described to demonstrate the basic principles of fusion and the state of the practice in each area (Figure 5.3).

FIGURE 5.3
Three basic levels of fusion are provided to the multisensor automatic target recognition designer as the most logical alternative points in the data chain for combining data.
5.4 Three Classic Levels of Combination for Multisensor Automatic Target Recognition Data Fusion
Since the late 1970s, the ATR literature has adopted three levels of image data fusion as the basic design alternatives offered to the system designer. The terminology was adopted to describe the point in the traditional ATR processing chain at which registration and combination of different sensor data occurred. These functions can occur at multiple levels, as described later in this chapter. First, a brief overview of the basic alternatives and representative research and development results is presented. (Broad overviews of the developments in ATR in general, with specific comments on data fusion, are available in other literature.15, 16 and 17)
5.4.1 Pixel-Level Fusion
At the lowest level, pixel-level fusion uses the registered pixel data from all image sets to perform detection and discrimination functions. This level has the potential to achieve the greatest signal detection performance (if registration errors can be contained) at the highest computational expense. At this level, detection decisions (pertaining to the presence or absence of a target object) are based on the information from all sensors by evaluating the spatial and spectral data from all layers of the registered image data. A subset of this level of fusion is segment-level fusion, in which basic detection decisions are made independently in each sensor domain, but the segmentation of image regions is performed by evaluation of the registered data layers.
Fusion at the pixel level involves accurate registration of the different sensor images before applying a combination operator to each set of registered pixels (which correspond to associated measurements in each sensor domain at the highest spatial resolution of the sensors). Spatial registration accuracies should be subpixel to avoid combination of unrelated data, making this approach the most sensitive to registration errors. Because image data may not be sampled at the same spacing, resampling and warping of images are generally required to achieve the necessary level of registration before combining pixel data.
In the most direct 2D image applications of this approach, coregistered pixel data may be classified on a pixel-by-pixel basis using approaches that have long been applied to multispectral data classification.18 Typical ATR applications, however, pose a more complex problem when dissimilar sensors, such as FLIR and LADAR, image in different planes. In such cases, the sensor data must be projected into a common 2D or 3D space for combination. Gonzalez and Williams, for example, have described a process for using 3D LADAR data to infer FLIR pixel locations in three dimensions to estimate target pose before feature extraction (FE).19 Schwickerath and Beveridge present a thorough analysis of this problem, developing an eight-degree-of-freedom model to estimate both the target pose and relative sensor registration (coregistration) based on a 2D and 3D sensor.20
Delanoy et al. demonstrated pixel-level combination of “spatial interest images” using Boolean and fuzzy logic operators.21 This process applies a spatial feature extractor to develop multiple interest images (representing the relative presence of spatial features in each pixel), before combining the interest images into a single detection image. Similarly, Hamilton and Kipp describe a probe-based technique that uses spatial templates to transform the direct image into probed images that enhance target features for comparison with reference templates.22,23 Using a limited set of television and FLIR imagery, Duane compared pixel-level and feature-level fusion to quantify the relative improvement attributable to the pixel-level approach with well-registered imagery sets.24
5.4.2 Feature-Level Fusion
At the intermediate level, feature-level fusion combines the features of objects that are detected and segmented in the individual sensor domains. This level presumes independent detectability of objects in all the sensor domains. The features for each object are independently extracted in each domain; these features create a common feature space for object classification.
Such feature-level fusion reduces the demand on registration, allowing each sensor channel to segment the target region and extract features without regard to the other sensor’s choice of target boundary. The features are merged into a common decision space only after a spatial association is made to determine that the features were extracted from objects whose centroids were spatially associated.
During the early 1990s, the Army evaluated a wide range of feature-level fusion algorithms for combining FLIR, MMW, and LADAR data for detecting battlefield targets under the multisensor feature-level fusion (MSFLF) program of the OSD multisensor-aided targeting initiative. Early results demonstrated marginal gains over single-sensor performance and reinforced the importance of careful selection of complementary features to specifically reduce single-sensor ambiguities.25
At the feature level of fusion, researchers have developed model-based (or model-driven) alternatives to the traditional statistical methods, which are inherently data driven. Model-based approaches maintain target and sensing models that predict all possible views (and target configurations) for comparison with extracted features rather than using a more limited set of real signature data for comparison.26 The application of model-based approaches to multiple-sensor ATR offers several alternative implementations, two of which are described in Figure 5.4. The adaptive model matching approach performs FE and comparison (match) with predicted features for the estimated target pose. The process iteratively searches to find the best model match for the extracted features.

FIGURE 5.4
Two model-based sensor alternatives demonstrate the use of a prestored hierarchy of model-based templates or an online iterative model that predicts features based on estimated target pose.
5.4.2.1 Discrete Model Matching Approach
A multisensor model-based matching approach described by Hamilton and Kipp27 develops a relational tree structure (hierarchy) of 2D silhouette templates. These templates capture the spatial structure of the most basic all-aspect target “blob” (at the top or root node), down to individual target hypotheses at specific poses and configurations. This predefined search tree is developed on the basis of model data for each sensor, and the ATR process compares segmented data to the tree, computing a composite score at each node to determine the path to the most likely hypotheses. At each node, the evidence is accumulated by applying an operator (e.g., weighted sum, Bayesian combination, etc.) to combine the score for each sensor domain.
5.4.2.2 Adaptive Model Matching Approach
Rather than using prestored templates, this approach implements the sensor or the target modeling capability within the ATR algorithm to dynamically predict features for direct comparison. Figure 5.4 illustrates a two-sensor extension of the one-sensor, model-based ATR paradigm (e.g., automatic radar air-to-ground target acquisition program (ARAGTAP)28 or moving and stationary target acquisition and recognition (MSTAR)29 approaches) in which independent sensor features are predicted and compared iteratively, and evidence from the sensors is accumulated to derive a composite score for each target hypothesis.
TABLE 5.2
Most Common Decision-Level Combination Alternatives

Larson et al. describe a model-based IR/LADAR fusion algorithm that performs extensive pixel-level registration and FE before performing the model-based classification at the extracted feature level.30 Similarly, Corbett et al. describe a model-based feature-level classifier that uses IR and MMW models to predict features for military vehicles.31 Both of these follow the adaptive generation approach.
5.4.3 Decision-Level Fusion
Fusion at the decision level (also called postdecision or postdetection fusion) combines the decisions of independent sensor detection or classification paths by Boolean (AND, OR) operators or by a heuristic score (e.g., M-of-N, maximum vote, or weighted sum). Two methods of making classification decisions exist: hard decisions (single, optimum choice) and soft decisions, in which decision uncertainty in each sensor chain is maintained and combined with a composite measure of uncertainty (Table 5.2).
The relative performance of alternative combination rules and independent sensor thresholds can be optimally selected using distribution data for the features used by each sensor.32 In decision-level fusion, each path must independently detect the presence of a candidate target and perform a classification on the candidate. These detections and classifications (the sensor decisions) are combined into a fused decision. This approach inherently assumes that the signals and signatures in each independent sensor chain are sufficient to perform independent detection before the sensor decisions are combined. This approach is much less sensitive to spatial misregistration than all others and permits accurate association of detected targets to occur with registration errors over an order of magnitude larger than for pixel-level fusion. Lee and Vleet have shown procedures for estimating the registration error between sensors to minimize the mean square registration error and optimize the association of objects in dissimilar images for decision-level fusion.33
Decision-level fusion of MMW and IR sensors has long been considered a prime candidate for achieving the level of detection performance required for autonomous precision-guided munitions.34 Results of an independent two-sensor (MMW and IR) analysis on military targets demonstrated the relative improvement of two-sensor decision-level fusion over either independent sensor.35, 36 and 37 A summary of ATR comparison methods was compiled by Diehl et al.38 These studies demonstrated the critical sensitivity of performance gains to the relative performance of each contributing sensor and the independence of the sensed phenomena.
5.4.4 Multiple-Level Fusion
In addition to the three classic levels of fusion, other alternatives or combinations have been advanced. At a level even higher than the decision level, some researchers have defined scene-level methods in which target detections from a low-resolution sensor are used to cue a search-and-confirm action by a higher-resolution sensor. Menon and Kolodzy described such a system that uses FLIR detections to cue the analysis of high-spatial resolution laser radar data using a nearest-neighbor neural network classifier.39 Maren describes a scene structure method that combines information from hierarchical structures developed independently by each sensor by decomposing the scene into element representations.40 Others have developed hybrid, multilevel techniques that partition the detection problem to a high level (e.g., decision level) and the classification to a lower level. Aboutalib et al. described a hybrid algorithm that performs decision-level combination for detection (with detection threshold feedback) and feature-level classification for air target identification in IR and TV imagery.41
Other researchers have proposed multilevel ATR architectures, which perform fusion at all levels, carrying out an appropriate degree of combination at each level based on the ability of the combined information to contribute to an overall fusion objective. Chu and Aggarwal describe such a system that integrates pixel-level to scene-level algorithms.42 Eggleston has long promoted such a knowledge-based ATR approach that combines data at three levels, using many partially redundant combination stages to reduce the errors of any single unreliable rule.43,44 The three levels in this approach are:
Low level. Pixel-level combinations are performed when image enhancement can aid higher-level combinations. The higher levels adaptively control this fine grain combination.
Intermediate symbolic level. Symbolic representations (tokens) of attributes or features for segmented regions (image events) are combined using a symbolic level of description.
High level. The scene or context level of information is evaluated to determine the meaning of the overall scene, by considering all intermediate-level representations to derive a situation assessment. For example, this level may determine that a scene contains a brigade-sized military unit forming for attack. The derived situation can be used to adapt lower levels of processing to refine the high-level hypotheses.
Bowman and DeYoung described an architecture that uses neural networks at all levels of the conventional ATR processing chain to achieve pixel-level performances of up to .99 probability of correct identification for battlefield targets using pixel-level neural network fusion of UV, visible, and MMW imagery.45
Pixel-, feature-, and decision-level fusion designs have focused on combining imagery for the purposes of detecting and classifying specific targets. The emphasis is on limiting processing by combining only the most likely regions of target data content at the minimum necessary level to achieve the desired detection or classification performance. This differs significantly from the next category of image fusion designs, in which all data must be combined to form a new spatial data product that contains the best composite properties of all contributing sources of information.
5.5 Image Data Fusion for Enhancement of Imagery Data
Both still and moving image data can be combined from multiple sources to enhance desired features, combine multiresolution or differing sensor look geometries, mosaic multiple views, and reduce uncorrelated noise.
5.5.1 Multiresolution Imagery
One area of enhancement has been in the application of “band sharpening” or “multiresolution image fusion” algorithms to combine differing resolution satellite imagery. The result is a composite product that enhances the spatial boundaries in lower-resolution multispectral data using higher-resolution panchromatic or synthetic aperture radar (SAR) data.
Veridian-ERIM International has applied its Sparkle algorithm to the band sharpening problem, demonstrating the enhancement of lower-resolution SPOT multispectral imagery (20 m ground sample distance (GSD)) with higher-resolution airborne SAR (3 m GSD) and panchromatic photography (1 m) to sharpen the multispectral data. Radar backscatter features are overlayed on the composite to reveal important characteristics of the ground features and materials. The composite image preserves the spatial resolution of the panchromatic data, the spectral content of the multispectral layers, and the radar reflectivity of the SAR.
Vrabel has reported the relative performance of a variety of band sharpening algorithms, concluding that Veridian ERIM International’s Sparkle algorithm and a color normalization (CN) technique provided the greatest GSD enhancement and overall utility.46 Additional comparisons and applications of band sharpening techniques have been published in the literature.47, 48, 49 and 50
Imagery can also be mosaicked by combining overlapping images into a common block, using classical photogrammetric techniques (bundle adjustment) that use absolute ground control points and tie points (common points in overlapped regions) to derive mapping polynomials. The data may then be forward resampled from the input images to the output projection or backward resampled by projecting the location of each output pixel onto each source image to extract pixels for resampling.51 The latter approach permits spatial deconvolution functions to be applied in the resampling process. Radiometric feathering of the data in transition regions may also be necessary to provide a gradual transition after overall balancing of the radiometric dynamic range of the mosaicked image is performed.52 Such mosaicking fusion processes have also been applied to 3D data to create composite digital elevation models (DEMs) of terrain.53
5.5.2 Dynamic Imagery
In some applications, the goal is to combine different types of real-time video imagery to provide the clearest possible composite video image for a human operator. The David Sarnoff Research Center has applied wavelet encoding methods to selectively combine IR and visible video data into a composite video image that preserves the most desired characteristics (e.g., edges, lines, and boundaries) from each data set.54 The Center later extended the technique to combine multitemporal and moving images into composite mosaic scenes that preserve the “best” data to create a current scene at the best possible resolution at any point in the scene.55,56
5.5.3 Three-Dimensional Imagery
3D perspectives of the earth’s surface are a special class of image data fusion products that have been developed by draping orthorectified images of the earth’s surface over digital terrain models. The 3D model can be viewed from arbitrary static perspectives, or a dynamic fly-through, which provides a visualization of the area for mission planners, pilots, or land planners.
Off-nadir regions of aerial or spaceborne imagery include a horizontal displacement error that is a function of the elevation of the terrain. A DEM is used to correct for these displacements to accurately overlay each image pixel on the corresponding post (i.e., terrain grid coordinate). Photogrammetric orthorectification functions57 include the following steps to combine the data:
DEM preparation. The DEM is transformed to the desired map projection for the final composite product.
Transform derivation. Platform, sensor, and the DEM are used to derive mapping polynomials that will remove the horizontal displacements caused by terrain relief, placing each input image pixel at the proper location on the DEM grid.
Resampling. The input imagery is resampled into the desired output map grid.
Output file creation. The resampled image data (x, y, and pixel values) and DEM (x, y, and z) are merged into a file with other georeferenced data, if available.
Output product creation. 2D image maps may be created with map grid lines, or 3D visualization perspectives can be created for viewing the terrain data from arbitrary viewing angles.
The basic functions necessary to perform registration and combination are provided in an increasing number of commercial image processing software packages (Table 5.3), permitting users to fuse static image data for a variety of applications.
TABLE 5.3
Basic Image Data Fusion Functions Provided in Several Commercial Image Processing Software Packages

5.6 Spatial Data Fusion Applications
Robotic and transportation applications include a wide range of applications similar to military applications. Robotics applications include relatively short-range, high-resolution imaging of cooperative target objects (e.g., an assembly component to be picked up and accurately placed) with the primary objectives of position determination and inspection. Transportation applications include longer-range sensing of vehicles for highway control and multiple-sensor situation awareness within a vehicle to provide semiautonomous navigation, collision avoidance, and control.
The results of research in these areas are chronicled in a variety of sources, beginning with the 1987 Workshop on Spatial Reasoning and MultiSensor Fusion,58 and many subsequent SPIE conferences.59, 60, 61, 62 and 63
5.6.1 Spatial Data Fusion: Combining Image and Nonimage Data to Create Spatial Information Systems
One of the most sophisticated image fusion applications combines diverse sets of imagery (2D), spatially referenced nonimage data sets, and 3D spatial data sets into a composite spatial data information system. The most active area of research and development in this category of fusion problems is the development of GIS by combining earth imagery, maps, demographic and infrastructure, or facilities mapping (geospatial) data into a common spatially referenced database.
Applications for such capabilities exist in three areas. In civil government, the need for land and resource management has prompted intense interest in establishing GISs at all levels of government. The U.S. Federal Geographic Data Committee is tasked with the development of a National Spatial Data Infrastructure (NSDI), which establishes standards for organizing the vast amount of geospatial data currently available at the national level and coordinating the integration of future data.64
Commercial applications for geospatial data include land management, resources exploration, civil engineering, transportation network management, and automated mapping or facilities management for utilities.
The military application of such spatial databases is the IPB,65 which consists of developing a spatial database containing all terrain, transportation, groundcover, man-made structures, and other features available for use in real-time situation assessment for command and control. The Defense Advanced Research Projects Agency (DARPA) Terrain Feature Generator is one example of a major spatial database and fusion function defined to automate the functions of IPB and geospatial database creation from diverse sensor sources and maps.66
Realization of efficient, affordable systems capable of accommodating the volume of spatial data required for large regions and performing reasoning that produces accurate and insightful information depends on two critical technology areas:
Spatial data structure. Efficient, linked data structures are required to handle the wide variety of vector, raster, and nonspatial data sources. Hundreds of point, lineal, and areal features must be accommodated. Data volumes are measured in terabytes and short access times are demanded for even broad searches.
Spatial reasoning. The ability to reason in the context of dynamically changing spatial data is required to assess the meaning of the data. The reasoning process must perform the following kinds of operations to make assessments about the data:
Spatial measurements (e.g., geometric, topological, proximity, and statistics)
Spatial modeling
Spatial combination and inference operations, in uncertainty
Spatial aggregation of related entities
Multivariate spatial queries
Antony surveyed the alternatives for representing spatial and spatially referenced semantic knowledge67 and published the first comprehensive data fusion text68 that specifically focused on spatial reasoning for combining spatial data.
5.6.2 Mapping, Charting, and Geodesy Applications
The use of remotely sensed image data to create image maps and generate GIS base maps has long been recognized as a means of automating map generation and updating to achieve currency as well as accuracy.69, 70 and 71 The following features characterize integrated geospatial systems:
Currency. Remote sensing inputs enable continuous update with change detection and monitoring of the information in the database.
Integration. Spatial data in a variety of formats (e.g., raster and vector data) is integrated with metadata and other spatially referenced data, such as text, numerical, tabular, and hypertext formats. Multiresolution and multiscale spatial data coexist, are linked, and share a common reference (i.e., map projection).
Access. The database permits spatial query access for multiple user disciplines. All data is traceable, and the data accuracy, uncertainty, and entry time are annotated.
Display. Spatial visualization and query tools provide maximum human insight into the data content using display overlays and 3D capability.
Ambitious examples of such geospatial systems include the DARPA Terrain Feature Generator, the European ESPRIT II MultiSource Image Processing System (MuSIP),72,73 and NASA’s Earth Observing Systems Data and Information System (EOSDIS).74
Figure 5.5 illustrates the most basic functional flow of such a system, partitioning the data integration (i.e., database generation) function from the scene assessment function. The integration function spatially registers and links all data to a common spatial reference and also combines some data sets by mosaicking, creating composite layers, and extracting features to create feature layers. During the integration step, higher-level spatial reasoning is required to resolve conflicting data and to create derivative layers from extracted features. The output of this step is a registered, refined, and traceable spatial database.
The next step is scene assessment, which can be performed for a variety of application functions (e.g., further FE, target detection, quantitative assessment, or creation of vector layers) by a variety of user disciplines. This stage extracts information in the context of the scene, and is generally query driven.
Table 5.4 summarizes the major kinds of registration, combination, and reasoning functions that are performed, illustrating the increasing levels of complexity in each level of spatial processing. Faust described the general principles for building such a geospatial database, the hierarchy of functions, and the concept for a blackboard architecture expert system to implement the functions described earlier.75

FIGURE 5.5
The spatial data fusion process flow includes the generation of a spatial database and the assessment of spatial information in the database by multiple users.
TABLE 5.4
Spatial Data Fusion Functions


FIGURE 5.6
Target search example uses multiple layers of spatial data and applies iterative spatial reasoning to evaluate alternative hypotheses while accumulating evidence for each candidate target.
5.6.2.1 Representative Military Example
The spatial reasoning process can be illustrated by a hypothetical military example that follows the process an image or intelligence analyst might follow in search of critical mobile targets (CMTs). Consider the layers of a spatial database illustrated in Figure 5.6, in which recent unmanned air vehicle (UAV) SAR data (the top data layer) has been registered to all other layers, and the following process is performed (process steps correspond to path numbers on the figure):
A target cueing algorithm searches the SAR imagery for candidate CMT targets, identifying potential targets in areas within the allowable area of a predefined delimitation mask (data layer 2).*
Location of a candidate target is used to determine the distance to transportation networks (which are located in the map, data layer 3) and to hypothesize feasible paths from the network to the hide site.
The terrain model (data layer 8) is inspected along all paths to determine the feasibility that the CMT could traverse the path. Infeasible path hypotheses are pruned.
Remaining feasible paths (on the basis of slope) are then inspected using the multispectral data (data layers 4, 5, 6, and 7). A multispectral classification algorithm is scanned over the feasible paths to assess ground load-bearing strength, vegetation cover, and other factors. Evidence is accumulated for slope and these factors (for each feasible path) to determine a composite path likelihood. Evidence is combined into a likelihood value and unlikely paths are pruned.
Remaining paths are inspected in the recent SAR data (data layer 1) for other significant evidence (e.g., support vehicles along the path, recent clear cut) that can support the hypothesis. Supportive evidence is accumulated to increase likelihood values.
Composite evidence (target likelihood plus likelihood of feasible paths to candidate target hide location) is then used to make a final target detection decision.
In the example presented in Figure 5.6, the reasoning process followed a spatial search to accumulate (or discount) evidence about a candidate target. In addition to target detection, similar processes can be used to:
Insert data in the database (e.g., resolve conflicts between input sources)
Refine accuracy using data from multiple sources, etc.
Monitor subtle changes between existing data and new measurements
Evaluate hypotheses about future actions (e.g., trafficability of paths, likelihood of flooding given rainfall conditions, and economy of construction alternatives)
5.6.2.2 Representative Crime Mapping Examples
The widespread availability of desktop GIS systems has allowed local crime analysis units to develop new ways of mapping geocoded crime data and visualizing spatial-temporal patterns of criminal activity to better understand patterns of activity and underlying causal factors.76 This crime mapping process requires only that law enforcement systems geocode the following categories of source information in databases for subsequent analysis:
Calls for service. Date/time group, call number, call category, associated incident report identifier, address, and latitude and longitude of location a police unit was sent
Reported crimes. Date/time group for crime event, case number, crime category, address, and latitude and longitude of the crime location
Arrests. Date/time group of arrest, case number, arrested person information, charge category, address, and latitude and longitude of the arrest location
Routes. Known routes of travel (to-from crime scene, to-from drug deliveries, route between car-stolen and car-recovered, etc.) derived from arrest, investigation, and interrogation records
The spatial data fusion process is relatively simple, registering the geocoded event data to GIS layers for visualization and statistical analysis. Analysts can visualize and study the spatial distributions of this data (crimes, as well as addresses of victims, suspects, travel routes to-from crime scenes, and other related evidence) to
Discover patterns of spatial association, including spatial clusters or hot spots—areas that have a greater than average number of criminal or disorder events, or areas where people have a higher than average risk of victimization.77 The attributes of the hot spots (e.g., spatial properties for each block such as number of buildings, number of families, per capita income, distance to police station, etc.) may be used to predict other vulnerable areas for similar criminal activities.
Discover spatial-temporal patterns that can be correlated to behavior tempos or profiles (e.g., a drug addict’s tempo of burglaries, purchases, and rest).
Identify trends and detect changes in behavioral patterns to investigate root cause factors (e.g., changes in demographics, movement of people, economics, etc.).
Identify unusual event locations or spatial outliers.
Crime mapping is particularly useful in the analysis of a crime series—criminal offenses that are thought to share the same causal factor (usually a single offender or group of offenders) given their descriptive, behavior, spatial, or temporal commonality.78 Crime series are generally related to the category of “crimes of design” that are conducted within certain constraints and therefore may have an observable pattern, rather than “crimes of opportunity” that occur when the criminal, victim and circumstances converge at a particular time and place.
The crime data can be presented in a variety of thematic map formats (Table 5.5) for visual analysis, and the analyst can compute statistical properties of selected events, such as the spatial distribution of events, including measures like the mean center, center of minimum distance, or ellipses of standard deviation. Statistics can be computed for the properties of distances between events including nearest-neighbor measures or Ripley’s K statistic distance measure. Clustering methods are applied to spatial and temporal data to locate highly correlated cluster of similar events (hot spots) and to identify locations with spatial attributes that make them vulnerable to similar crime patterns.79 (This predictive analysis may be used to increase surveillance or set up decoys where criminals are expected to sustain a pattern.)
TABLE 5.5
Typical Thematic Crime Map Formats
Map Type |
Description |
Law Enforcement Use |
Dot or pin map |
Individual event locations are plotted as dots; symbol coding identifies the event (crime) type at each location |
Identify general crime activity patterns, trends, vulnerable locations For a specific crime series, identify candidate spatial patterns |
Statistical map |
Proportional symbols (e.g., pin sizes, pie charts, or histograms) are used to display quantitative data at locations or in areas |
Identify crime densities and relative rates of events by area to manage police coverage |
Choropleth map |
Display discrete distributions of data within defined boundaries (police beats, precincts, districts, or census blocks) |
Define hot spot areas that share the same level of risk |
Isoline map |
Display contour lines that bound areas of common attributes (e.g., crime rate) and show gradients between bounded areas |
Inform law enforcement personnel about high incident areas to increase field contacts and surveillance in an area |
5.7 Spatial Data Fusion in GEOINT
The term geospatial intelligence (GEOINT) refers to the exploitation and analysis of imagery and geospatial information to describe, assess, and visually depict physical features and geographically referenced activities on the Earth. GEOINT consists of three elements: imagery, imagery-derived intelligence, and geospatial information.80 The previously mentioned processes of spatial data fusion are at the core of GEOINT processing and analysis functions, enabling the registration, correlation, and spatial reasoning over many sources of intelligence data.
The three elements of GEOINT bring together different types of data that when integrated give a complete spatially coherent product capable of being used in a more detailed analysis. The first element, imagery, refers to any product that depicts features, objects, or activity, natural or man-made with the positional data from the same time. Imagery data can be collected by a large variety of platforms including satellite, airborne, and unmanned platforms; it is a crucial element that provides the initial capability for analysis. The second component of GEOINT is imagery intelligence, a derived result of the interpretation and analysis of imagery, adding context to imagery products. The third element is geospatial information that identifies locations and characteristics of features of the earth. This data includes two categories:
Static information that is collected through remote sensing, mapping, and surveying; it is often derived from existing maps, charts, or related products.
Dynamic information that is provided by objects being tracked by radar, a variety of tagging mechanisms, or self-reporting techniques such as blue force tracking systems that report the location of personnel and vehicles.
The capability to visualize registered geospatial in three dimensions increases situational awareness and adds to the context of GEOINT analysis. This capability allows reconstruction of scenes and dynamic activities using advanced modeling and simulation techniques. These techniques allow the creation of 3D fly-through products that can then be enhanced with the addition of information gathered from other intelligence disciplines; the fourth dimension of time and movement, provided by dynamic information, can be added to create dynamic and interactive products. These GEOINT products apply several of the fusion methods described in earlier sections to provide analysts with an accurate simulation of a site or an activity for analysis, mission training, or targeting.
To provide accurate, timely, and applicable intelligence, NGA has adopted a systematic process to apply spatial data fusion to analyze intelligence problems and produce standard GEOINT products. The four-step geospatial preparation of the environment (GPE) process (Figure 5.7) was adapted from the military’s IPB process to meet a broader spectrum of analysis including civilian and nontraditional threat issues.81 The process is described as a cycle, though in practice the steps need not be performed sequentially in a linear process; the cycle simply provides the GEOINT analyst a template to follow when attempting to solve an intelligence problem.
The first step defines the environment, based on the mission requirements provided by the intelligence customer. The analyst gathers all pertinent information about the mission location, and determines applicable boundaries, features, and characteristics. This first grouping of information provides the foundation layer(s) for the GEOINT product, including essential features that change rarely or slowly.
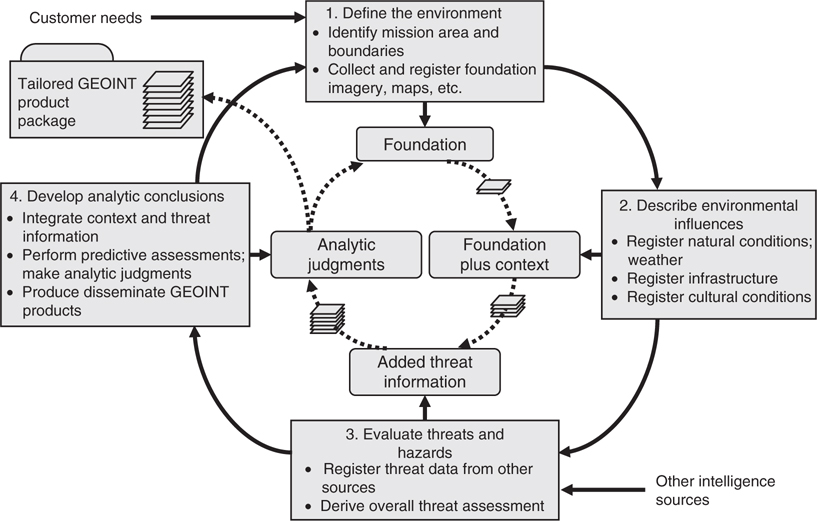
FIGURE 5.7
Geospatial preparation of the environment process flow and products.
The second step is to describe the environmentally related influence. In this step it is important to provide descriptive information about the location being analyzed, including all existing natural conditions such as cultural influences, infrastructure, and political environment. The analyst must also consider other factors that could potentially effect operations in the area, including weather; vegetation; roads; facilities; population; language; and social, ethnic, religious, and political factors. This information is then registered to the data layer(s) prepared in the first step.
The third step evaluates threats and hazards to the mission. This requires gathering available threat data from multiple intelligence disciplines related to the location, including details of the adversary, their forces, doctrine capabilities, and intent. Any information that provides background or insight on the threats for the location is closely investigated, registered, and added to the layers of information from the last two steps. In many cases the estimated geolocation of nonspatial data requires analysts to describe the uncertainty in spatial information and inferences; this requires collaboration with other entities within the intelligence community.
The last step of the GPE is to develop an analytic conclusion. After all the layers of information gathered have been integrated, registered, and considered, the analyst must make analytic judgments regarding operational considerations, such as physical terrain obstacles to vehicle movement, human terrain sensitivities to psychological operations (PSYOP) activities, line-of-sight restrictions to sensor placements, etc. The emphasis in this stage of analysis is on deriving proactive and predictive assessments; these assessments may include predicted effects of next courses of action, estimated impact statements, and assessments.
Most GEOINT products can be categorized as either standard or specialized; however, since GEOINT products are generally tailored to meet specific issues they cannot always be easily categorized.
TABLE 5.6
Representative AGI Methods

Standard products include products such as maps and imagery and can be used as a stand-alone product or layered with additional data. Most standard products are derived from electrooptical or existing geospatial data but can be augmented with data derived from other sources. Standard products are generally 2D but 3D products are available; they make up the bulk of the GEOINT requirements and may include in-depth analysis, depending on the consumer’s requirements.
Specialized products take standard products to the next level by providing additional capability to tailor them for more specific situations. These products typically use data from a wider variety of geospatial sources and even data from other intelligence disciplines. Specialized products incorporate data from many more technically advanced sensors and typically incorporate more complex registration and exploitation techniques. One of the complex exploitation techniques commonly used in specialized products is Advanced Geospatial Intelligence (AGI), which includes all types of information technically derived from the processing, exploitation, and nonliteral analysis (to include integration or fusion) of spectral, spatial, temporal, phase history, and polarimetric data (Table 5.6). These types of data can be collected on stationary and moving targets by electrooptical, infrared, radar, and related sensors (both active and passive). AGI also includes both ancillary data needed for data processing or exploitation and signature information (to include development, validation, simulation, data archival, and dissemination).82
5.8 Summary
The fusion of image and spatial data is an important process that promises to achieve new levels of performance and integration with GISs for a wide variety of military, intelligence, and commercial application areas. By combining registered data from multiple sensors or views, and performing intelligent reasoning on the integrated data sets, fusion systems are beginning to significantly improve the performance of current-generation ATR, single-sensor imaging, and geospatial data systems.
There remain significant challenges to translate the state-of-the-art manual and limited semiautomated capabilities to large-scale production. A recent study by the National Research Council of image and spatial data fusion in GEOINT concluded, “Yet analysis methods have not evolved to integrate multiple sources of data rapidly to create actionable intelligence. Nor do today’s means of information dissemination, indexing, and preservation suit this new agenda or future needs.”87 Among the challenges for research identified in the study were developing ontologies for tagging GEOINT objects, image data fusion across space, time, spectrum and scale, and spatiotemporal database management systems to support fusion across all spatial sources. The report summarized that “Data acquired from multiple sensors carry varying granularity, geometric type, time stamps, and registered footprints. Data fusion rectifies coordinate positions to establish which features have not changed over time to focus on what has changed. The fusion, however, involves confronting several hard problems including spatial and temporal conflation, dealing with differential accuracy and resolutions, creating the ontologies and architectures necessary for interoperability, and managing uncertainty with metadata.”88
References
1. Composite photo of Kuwait City in Aerospace and Defense Science, Spring 1991.
2. Aviation Week and Space Technology, May 2, 1994, 62.
3. Composite Multispectral and 3-D Terrain View of Haiti in Aviation Week and Space Technology, 49, October 17, 1994.
4. R. Ropelewski, Team helps analysts cope with data flood, Signal, 47(12), 40–45, 1993.
5. Intelligence and imagery exploitation, Solicitation BAA 94-09-KXPX, Commerce Business Daily, April 12, 1994.
6. Terrain feature generation testbed for war breaker intelligence and planning, Solicitation BAA 94-03, Commerce Business Daily, July 28, 1994; Terrain visualization and feature extraction, Solicitation BAA 94-01, Commerce Business Daily, July 25, 1994.
7. Global Geospace Information and Services (GGIS), Defense Mapping Agency, Version 1.0, 36–42, August 1994.
8. M.A. Abidi and R.C. Gonzales, Eds., Data Fusion in Robotics and Machine Intelligence, Academic Press, Boston, 1992.
9. Hill, D.L.G. et al., Accurate frameless registration of MR and CT images of the head: Applications in surgery and radiotherapy planning, Radiology, 191(2), 447–454, 1994.
10. E.L. Waltz and J. Llinas, Multisensor Data Fusion, Artech House, Norwood, MA, 1990.
11. D.L. Hall, Mathematical Techniques in Multisensor Data Fusion, Artech House, Norwood, MA, 1992.
12. W.K. Pratt, Correlation techniques of image registration, IEEE Trans. AES, 10(13), 353–358, 1974.
13. L. Gottsfield Brown, A survey of image registration techniques, Computing Surveys, Vol. 29, 325–376, 1992; see also B.R. Bruce, Registration for Tactical Imagery: An Updated Taxonomy, Defence Science and Technology Organisation, Australia, DSTO-TR-1855, April 2006; and J. Ronald, D.M. Booth, P.G. Perry, and N.J. Redding, A Review of Registration Capabilities in the Analyst’s Detection Support System, Defence Science and Technology Organisation, Australia, DSTO-TR-1632, March 2005.
14. F.E. White, Jr., Data Fusion Subpanel Report, Proc. Fifth Joint Service Data Fusion Symp., Vol. I, 335–361, October 1991.
15. B. Bhanu, Automatic target recognition: State-of-the-art survey, IEEE Trans. AES, 22(4), 364–379, 1986.
16. B. Bhanu and T.L. Jones, Image understanding research for automatic target recognition, IEEE AES Systems Magazine, 15–23, October 1993.
17. W.G. Pemberton, M.S. Dotterweich, and L.B. Hawkins, An overview of ATR fusion techniques, Proc. Tri-Service Data Fusion Symp., 115–123, June 1987.
18. L. Lazofson and T.J. Kuzma, Scene classification and segmentation using multispectral sensor fusion implemented with neural networks, Proc. 6th Nat’l. Sensor Symp., Vol. I, 135–142, August 1993.
19. V.M. Gonzales and P.K. Williams, Summary of progress in FLIR/LADAR fusion for target identification at Rockwell, Proc. Image Understanding Workshop, ARPA, Vol. I, 495–499, November 1994.
20. A.N.A. Schwickerath and J.R. Beveridge, Object to multisensor coregistration with eight degrees of freedom, Proc. Image Understanding Workshop, ARPA, Vol. I, 481–490, November 1994.
21. R. Delanoy, J. Verly, and D. Dudgeon, Pixel-level fusion using “interest” images, Proc. 4th National Sensor Symp., Vol. I, 29, August 1991.
22. M.K. Hamilton and T.A. Kipp, Model-based multi-sensor fusion, Proc. IEEE Asilomar Circuits and Systems Conference, Vol. 1, 283–289, November 1993.
23. T.A. Kipp and M.K. Hamilton, Model-based automatic target recognition, 4th Joint Automatic Target Recognition Systems and Technology Conf., November 1994.
24. G. Duane, Pixel-level sensor fusion for improved object recognition, Proc. SPIE Sensor Fusion, Vol. 931, 180–185, 1988.
25. D. Reago et al., Multi-sensor feature level fusion, 4th Nat’l. Sensor Symp., Vol. I, 230, August 1991.
26. E. Keydel, Model-based ATR, Tutorial Briefing, Environmental Research Institute of Michigan, February 1995.
27. M.K. Hamilton and T.A. Kipp, ARTM: Model-based mutisensor fusion, Proc. Joint NATO AC/243 Symp. on Multisensors and Sensor Data Fusion, Vol. 1, November 1993.
28. D.A. Analt, S.D. Raney, and B. Severson, An angle and distance constrained matcher with parallel implementations for model based vision, Proc. SPIE Conf. on Robotics and Automation, Boston, MA, October 1991.
29. Model-Driven Automatic Target Recognition Report, ARPA/SAIC System Architecture Study Group, October 14, 1994.
30. J. Larson, L. Hung, and P. Williams, FLIR/laser radar fused model-based target recognition, 4th Nat’l. Sensor Symp., Vol. I, 139–154, August 1991.
31. F. Corbett et al., Fused ATR algorithm development for ground to ground engagement, Proc. 6th Nat’l. Sensor Symp., Vol. I, 143–155, August 1993.
32. J.D. Silk, J. Nicholl, and D. Sparrow, Modeling the performance of fused sensor ATRs, Proc. 4th Nat’l. Sensor Symp., Vol. I, 323–335, August 1991.
33. R.H. Lee and W.B. Van Vleet, Registration error between dissimilar sensors, Proc. SPIE Sensor Fusion, Vol. 931, 109–114, 1988.
34. J.A. Hoschette and C.R. Seashore, IR and MMW sensor fusion for precision guided munitions, Proc. SPIE Sensor Fusion, Vol. 931, 124–130, 1988.
35. D. Lai and R. McCoy, A radar-IR target recognizer, Proc. 4th Nat’l. Sensor Symp., Vol. I, 137, August 1991.
36. M.C. Roggemann et al., An approach to multiple sensor target detection, Sensor Fusion II, Proc. SPIE, Vol. 1100, 42–50, March 1989.
37. K. Siejko et al., Dual mode sensor fusion performance optimization, Proc. 6th Nat’l. Sensor Symp., Vol. I, 71–89, August 1993.
38. V. Diehl, F. Shields, and A. Hauter, Testing of multi-sensor automatic target recognition and fusion systems, Proc. 6th Nat’l. Sensor Fusion Symp., Vol. I, 45–69, August 1993.
39. M. Menon and P. Kolodzy, Active/passive IR scene enhancement by Markov random field sensor fusion, Proc. 4th Nat’l. Sensor Symp., Vol. I, 155, August 1991.
40. A.J. Maren, A hierarchical data structure representation for fusing multisensor information, Sensor Fusion II, Proc. SPIE, Vol. 1100, 162–178, March 1989.
41. A. Omar Aboutalib, L. Tran, and C.-Y. Hu, Fusion of passive imaging sensors for target acquisition and identification, Proc. 5th Nat’l. Sensor Symp., Vol. I, 151, June 1992.
42. C.-C. Chu and J.K. Aggarwal, Image interpretation using multiple sensing modalities, IEEE Trans. Pattern Analysis Machine Intell., 14(8), 840–847, 1992.
43. P.A. Eggleston and C.A. Kohl, Symbolic fusion of MMW and IR imagery, Proc. SPIE Sensor Fusion, Vol. 931, 20–27, 1988.
44. P.A. Eggleston, Algorithm Development Support Tools for Machine Vision, Amerinex Artificial Intelligence, Inc. (n.d., received February 1995).
45. C. Bowman and M. DeYoung, Multispectral neural network camouflaged vehicle detection using flight test images, Proc. World Conf. on Neural Networks, June 1994.
46. J. Vrabel, MSI band sharpening design trade study, Presented at 7th Joint Service Data Fusion Symp., October 1994.
47. P.S. Chavez, Jr. et al., Comparison of three different methods to merge multiresolution and multispectral data: LANDSAT™ and SPOT Panchromatic, Photogramm. Eng. Remote Sensing, 57(3), 295–303, 1991.
48. K. Edwards and P.A. Davis, The use of intensity-hue-saturation transformation for producing color-shaded relief images, Photogramm. Eng. Remote Sensing, 60(11), 1369–1374, 1994.
49. R. Tenney and A. Willsky, Multiresolution image fusion, DTIC Report AD-B162322L, January 31, 1992.
50. B.N. Haack and E. Terrance Slonecker, Merging spaceborne radar and thematic mapper digital data for locating villages in Sudan, Photogramm. Eng. Remote Sensing, 60(10), 1253–1257, 1994.
51. C.C. Chesa, R.L. Stephenson, and W.A. Tyler, Precision mapping of spaceborne remotely sensed imagery, Geodetical Info Magazine, 8(3), 64–67, 1994.
52. R.M. Reinhold, Arc Digital Raster Imagery (ADRI) Program, Air Force Spatial data Technology Workshop, Environmental Research Institute of Michigan, July 1991.
53. I.S. Kweon and T. Kanade, High resolution terrain map from multiple sensor data, IEEE Trans. Pattern Analysis Machine Intell., 14(2), 278–292, 1992.
54. P.J. Burt, Pattern selective fusion of IR and visible images using pyramid transforms, Proc. 5th Nat’l. Sensor Symp., Vol. I, 313–325, June 1992.
55. M. Hansen et al., Real-time scene stabilization and mosaic construction, Proc. of the 2nd IGEE Workshop on Application of Computer Vision, ARPA, Vol. I, 54–62, December 1994.
56. P.J. Burt and P. Anandan, Image stabilization by registration to a reference mosaic, Proc. Image Understanding Workshop, ARPA, Vol. I, 425–434, November 1994.
57. C.C. Chiesa and W.A. Tyler, Data fusion of off-Nadir SPOT panchromatic images with other digital data sources, Proc. 1990 ACSM-ASPRS Annual Convention, Denver, 86–98, March 1990.
58. A. Kak and S.-S. Chen (Eds.), Proc. Spatial Reasoning and Multi-Sensor Fusion Workshop, AAAI, October 1987.
59. P.S. Shenker (Ed.), Sensor fusion: Spatial reasoning and scene interpretation, SPIE, Vol. 1003, November 1988.
60. P.S. Shenker, Sensor fusion III: 3-D perception and recognition, SPIE, Vol. 1383, November 1990.
61. P.S. Shenker, Sensor fusion IV: Control paradigms and data structures, SPIE, Vol. 1611, November 1991.
62. P.S. Shenker, Sensor fusion V, SPIE, Vol. 1828, November 1992.
63. P.S. Shenker, Sensor fusion VI, SPIE, Vol. 2059, November 1993.
64. Condensed Standards for Digital Geographic Metadata, Federal Geographic Data Committee, Washington, DC, June 8, 1994.
65. Intelligence Preparation of the Battlefield, FM-34-130, HQ Dept. of the Army, May 1989.
66. Development and Integration of the Terrain Feature Generator (TFG), Solicitation DACA76-94-R-0009, Commerce Business Daily Issue PSA-1087, May 3, 1994.
67. R.T. Antony, Eight canonical forms of fusion: A proposed model of the data fusion process, Proc. of 1991 Joint Service Data Fusion Symp., Vol. III, October 1991.
68. R.T. Antony, Principles of Data Fusion Automation, Artech House, Norwood, MA, 1995.
69. R.L. Shelton and J.E. Estes, Integration of remote sensing and geographic information systems, Proc. 13th Int’l. Symp. Remote Sensing of the Environment, Environmental Research Institute of Michigan, April 1979, 463–483.
70. J.E. Estes and J.L. Star, Remote sensing and GIS integration: Towards a prioritized research agenda, Proc. 25th Int’l Symp. on Remote Sensing and Change, Graz Austria, Vol. I, 448–464, April 1993.
71. J.L. Star (Ed.), The Integration of Remote Sensing and Geographic Information Systems, American Society for Photogrammetry and Remote Sensing, Annapolis, MD, 1991.
72. G. Sawyer et al., MuSIP multi-sensor image processing system, Image Vis. Comput., 10(9), 589–609, 1992.
73. D.C. Mason et al., Spatial database manager for a multi-source image understanding system, Image Vis. Comput., 11(1), 25–34, 1993.
74. N.D. Gershon and C. Grant Miller, Dealing with the data deluge, IEEE Spectr., 30(7), 28–32, 1993.
75. N.L. Faust, Design concept for database building, Proc. of SPIE, March 1988.
76. K.W. Harries, Mapping Crime: Principle and Practice, U.S. Department of Justice, Office of Justice Programs Report NCJ 178919, National Institute of Justice, December 1999; see also Advanced crime mapping topics, Proc. of Invitational Advanced Crime Mapping Symp., Crime Mapping & Analysis Program (CMAP) of the National Law Enforcement & Corrections Technology Center (NLECTC), Denver, CO, 2001; M. Velasco and R. Boba, Manual of Crime Analysis Map Production, 97-CK-WXK-004, Office of Community Oriented Policing Services, November 2000.
77. J.E. Eck, S. Chainey, J.G. Cameron, M. Leitner, and R.E. Wilson, Mapping Crime: Understanding Hot Spots, U.S. Department of Justice, Office of Justice Programs, National Institute of Justice, NCJ, 209–393, August 2005.
78. Advanced crime mapping topics, Proc. of Invitational Advanced Crime Mapping Symp., Crime Mapping & Analysis Program (CMAP) of the National Law Enforcement & Corrections Technology Center (NLECTC), Denver, CO, June 2001.
79. D. Helms, The Use of Dynamic Spatio-Temporal Analytical Techniques to Resolve Emergent Crime Series, Las Vegas Metropolitan Police Department, 1999.
80. Geospatial Intelligence (GEOINT) Basic Doctrine, National System for Geospatial Intelligence, Publication 1-0, National Geospatial-Intelligence Agency, September 2005. The term GEOINT is defined in Title 10 U.S. Code §467.
81. Ibid., pp. 12–13.
82. Ibid., p. 45.
83. J.A. Benediktsson and I. Kanellopoulos, Classification of multisource and hyperspectral data based on decision fusion, IEEE Trans. Geosci. Remote Sensing, 37(3), 1367–1377, 1999.
84. Tools and Techniques for Advanced Exploitation of Geospatial Intelligence, White Paper, Intergraph Corp., 2006.
85. CCDMap™ Automated Coherent Change Detection Mosaic System, Product Brochure, Vexcel Corp., Boulder CO, 2003.
86. M. Preiss and N.J.S. Stacy, Coherent Change Detection: Theoretical Description and Experimental Results, Defence Science and Technology Organisation, DSTO-TR-1851, August 2006.
87. Priorities for GEOINT Research at the National Geospatial-Intelligence Agency, Mapping Science Committee, National Research Council, 2006, p. 2.
88. Ibid., p. 76.
* Adapted from The Principles and Practice of Image and Spatial Data Fusion, in Proceedings of the 8th National Data Fusion Conference, Dallas, Texas, March 15–17, pp. 257–278, 1995.
* This mask is a derived layer produced by a spatial reasoning process in the scene generation stage to delimit the entire search region to only those allowable regions in which a target may reside.