4
Does money buy happiness in Singapore?
In our previous books, we have used household income as an independent variable in various data analyses, along with other demographics such as age, education, gender and marital status. We usually report the effect of household income on wellbeing outcomes such as happiness and life satisfaction. Invariably, the question will arise as to whether having more income or money makes anyone happier or more satisfied with her or his life. Like many people around the world, Singaporeans are curious about this question. It invites introspection and speculation about whether having more money does make a difference.
For this book, we decided to devote an entire chapter to the income–happiness debate. Although this debate has recently gained traction among the public at large, it is one that has been going on for years in academic circles. Before we go into the discussion, we highlight a selection of research studies that have investigated the intricate relationships among different types of income (e.g., actual incomes, relative incomes, etc.) and their influence on quality of life and wellbeing (e.g., happiness and life satisfaction). Many articles, books and commentaries have been written about the topic, although there are fewer publications specifically on Singapore and South East Asia. The amount of literature is overwhelming. To make the content more manageable, we have selected the research studies that may shed some light on the income–happiness equation for the Singaporean context. For those who are interested to explore further, several compilations of research studies focus on this issue. For instance, contributing authors to the Handbook on the Economics of Happiness (Bruni and Porta 2007) have provided analyses of the income–happiness paradox and theories for explaining the paradox (e.g., rising aspirations, positional externalities, the intrinsic and extrinsic nature of goals, etc.). Other books include Recent Developments in the Economics of Happiness (Frey and Stutzer 2013), Happiness and Economic Growth: Lessons from Developing Countries (Clark and Senik 2014) and Consumer Economic Wellbeing (Xiao 2015).
While we would like to provide comprehensive answers to every income– happiness question, we are working with the constraints of accessible data from both secondary sources and our primary QOL Survey datasets. To recap, for the 2016 QOL Survey, respondents were asked about their personal and household incomes. They were given the option not to disclose their incomes; thus the number of valid responses was smaller than the total sample size. We had 941 respondents for the question on monthly household income and a good spread across the income brackets. However, for monthly personal income, the number of respondents was 679, and there were very few respondents for the income brackets from S$9001 to more than S$20,000. Thus, we decided to run the data analyses using monthly household incomes. In this chapter, we discuss the relationship between household income and wellbeing outcomes such as happiness, enjoyment, achievement, control, purpose, satisfaction with life in general, satisfaction with overall quality of life and satisfaction with overall quality of life in Singapore. We also have measures about perceptions of economic wellbeing and how satisfied respondents were about their lives and life domains (e.g., income and standard of living). We will examine whether these related factors (such as financial satisfaction and satisfaction with standard of living) play a part in enhancing wellbeing.
Income and wellbeing outcomes
Wellbeing outcomes encompass both affective aspects (such as happiness and positive or negative affect) and cognitive aspects (such as life satisfaction). The need-fulfillment theory suggests that absolute income (or actual income) is important because money provides the resources to acquire the goods and services that contribute to one’s happiness (Diener and Biswas-Diener 2002). Meeting needs leads to increased subjective wellbeing. A similar approach is the material desires concept where people will be happy to the extent that they can obtain things they desire or work/progress toward fulfilling these desires. Thus, on average, studies have shown that richer nations tended to be happier than poorer ones (e.g., Diener and Oishi 2000; Deaton 2013; Powdthavee et al. 2017).
Sengupta et al. (2012) found that household income had positive logarithmic associations with subjective QOL and happiness. Income seemed to be linked more strongly to people’s evaluations of their life than to their happiness. The relationship between income and happiness also varied for different levels of income. The income–wellbeing association was strongest for people earning below the median income and tended to plateau for those in the upper quartile. In similar vein, Drakopoulos and Grimani (2013) showed that there was a strong positive relationship between income and happiness for low-income households and a nonsignificant relationship between income and happiness for high-income households. Their study was done using data from the European Foundation European Quality of Life Survey 2007, which contained data from 30 European countries and Turkey.
Income was negatively correlated to self-reported daily stress (Sengupta et al. 2012), a finding that was also discovered in Kushlev et al. (2015). Wealth may have a greater impact on sadness (negative affect), but it does not necessarily lead to more happiness (positive affect). They found that higher income was associated with experiencing less daily sadness, but had no effect on daily happiness. They concluded that “money may be a more effective tool for reducing sadness than enhancing happiness” (p. 488). Hudson et al. (2016) concurred that income reliably predicted daily sadness but not happiness. Income can help to reduce the sadness associated with everyday life but does not help to increase happiness.
The Easterlin Paradox
If income is positively impacting quality of life and wellbeing outcomes, this seems to suggest that nations and individuals should strive to be more materially prosperous. However, other theorists have counterargued that higher absolute incomes (or actual incomes) do not necessarily lead to higher levels of happiness, a phenomenon that has been termed the Easterlin Paradox. Easterlin (1974) first described this phenomenon when he noted that, over time, a higher rate of economic growth did not result in a greater increase in happiness. At a point in time, happiness and income were positively related, but over time within a country, happiness did not increase as income went up. He defended this position with data from more countries including developing countries, transitioning countries in Eastern Europe and a larger sample of developed countries (Easterlin et al. 2010). Despite phenomenal economic growth, wellbeing increased minimally even in the wealthier nations over the last few decades.
Ma and Zhang (2014) explained the Easterlin Paradox in terms of ecological correlation due to spatial aggregation or data grouping, change of reference classes and confounding variables. They proposed that happiness and income were correlated at the individual level but the correlation was not that strong. For nations, the correlation was stronger, contradicting the Easterlin Paradox. In examining countries that have experienced continuous income growth over an extended period of time, Clark et al. (2014) found an inverse relationship over time between GDP per capita and happiness inequality, where greater income per capita was associated with smaller standard deviations in happiness.
Various theories have been devised to explain the Easterlin Paradox. The key ones are related to concepts such as adaptation, social comparison and aspirations.
Adaptation
Increases in income contribute to happiness but only up to the level where basic needs are met (Diener and Selligman 2009). Thereafter, increases in income may not lead to increases in happiness. Thus, in wealthy countries, if basic needs are met, income ceases to be a good predictor of happiness (Diener and Oishi 2000). It seems that relative incomes (or perceived financial wellbeing) is a better predictor (Easterlin 1974; Oshio and Urakawa 2014). Beyond basic needs, people start comparing their incomes and make social comparisons about the satisfaction of higher-order needs (Drakopoulos 2013).
Another study has suggested a time lag for the levelling effect of income on happiness. Using three datasets on Germany, Di Telia and MacCulloch (2010) first provided evidence for full adaptation to economic growth after basic needs have been met. They showed that wealthier individuals (e.g., home owners) and countries adapted fully to higher levels of income (the logarithm of income) and GDP per capita (the logarithm of GDP per capita), respectively. However, these adaptations may take up to five years for countries and seven years for individuals. This suggests that the gains from happiness from higher income levels can be relatively long-lasting, though they are not for perpetuity.
Social comparison and aspirations
As mentioned earlier, once basic needs are met, additional income does little to raise one’s sense of satisfaction with life. People adapt fairly quickly to a rise in income. Absolute income matters up to a certain point, but after that, relative income matters more. Relative income features prominently in social comparison (Festinger 1954). In terms of aspirations, it is suggested that the gap between income aspirations and actual income is a more important consideration for happiness (Michalos 1985). Materialistic values are also exerting an upward pressure on income aspirations, as desires race ahead of spending power.
Studies have found that relative incomes and income aspirations were significantly correlated to wellbeing (Huang et al. 2016; Knight and Gunatilaka 2011). Hagerty (2000) showed that the range and skew of the income distribution in a community affect a person’s happiness as predicted by the range-frequency theory. This effect was also seen at the national level, where decreasing the skew of the income distribution in a country increased average national SWB. Perceptions about relative income (which is closely related to actual income) were highly correlated with happiness. People tended to compare with those who work in the same occupation and those who live in the same region. After controlling for own income and reference group income, higher perceptions about relative income predicted higher levels of happiness. Similarly, perceived social class was highly positively correlated with happiness (Guven and Sorensen 2012).
Yamashita et al. (2016) showed that relative income was a better predictor of happiness for East Asian countries such as China, Japan, South Korea and Taiwan. Huang et al. (2016) found that in urban China, absolute income had a positive association with happiness, while the reverse was true for relative income and happiness. Their research suggested policy implications for pro-poor growth, equal distribution for economic resources and asset-building policies as supplements to other social assistance programs.
Relative incomes can be “objectively measured” by using formulae such as the ratio of one’s absolute income compared to the median income of the community one belongs to (e.g., country, province, neighbourhood, occupational group, etc.). Relative incomes have also been “subjectively measured” through perceptual scales with anchors such as “far above average” to “far below average.” These scales are related to one’s sense of financial wellbeing. People assess the adequacy of their incomes in relation to variable standards (i.e., relativistic judgement models, as mentioned in Diener and Oishi 2000). Ng (2015) found that material concerns had an indirect effect on the subjective wellbeing of Singaporeans. Specifically, financial satisfaction was one of the strongest predictors of life satisfaction and happiness. Ekici and Koydemir (2016) demonstrated that for UK households, subjective measures of current and future financial wellbeing were found to be significant correlates of life satisfaction, income satisfaction and mental health.
Using data from the Canadian National Population Health Survey (1994 to 2009), Latif (2016) examined the relationship between comparison income and individual happiness. Comparison income was defined in two ways: (1) the average income of the reference group and (2) the difference between one’s own household income and the average income of the reference group. He found that an increase in the average income of the reference group reduced individual happiness. An individual was happier when his or her own household income grew compared to the average income of the reference group, even for different reference groups. In short, comparison income had a significant negative impact on an individual’s happiness level.
Luo et al. (2016) showed that income aspirations were most important in explaining the variations in wellbeing, closely followed by absolute income. Relative income had the smallest effect. This emphasized the importance of aspirations and the prevailing climate of consumerism and materialism for determining wellbeing in China.
The undesirable effects of social comparison and income aspirations have been noted in studies as well. The behaviors associated with higher income such as longer work hours and the trade-offs of such hours for leisure, relationships and health have been shown to take a toll on the wellbeing of individuals and their families and communities. Despite economic growth, Chinese citizens were not happier (Li 2016). In addition to social comparison and (hedonic) adaptation, other factors were proposed. These include an expanding social capital deficit, environment pollution, growing social inequality and work–life imbalance due to the long working hours needed to obtain the desired income. Despite these pessimistic musings, Schnittker (2008) in his analysis of the General Social Survey data from 1973 to 2004 found that, generally, gains in real income were accompanied by enhanced financial satisfaction. Despite income inequality, perceptions of relative income had also increased. There was also no evidence for overworked families or individuals.
Income inequality
Another explanation suggests that income inequality or the distribution of income or wealth plays a critical role in how income is related to happiness. This effect can be seen even in relatively wealthy and developed countries. In recent years, this effect seems to be more pronounced in countries (e.g., China and Eastern European countries) that are transitioning from communism (a more socialist economic model) to capitalism (a market-based economic model). Studies have shown that economic growth and the attendant income increases in these countries were negatively associated with wellbeing because the gains from the transition were not equitably distributed (Oshio et al. 2011; Easterlin et al. 2012; Han 2015). Easterlin et al. (2012) noted that individual wellbeing in China was higher in 1990 when the people were less affluent overall but that income was relatively more equally distributed. Therefore, materialistic values could lower wellbeing, and policies to reduce the gap between expected incomes and actual incomes could effectively promote individuals’ perceived wellbeing in China (Luo et al. 2016).
In an analysis of economic data from 34 countries, Oishi and Kesebir (2015) showed that economic growth did not lead to increases in happiness when it was accompanied by growing income equality. In terms of policy implications, they suggested that a more even distribution of national wealth may be a precondition for raising nationwide happiness.
Using the Chinese General Social Survey data, Wang et al. (2015) found that individual happiness increased with inequality when county-level inequality measured by the Gini coefficient was less than 0.405 and decreased with inequality for larger values of the Gini coefficient where approximately 60 percent of the countries in the study had a Gini coefficient of greater than 0.405. This implied that there was a range where individuals were prepared to accept some level of income inequality, beyond which happiness levels would be jeopardized.
The effects of income inequality on happiness are also mediated by other factors such as trust. Using the General Social Survey data in the United States from 1972 to 2008, Oishi et al. (2011) showed that in years of high income inequality, not only were Americans less happy, they trusted other people less and perceived other people to be less fair. This was especially so for respondents from lower-income households. The negative association between income inequality and happiness for lower-income respondents was explained not by lower household income but by perceived unfairness and lack of trust.
Methodological issues
As seen from past research, the relationship between income and happiness can be fairly complicated. Some complications are due to methodological issues, for example, the type and nature of income that is being assessed and the many measures of happiness that are used in various studies. As expounded by Clark (2011), the debate on income and happiness has been hampered by the lack of harmonized datasets across countries.
In a review of the income–happiness debate, Graham (2009) found the following: First, it matters which aspect of wellbeing is being measured. Studies have found that income affected evaluations of life satisfaction (cognitive aspect of wellbeing) but had minimal influence on positive affect (affective aspects of wellbeing). Second, it matters what questions are being asked and how they are phrased/framed. For instance, are the questions about affective aspects (e.g., smiling) or cognitive aspects (e.g., life satisfaction)? Are they general reference questions or framed reference (e.g., Cantril Ladder of Life) questions? And third, what is the specification of the income variable (e.g., absolute income, log income)? Graham (2009) concluded that “Income and wealth do a good job of explaining the distribution of responses on the ladder of life question… but they do not explain answers on smiling, life purpose and freedom to choose questions” (p. 35). She also found that education seemed to mediate the income–happiness relationship, where the least educated in poor countries and the more educated in both rich and poor countries had strong income–wellbeing links.
Using Gallup’s extensive database, Diener et al. (2010) showed that GDP had a positive effect on life satisfaction but no effect on improvements in mood. This suggested an important distinction between material prosperity versus psychosocial prosperity. National income (GDP per capita) was the most important factor for general life satisfaction, but it was rather unimportant for the experience of positive or negative emotions. The experience of these emotions was reflected in the level of psychosocial prosperity (i.e., the extent to which people’s social psychological needs were fulfilled). Increases in national income were accompanied by more favorable evaluations of life in general but not by substantial improvements in mood. Mood improvements seemed to occur only when psychosocial prosperity was enhanced through good social relationships, freedom of action and opportunities for personal development (Diener et al. 2010).
Happiness, enjoyment, achievement, control and purpose
Respondents in the 2016 QOL initially responded to the question on happiness, “All things considered, would you say that you are happy these days?” on a 5-point scale of “1 = very unhappy” to “5 = very happy.” However, for consistency in analyses, we recoded the responses to a 4-point scale for parity with the questions on enjoyment, achievement, control and purpose. The recoding was done as follows: 1 and 2 were recoded as “1 = unhappy,” 3 was recoded as “2 = neither happy nor unhappy,” 4 was recoded as “3 = quite happy,” and 5 was recoded as “4 = very happy.” The question on enjoyment (“How often do you feel you are really enjoying life these days?”) has a 4-point scale of “1 = never” to “4 = often,” and the question on achievement (“How much do you feel you are accomplishing what you want out of life?”) also has a 4-point scale of “1 = none” to “4 = a great deal.” Respondents replied to the question on control (“How much control do you feel you have over important aspects of your life?”) and the question on sense of purpose (“All things considered, how much do you feel you have a sense of purpose in your life?”) on a 4-point scale of “1 = none” to “4 = a great deal.”
Income and happiness
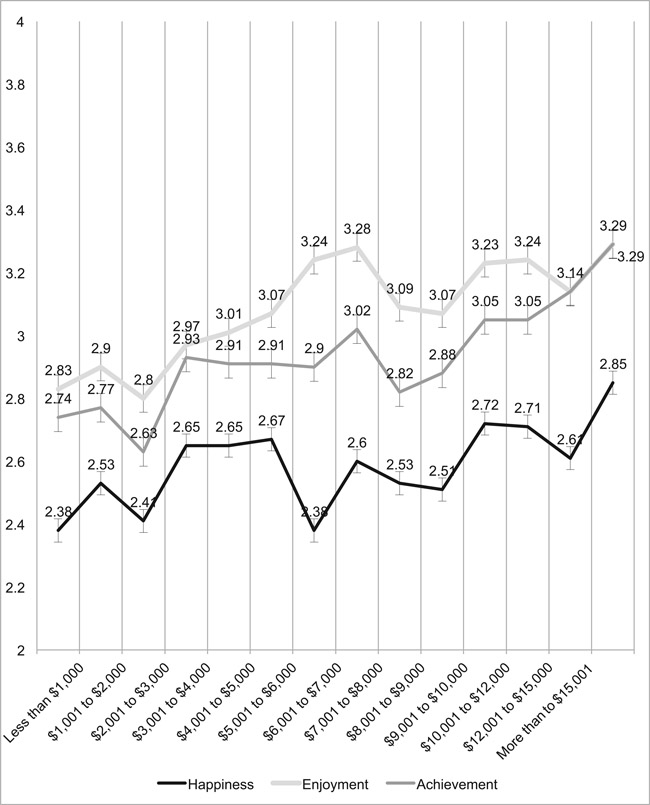
Figure 4.1
Happiness, enjoyment and achievement across household income levels (2016)
As shown in Figure 4.1 (dark gray line), Singaporeans’ happiness level generally increases with income, except for two groups: those whose monthly household income falls into the range of (S$2001 to S$3000) and those in the range of (S$6001 to S$7000). The most notable point of inflection in this graph of happiness level is at the income range of (S$6001 to S$7000), which reported the steepest decrease and lowest level of happiness at 2.38 (out of a 4-point scale). This lowest point was also shared by those who were earning less than S$1000. The highest level of happiness (2.85) belonged to those from the highest income group (>S$20,000).
Income and enjoyment
As shown in Figure 4.1 (light gray line), Singaporeans’ level of enjoyment generally increases as household income increases after a slight dip from 2.9 to 2.8 (out of a four-point scale) for those whose monthly household income falls into the range of S$2001 to S$3000. The first turning point in this upward trend occurred after the enjoyment level peaked at 3.28 (out of a 4-point sale) for those in the income range of S$7001 to S$8000, before gradually declining to 3.07 for the income range of S$9001 to S$10,000. Thereafter, the enjoyment level started to rise again before gradually declining to 3.14 for the income range of S$15,001 to S$20,000 and then finally increasing to a new high of 3.39 for the highest income group of more than S$20,000.
Income and achievement
As shown in Figure 4.1 (medium gray line), Singaporeans’ level of accomplishment generally increases as household income increases after a slight dip from 2.77 to 2.63 (out of a 4-point scale) for those whose monthly household income falls into the range of S$2001 to S$3000. The first turning point in this upward trend occurred after the accomplishment level increased to 2.93 for those with household incomes in the range of S$3001 to S$4000, with the next point of inflection occurring at the income range of S$7001 to S$8000, with a higher level of accomplishment of 3.02. It then plunged to a level of 2.82 for the income range of S$8001 to S$9000. Thereafter, the level of accomplishment maintained its upward trend, reaching a new high level of 3.29 for Singaporeans in the highest household income group of more than S$20,000.
Income and control
As shown in Figure 4.2 (dark gray line), Singaporeans’ level of control over important aspects of their life first showed an increase from the initial 2.69 (out of a 4-point scale) for those in the lowest income group (less than S$1000) to 2.86 for those in the income range of S$1001 to S$2000, followed by a slight decrease to 2.83 at the next income range of S$2001 to S$3000. Thereafter, the level of control goes on an upward trend until it reaches a high of 3.16 for the income range of S$7001 to S$8000. The first and only notable inflection point for the level of control trend occurred where there was a decline to 2. 93 for those who have household incomes in the range of S$9001 to S$10,000. Thereafter, the level of control began its upward trend, culminating with the highest level of control (3.29) for those with the highest income range of more than S$20,000.
Income and sense of purpose
As shown in Figure 4.2 (light gray line), Singaporeans’ sense of purpose in life generally showed a scallop-shaped pattern where the sense of purpose increases and alternates with decreases for the first few income ranges, until it reaches 3.19 (out of a 4-point scale) for those in the income range of S$5001 to S$6000. Thereafter, the sense of purpose began its gradual downward trend to a low of 2.98 for those in the income range of S$9001 to S$10,000, before increasing sharply to a high of 3.35 for those in the next income group of S$10,001 to S$15,000. This increase was not sustained as the level of sense of purpose then started to decrease for the next two income groups, before reaching the highest level of 3.39 for those in the highest income range of more than S$20,000.

Figure 4.2
Control and sense of purpose across household income levels (2016)
Satisfaction with life, satisfaction with overall quality of life and satisfaction with overall quality of life in Singapore
Respondents in the survey were asked to rate their satisfaction with life on a 6-point scale (‘”1 = strongly disagree” to “6 = strongly agree”). The five statements about satisfaction with life include “In most ways, my life is close to my ideal,” “The conditions of my life are excellent,” “I am satisfied with my life,” “So far I have gotten the important things I want in life,” and “If I could live my life over, I would change almost nothing.” Each respondent’s responses to these items were summed, and the average scores for these items were used in deriving the graph (dark gray line in Figure 4.3). Higher means thus indicated a greater degree of satisfaction.
For overall quality of life, respondents in the survey were asked to rate their satisfaction using a scale as follows: 1 for “very dissatisfied,” 2 for “dissatisfied,” 3 for “somewhat dissatisfied,” 4 for “somewhat satisfied,” 5 for “satisfied” and 6 for “very satisfied.” A higher score thus indicated a greater degree of satisfaction.
Respondents in the survey were also asked to rate their satisfaction with overall quality of life in Singapore using a scale as follows: 1 for “very dissatisfied,” 2 for “dissatisfied,” 3 for “somewhat dissatisfied,” 4 for “somewhat satisfied,” 5 for “satisfied” and 6 for “very satisfied.” Higher scores thus indicated a greater degree of satisfaction.
Income and satisfaction with life
As shown in Figure 4.3 (dark gray line), Singaporeans’ satisfaction with life improved as income increased, from 4.03 (out of a 6-point scale) for those with less than S$1000 to 4.31 for those in the income group of S$5001 to S$6000. The first and most notable inflection point in the satisfaction with life trend occurred when the satisfaction level dropped sharply to 4.05 for those in the next income group S$6001 to S$7000, before rising to 4.3 for those in the next higher income group of S$7001 to S$8000. Then the satisfaction level again declined slightly to 4.11 for those in the next higher income group of S$8001 to S$9000, before starting on a gradual increase for the next few income groups, reaching the highest level of 4.45 for the highest-income group of more than S$20,000.
Income and satisfaction with overall quality of life
As shown in Figure 4.3 (light gray line), Singaporeans’ satisfaction with overall quality of life improved as income increased, from 4.45 (out of a 6-point scale) for those with less than S$1000 to 4.77 for those in the income group of S$3001 to S$4000. The satisfaction level then started its slight downward slide for the next few income groups, reaching a level of 4.64 for the two income groups of S$5001 to S$6000 and S$6001 to S$7000, before increasing to 4.74 for those in the next higher income group of S$7001 to S$8000. Then the satisfaction level again declined to 4.62 for those in the next higher income group of S$8001 to S$9000, before starting on an upward path for the next few income groups, finally reaching the highest level of 4.98 for the highest-income group of more than S$20,000.

Figure 4.3 Satisfaction with life, satisfaction with overall quality of life, and satisfaction with overall quality of life in Singapore across household income levels (2016)
Income and satisfaction with overall quality of life in Singapore
As shown in Figure 4.3 (medium gray line), Singaporeans’ satisfaction with overall quality of life in Singapore initially declined as income increased, from 4.62 (out of a 6-point scale) for the lowest-income group of less than S$1000 to 4.45 for those in the higher-income group of S$2001 to S$3000. The satisfaction level then increased sharply to 4.83 for those in the next higher income group of S$3001 to S$4000, before turning to a downward trend, decreasing to a new low of 4.43 for those in the S$6001–S$7000 income group. Satisfaction level then increased to 4.72 for the next higher income group of S$7001 to S$8000, before decreasing again to 4.45 for those in the next higher income group of S$8001 to S$9000. The next inflection point came when the satisfaction level dropped to its lowest of 4.42 for those in the income group of S$15,001 to S$20,000, before reaching the highest level of 4.83 for the highest-income group of more than S$20,000.
Table 4.1 Correlations between wellbeing indicators and household incomes (2016)
| Wellbeing indicators | Monthly household income1 |
|
|
|
| Happiness | 0.1032 |
| Enjoyment | 0.1952 |
| Achievement | 0.2082 |
| Control | 0.2142 |
| Sense of purpose | 0.2192 |
| Satisfaction with life | 0.1222 |
| Satisfaction with life domains | 0.1522 |
| Satisfaction with living in Singapore | 0.012 |
In addition to Figures 4.1 to 4.3, we examined correlations between household income and the wellbeing indicators. The correlations were all positive and ranged from 0.012 to 0.219, indicating that household income had an influence on the subjective wellbeing of Singaporeans. (See Table 4.1.)
Economic wellbeing
Economic wellbeing has been a subject of continuous debate and inquiry as researchers and policy makers try to answer the question, “Does money buy happiness?” Economic wellbeing is an overall assessment of how one feels about the adequacy of the resources available to her or him. A related concept would be financial wellbeing, which is defined as how much money one has to spend on oneself and which has been shown to contribute to one’s overall wellbeing (Kruger 2010). Other related concepts would be financial satisfaction (i.e., how satisfied one is with the financial situation of one’s household) and satisfaction with one’s standard of living. Both of these material concerns were investigated by Ng and her colleagues using data from the World Values Survey (Ng 2015) and a Singapore-based survey conducted in 2017 (Ng et al. 2017). They found that financial satisfaction was one of the strongest predictors of life satisfaction and happiness. Similarly, our correlation analyses confirmed that satisfaction with household income (i.e., financial satisfaction) and satisfaction with standard of living were positively associated with the wellbeing indicators (See Table 4.2).
For the 2016 QOL Survey, we used three evaluative questions based on interval scales from the Gallup-Healthways Well-Being Index to measure economic wellbeing. One of the questions was modified to form the fourth question relating to the ability to service loan commitments. The responses to all four questions are indicated in Table 4.3. The numbers in parentheses indicate the percentages for the 2011 QOL Survey.
As shown in Table 4.3, eight out of ten (83.9 percent) Singaporeans in the 2016 QOL Survey agreed that they had enough money to buy the things they need, which was an improvement from 2011 (66.9 percent). Close to three-quarters (72.5 percent) of Singaporeans said they were able to meet loan repayments as planned. About six out of ten (61.4 percent) agreed that they had enough money to do what they wanted, compared to 32.5 percent in 2011. Slightly more than half (55.4 percent) mentioned that they did not have money to make a major purchase, which was also an improvement from 2011 (63.6 percent).
Table 4.2 Correlations between satisfaction with household income and standard of living with wellbeing indicators (2016)1
| Wellbeing indicators | Satisfaction with household income | Satisfaction with standard of living |
|
|
||
| Happiness | 0.4602 | 0.4202 |
| Enjoyment | 0.3492 | 0.3972 |
| Achievement | 0.4352 | 0.3952 |
| Control | 0.3752 | 0.3352 |
| Sense of purpose | 0.3442 | 0.3332 |
| Satisfaction with life | 0.6432 | 0.5872 |
| Satisfaction with overall quality of life | 0.5962 | 0.5992 |
| Satisfaction with overall quality of life | 0.4032 | 0.4742 |
| in Singapore | ||
To see whether there are any individual differences, we further analyzed economic wellbeing by selected demographics and the results are presented in Tables 4.4 and 4.5. Almost equal percentages of male and female Singaporeans agreed that they had enough money to buy what they need, but a slightly higher percentage of single Singaporeans felt this way. Singaporeans in the youngest age group (15 to 24 years) had the highest percentage (88.6 percent) who felt they had enough money to buy the things they need, followed closely
Table 4.3 Singaporeans’ economic wellbeing scores (2016 QOL Survey)
| Do you/your household have enough money to buy the things you need? | If you/your household have/has a loan, are you/your household, able to meet these monthly/regular commitments as planned? | ||
|
|
|||
| (1) | (2) | (1) | (2) |
| Yes, have enough (%) | No, do not have enough (%) | Yes, have enough (%) | No, do not have enough (%) |
| 83.9 (66.9) | 16.1 (33.1) | 72.5 (N.A.) | 27.5 (N.A.) |
| Do you/your household have more than enough money to do what you want to do? | Would, you/your household be able to make a major purchase, suds as a car, appliance or furniture, or pay for a significant home repair if you needed to? | ||
| (1) | (2) | (1) | (2) |
| Agree (%) | Disagree (%) | Yes, would be able to (%) | No, would not be able to (%) |
| 61.4 (32.5) | 38.6 (67.5) | 44.6 (36.4) | 55.4 (63.6) |
N.A. = Not available.
Table 4.4 Demographic distribution of “Do you/your household have enough money to buy the things you need?”
| Demographics | Have enough money to buy things you need (%) | Don’t have enough money to buy things you need (%) |
|
|
||
| Total sample | 83.9 | 16.1 |
| Age groups (years) | ||
| • 15-24 | 88.6 | 11.4 |
| • 25-34 | 80.9 | 19.1 |
| • 35-44 | 83.5 | 16.5 |
| • 45-54 | 80.3 | 19.7 |
| • 55-64 | 87.7 | 12.3 |
| • 65 and above | 83.5 | 16.5 |
| Education | ||
| • Low | 75.2 | 24.8 |
| • Medium | 81.7 | 18.3 |
| • High | 92.7 | 7.3 |
| Gender | ||
| • Male | 85.9 | 14.1 |
| • Female | 81.9 | 18.1 |
| Household income | ||
| • Low | 67.1 | 32.9 |
| • Medium-low | 85.1 | 14.9 |
| • Medium-high | 95.2 | 4.8 |
| • High | 93.3 | 6.7 |
| Marital status | ||
| • Single | 86.7 | 13.3 |
| • Married | 83.9 | 16.1 |
(87.7 percent) by those in the retiring age group (55 to 64 years). Not surprisingly, more among the less educated and lower-income Singaporeans felt that they did not have enough money to buy the things they needed. More among the single Singaporeans felt that they had enough money to buy what they need.
Table 4.5 shows that Singaporeans were generally able to meet their monthly loan commitments (if they had any) except for those in the oldest age group (65 years and above), where only about half (54.3 percent) said that they were able to meet such commitments. More education and household income also helped Singaporeans in their ability to meet their loan commitments. Females seemed to lag behind males in their ability to service loan commitments, while married Singaporeans had less ability to do so than singles.
Table 4.5 Demographic distribution of “If you/your household have/has a loan, are you/your household able to meet these monthly/regular commitments as planned?”
| Demographics | Have enough money (%) | Don't have enough money (%) |
|
|
||
| Total sample | 72.5 | 27.5 |
| Age groups (years) | ||
| • 15-24 | 75.7 | 24.3 |
| • 25-34 | 72.8 | 27.2 |
| • 35-14 | 77.2 | 22.8 |
| • 45-54 | 75.7 | 24.3 |
| • 55-4 | 74.1 | 25.9 |
| • 65 and above | 54.3 | 45.7 |
| Education | ||
| • Low | 40.4 | 59.6 |
| • Medium | 70.2 | 29.8 |
| • High | 92.7 | 7.3 |
| Gender | ||
| • Male | 75.3 | 24.7 |
| • Female | 69.8 | 30.2 |
| Household income | ||
| • Low | 42.9 | 57.1 |
| • Medium -low | 79.3 | 20.7 |
| • Medium-high | 95.5 | 4.5 |
| • High | 97.1 | 2.9 |
| Marital status | ||
| • Single | 75.4 | 24.6 |
| • Married | 73.0 | 27.0 |
Table 4.6 shows that Singaporeans’ financial ability to do the things they want to do improved as they get older, especially for those in the 55- to 64-year age group. More education and household income also helped Singaporeans in their financial ability to do what they want. Females seemed to have less discretionary purchasing power in this area than males.
Table 4.6 Demographic distribution of "Do you/your household have more than enough money to do what you want to do?"
| Demographics | Have enough money for wants (%) | Don’t have enough money for wants (%) |
|
|
||
| Total sample | 61.4 | 38.6 |
| Age groups (years) | ||
| • 15-24 | 57.8 | 42.2 |
| • 25-34 | 56.1 | 43.9 |
| • 35-44 | 61.5 | 38.5 |
| • 45-54 | 60.1 | 39.9 |
| • 55-64 | 68.3 | 31.7 |
| • 65 and above | 64.6 | 35.4 |
| Education | ||
| • Low | 50.3 | 49.7 |
| • Medium | 58.2 | 41.8 |
| • High | 73.6 | 26.4 |
| Household income | ||
| • Low | 41.7 | 58.3 |
| • Medium-low | 60.3 | 39.7 |
| • Medium-high | 77.4 | 22.6 |
| • High | 80.6 | 19.4 |
| Gender | ||
| • Male | 63.5 | 36.5 |
| • Female | 59.3 | 40.7 |
| Marital status | ||
| • Single | 59.7 | 40.3 |
| • Married | 63.0 | 37.0 |
Table 4.7 shows that middle-aged Singaporeans (35 to 44 years old) were the majority who could afford to make a major purchase any time they want, while retirees (those aged 65 years and above) formed the majority who could not afford to make such impromptu purchases. As Singaporeans’ education and income levels increase, the percentages who felt they were able to make a major purchase also increased. However, there were no gender differences where ability to make a major purchase was concerned, with about five out of ten (54.5 and 56.2 percent) of both genders admitting that they did not have enough money to do so. The same pattern of responses applied to marital status.
Table 4.7 Demographic distribution of "Would you/your household be able right now to make a major purchase such as a car, appliance, or furniture or pay for a significant home repair if you needed to?"
| Demographics | Yes, able to make purchase (%) | major No, not able to make major purchase (%) |
|
|
||
| Total sample | 44.6 | 55.4 |
| Age groups (years) | ||
| • 15-24 | 44.6 | 55.4 |
| • 25-34 | 41.6 | 58.4 |
| • 35-44 | 51.9 | 48.1 |
| • 45-54 | 48.6 | 51.4 |
| • 55-64 | 44.8 | 55.2 |
| • 65 and above | 32.0 | 68.0 |
| Education | ||
| • Low | 23.0 | 77.0 |
| • Medium | 38.3 | 61.7 |
| • High | 68.3 | 31.7 |
| Gender | ||
| • Male | 45.5 | 54.5 |
| • Female | 43.8 | 56.2 |
| Household income | ||
| • Low | 17.7 | 82.3 |
| • Medium-low | 43.5 | 56.5 |
| • Medium-high | 70.6 | 29.4 |
| • High | 85.1 | 14.9 |
| Marital status | ||
| • Single | 44.1 | 55.9 |
| • Married | 46.6 | 53.4 |
Conclusion
Money does seem to buy happiness as our data showed a general trend that happiness increased as household incomes increased (see Figure 4.1). However, there were exceptions where Singaporeans in the higher-income group (S$6001 to S$7000) may not be happier than those in the lower-income group (S$2001 to S$3000). In terms of the level of enjoyment, although Singaporeans who did not enjoy life as much mostly belonged to the lower-income groups, those in the middle-low income group (S$7001 to S$8000) can have the same high enjoyment level as those in the highest household income group (>S$20,000). Although household income had a positive relationship with Singaporeans’ ability to accomplish what they want in life, there were again exceptions where people with higher income (S$8001 to S$9000) reported lower levels of accomplishment than those with lesser income (S$7001 to S$8000).
Income does matter in Singaporeans’ level of control over important aspects of their lives, as it generally improved as income increased, but there were again exceptions (see Figure 4.2). Singaporeans who had higher household incomes (such as those in the S$8001 to S$9000 and S$9001 to S$10,000 ranges) may not feel that they had more control than their fellow citizens in the lower-income groups. As far as Singaporeans’ sense of purpose was concerned, income had the same impact as it had on control: It improved as income increased but with exceptions. Singaporeans with high household incomes in the ranges of S$8001 to S$9000, S$9001 to S$10,000, and S$15,001 to S$20,000 may not have a higher sense of purpose than their fellow citizens in the lower-income groups.
Income also had a positive relationship with Singaporeans’ satisfaction with life, although one can have higher income but be not really satisfied with life (see Figure 4.3). This is particularly so for those in the middle-low income group (S$6001 to S$7000) who could have similar low satisfaction levels as those in the lowest-income group (<S$1000). Meanwhile, once Singaporeans’ household incomes passed the S$15,000 mark, their satisfaction with life may not increase substantially as their income increased. Apart from the lowest- and highest-income groups, satisfaction with the overall quality of life may not increase with higher household incomes. Singaporeans in the lower-income group of S$3001 to S$4000 can have a higher satisfaction level than their fellow citizens with higher incomes (from S$4001 to S$9000).
Similarly, although income had a generally positive relationship with Singaporeans’ satisfaction with overall quality of life in Singapore, one can have higher income but be not really satisfied with living in Singapore. Even Singaporeans with less than S$1000 can have higher satisfaction than those with higher incomes, especially when compared with those in the middle-income (S$6001 to S$7000) and high-income (S$15,001 to S$20,000) groups.
In terms of buying items of basic needs, meeting obligatory payments, and doing things they want to do, Singaporeans were economically well-off. A large majority (more than 60 percent) of Singaporeans were able to meet these needs in 2016, and the percentages were generally more than those reported in 2011. When it comes to making a major purchase like a car or a home appliance or paying for significant home repairs, many Singaporeans (55.5 percent) were still unable to do so. However, this was an improvement compared to 2011 (63.6 percent).
Who were the Singaporeans who were doing well or not doing so well economically? For buying items for basic needs, the youngest age group (15 to 24 years) and the retiring age group (55 to 64 years) were most able to do so, while the young working adults age group (25 to 34 years) and the middle-aged group (45 to 54 years) were less able to do so. Those with low levels of education and correspondingly low household incomes were least able to meet such needs. Male and female Singaporeans, whether single or married, were equally comfortable with paying for such needs. Singaporeans who were above 65 years of age, those with low levels of education, and those with low household incomes were least able to meet monthly commitments as planned. Gender and marital status did not distinguish Singaporeans on this commitment ability.
Young Singaporeans (15 to 34 years), those with low levels of education, and those with low household incomes were less able to have money to do what they want. Again, gender and marital status did not distinguish Singaporeans on their ability to afford the things they wanted. When making a major purchase like a car or a household appliance or paying for major home repairs, retirees (65 years and above) were least able to do so (68 percent compared to the national average of 55.4 percent), followed by those with low levels of education (77 percent) and those with low household incomes (82.3 percent).
Overall, Singaporeans were generally doing well in terms of economic wellbeing. However, depending on the nature of the financial needs, some segments of Singaporeans may not be economically well-off. Many of them were likely to be older and had lower levels of education and correspondingly low household incomes.
Do the Easterlin Paradox and related theories apply to Singapore? Singapore is a well-to-do society with a robust GDP and a high standard of living. In the Singaporean context, it is possible that some of the theories mentioned earlier are working in tandem to influence the relationship between income and happiness. Absolute or actual incomes matter in Singapore, as it is becoming more expensive to maintain a good standard of living given the rising costs of living. Relative incomes play a part because of the strong peer pressure to keep up with one’s reference groups (e.g., relatives, close friends, colleagues and neighbors). Aspirations also fuel the competitive striving for more income and the status that comes with having access to more resources. Income inequality could also adversely affect the wellbeing of and trust among citizens if the economic gains were not perceived to be equitably distributed.
References
Bruni, L., and Porta, P.L. (2007), Handbook on the economics of happiness, Cheltenham, UK: Edward Elgar.
Clark, A.E. (2011), ‘Income and happiness: Getting the debate straight’, Applied Research in Quality of Life, 6, 253–263.
Clark, A.E., Fleche, S., and Senik, C. (2014), ‘The great happiness moderation: Well-being inequality during episodes of income growth’, in Happiness and economic growth: Lessons from developing countries, edited by A. Clark and C. Senik, New York, NY, USA: Oxford University Press, 32–86.
Clark, A.E., and Senik, C. (2014), Happiness and economic growth: Lessons from developing countries, Oxford, UK: Oxford University Press.
Deaton, A. (2013), ‘Income, health, and well-being around the world: Evidence from the Gallup World Poll’, in Recent developments in the economics of happiness, edited by B. Frey and A. Stutzer, Northampton, MA, USA: Edward Elgar, 342–361.
Diener, E., and Biswas-Diener, R. (2002), ‘Will money increase subjective wellbeing? A literature review and guide to needed research’, Social Indicators Research, 57, 119–169.
Diener, E., Ng, W., Harter, J., and Arora, R. (2010), ‘Wealth and happiness across the world: Material prosperity predicts life evaluation, whereas psychosocial prosperity predicts positive feeling’, Journal of Personality and Social Psychology, 99(1), 52–61.
Diener, E., and Oishi, S. (2000), ‘Money and happiness: Income and subjective well-being across nations’, in Culture and subjective well-being, edited by E. Diener and E. Suh, Cambridge, MA, USA: MIT Press, 185–218.
Diener, E. and Selligman, M.P. (2009), ‘Beyond money: Toward an economy of wellbeing’, in The science of wellbeing, edited by E. Diener, Vol. 37, Dordrecht, Netherlands: Springer, 201–265.
Di Telia, R., and MacCulloch, R. (2010), ‘Happiness adaptation to income beyond “basic needs”’, in International differences in well-being, edited by E. Diener, J.F. Helliwell and D. Kahneman, New York, NY, USA: Oxford University Press, 217–246.
Drakopoulos, S.A. (2013), ‘Hierarchical needs, income comparisons, and happiness levels’, in A positive psychology perspective on quality of life, edited by A. Efklides and D. Moraitou, New York, NY, USA: Springer Science + Business Media, 17–32.
Drakopoulos, S.A., and Grimani, K. (2013), ‘Maslow’s needs hierarchy and the effect of income on happiness levels’, in The happiness compass: Theories, actions and perspectives for well-being, edited by F. Sarracino, Hauppauge, NY, USA: Nova Science, 295–309.
Easterlin, R.A. (1974), Does economic growth improve the human lot? Some empirical evidence in nations and households in economic growth, New York, NY, USA: Academic Press.
Easterlin, R.A., McVey, L.A., Switek, M., Sawangfa, O., and Zweig, J.S. (2010), ‘The happiness-income paradox revisited’, Proceedings of the National Academy of Sciences, 107(52), 22243–22468.
Easterlin, R.A., Morgan, R., Switek, M., and Wang, F. (2012), ‘China’s life satisfaction, 1990–2010’, Proceedings of the National Academy of Sciences of the United States of America, 109(25), 9775–9780.
Ekici, T., and Koydemir, S. (2016), ‘Income expectations and happiness: Evidence from British panel data’, Applied Research in Quality of Life, 11(2), 539–552.
Festinger, L. (1954), ‘A theory of social comparison processes’, Human Relations, 7, 117–140.
Frey, B.S., and Stutzer, A. (2013), Recent developments in the economics of happiness, Cheltenham, UK: Edward Elgar.
Graham, C. (2009), ‘The happiness and income debate: Substance, methodology, and the Easterlin Paradox’, in Happiness around the world: The paradox of happy peasants and miserable millionaires, Oxford, UK: Oxford University Press, 24–45.
Guven, C., and Sorensen, B.E. (2012), ‘Subjective wellbeing: Keeping up with the perception of the Joneses’, Social Indicators Research, 109, 439–469.
Hagerty, M.R. (2000), ‘Social comparisons of income in one’s community: Evidence from national surveys of income and happiness’, Journal of Personality and Social Psychology, 78, 764–771.
Han, C. (2015), ‘Explaining the subjective wellbeing of urban and rural Chinese: Income, personal concerns and societal evaluations’, Social Science Research, 49, 179–190.
Huang, J., Wu, S., and Deng, S. (2016), ‘Relative income, relative assets, and happiness in urban China’, Social Indicators Research, 126, 971–985.
Hudson, N.W., Lucas, R.E., Donnellan, M.B., and Kushlev, K. (2016), ‘Income reliably predicts daily sadness, but not happiness: A replication and extension of Kushlev, Dunn, and Lucas (2015)’, Social Psychological and Personality Science, 7, 828–836.
Knight, J., and Gunatilaka, R. (2011), ‘Great expectations? The subjective wellbeing of rural-urban migrants in China’, Oxford Development Studies, 39(1), 1–24.
Kruger, P.S. (2010), ‘Wellbeing: The five essential elements’, Applied Research in Quality of Life, 6(3), 325–328.
Kushlev, K., Dunn, E.W., and Lucas, R.E. (2015), ‘Higher income is associated with less daily sadness but not more daily happiness’, Social Psychological and Personality Science, 6, 483–489.
Latif, E. (2016), ‘Happiness and comparison income: Evidence from Canada’, Social Indicators Research, 128, 161–177.
Li, J.Y. (2016), ‘Why economic growth did not translate to increased happiness: Preliminary results of a multilevel modeling of happiness in China’, Social Indicators Research, 128, 241–263.
Luo, Y., Wang, T., and Huang, X. (2016), ‘Which types of income matter most for wellbeing in China: Absolute, relative or income aspirations?’, International Journal of Psychology. DOI 10.1002/ijop.12284 (accessed December 4, 2017).
Ma, Y.Z., and Zhang, Y. (2014), ‘Resolution of the happiness-income paradox’, Social Indicators Research, 119, 705–721.
Michalos, A.C. (1985), ‘Multiple discrepancies theory (MDT)’, Social Indicators Research, 16(4), 347–413.
Ng, W. (2015), ‘Processes underlying links to subjective wellbeing: Material concerns, autonomy and personality’, Journal of Happiness Studies, 16, 1575–1591.
Ng, W., Kang, S., and Kua, W. (2017), ‘What determines subjective well-being in Singapore? The importance of personality, financial satisfaction, and psychological needs’, manuscript under review.
Oishi, S., and Kesebir, S. (2015), ‘Income inequality explains why economic growth does not always translate to an increase in happiness’, Psychological Science, 26, 1630–1638.
Oishi, S., Kesebir, S., and Diener, E. (2011), ‘Income inequality and happiness’, Psychological Science, 22, 1095–1100.
Oshio, T., Nozaki, K., and Kobayashi, M. (2011), ‘Relative income and happiness in Asia: Evidence from nationwide surveys in China, Japan, and Korea’, Social Indicators Research, 104, 351–367.
Oshio, T., and Urakawa, K. (2014), ‘The association between perceived income inequality and subjective wellbeing: Evidence from a social survey in Japan’, Social Indicators Research, 116, 755–770.
Powdthavee, N., Burkhauser, R.V., and De Neve, J. (2017), ‘Top incomes and human well-being: Evidence from the Gallup World Poll’, Journal of Economic Psychology, 62, 246–257.
Schnittker, J. (2008), ‘Diagnosing our national disease: Trends in income and happiness, 1973 to 2004’, Social Psychology Quarterly, 71(3), 257–280.
Sengupta, N.K., Osborne, D., Houkamau, C.A., Hoverd, W.J., Wilson, M.S., and Halliday, L.M. (2012), ‘How much happiness does money buy? Income and subjective well-being in New Zealand’, New Zealand Journal of Psychology, 41(2), 21–34.
Wang, P., Pan, J., and Luo, Z. (2015), ‘The impact of income inequality on individual happiness: Evidence from China’, Social Indicators Research, 121, 413–435.
Xiao, J.J. (2015), Consumer economic wellbeing, New York, NY, USA: Springer.
Yamashita, T., Bardo, A., and Liu, D. (2016), ‘Are East Asians happy to work more or less? Associations between working hours, relative income and happiness in China, Japan, South Korea and Taiwan’, Asian Journal of Social Psychology, 19, 264–274. G16.