6
Clustering of Singaporeans
In this chapter, we continue our inquiry into the influence of values on subjective wellbeing. We examine value orientations on a broader scale by using them to distinguish among clusters of Singaporeans. The value orientations cover both traditional and modern attitudes specific to the Singapore context. These value orientations had been used for the clustering of Singaporeans in two prior surveys (the 2001 Survey and the 2011 QOL Survey). Some value orientations are more pro-social and other-oriented, while some are more self-centered. For the 2016 QOL Survey, respondents were asked for their views on 31 statements on various value orientations. These include family values, eco-orientation, status consciousness, volunteerism, traditionalism, entrepreneurial spirit, and materialism. All items used to measure value orientations in the 2011 QOL survey were retained, except for one of the three statements on materialism (“Money is the most important thing to consider in choosing a job”) and six statements on e-orientation. These statements were dropped based on a review of the relevance and currency of the value orientations being measured. The responses ranged from “1 = strongly disagree” to “6 = strongly agree.” Higher means thus indicated greater agreement about a particular statement.
Identification of factors
Principal component factor analysis was conducted to derive the respective underlying dimensions of Singaporeans’ value orientations. An initial principal component factor analysis of the 31 statements on Value Orientations yielded seven factors that had eigen values above 1 and that explained 62.83 percent of the variance, with all items loaded above 0.5 (Nunnally 1978). The seven factors, the statements measuring the value orientations, their loadings and reliability alphas are indicated in Table 6.1. These factors and value orientations were then used to organize Singaporeans into the distinctive clusters.
- Family Values (Factor 1): This factor has seven statements that are similar to the Family Values factor derived in the 2001 Survey and the 2011 QOL Survey. The factor explained 19.74 percent of the total variance.
- Eco-orientation (Factor 2): This factor has the same five statements in the factor named as Eco-orientation in the 2011 QOL Survey. This factor was named Eco-orientation because the statements referred to environmentally responsible behaviors and choices. This factor explained 11.49 percent of the total variance.
- Status Consciousness (Factor 3): This factor has six statements all relating to status consciousness, unlike the factor in the 2011 QOL Survey, which combined all the five items in the Status Consciousness factor in the 2001 Survey and two out of the three items from the Materialism factor in the 2001 Survey. This factor explained 10.08 percent of the total variance.
- Volunteerism (Factor 4): This factor has four statements relating to volunteerism as opposed to three items in the 2011 QOL Survey. This factor explained 8.42 percent of the total variance.
- Traditionalism (Factor 5): This factor has all the five statements that made up the Traditionalism factor in the 2001 survey, unlike the 2011 QOL Survey when the factor included only three statements measuring respondents’ attitudes about divorce, religion and premarital sex, which were not related to traditions and was named Conservatism then in 2011. We now name this factor Traditionalism. It explained 4.99 percent of the total variance.
- Entrepreneurial Spirit (Factor 6): This factor has the same three statements as the Entrepreneurial Spirit factor in the 2001 and 2011 surveys. It explained 4.24 percent of the total variance.
- Materialism (Factor 7): This factor contains the two statements relating to money (“Money can solve most people’s problems” and “If I had to choose between having more money and leisure, I would choose more money”). This factor explained 3.87 percent of the total variance.
As described, three out of the seven factors in the 2016 QOL Survey are identical to their counterparts in 2011 and are measured by the same statements on value orientations. These three factors are Family Values, Eco-orientation and Entrepreneurial Spirit. Another three factors in 2016 retained some of the statements used for their counterparts in 2011. The Status Consciousness factor now includes all statements relating to status. The two statements relating to money in the Status Consciousness factor in the 2011 QOL Survey now form the Materialism factor in 2016. The factors Volunteerism and Traditionalism, with five and four statements respectively, have become more focused compared to the respective Volunteerism and Conservatism factors in 2011.
Generally, there was some stability in the value orientations being measured as the items within each value orientation remained about the same over the years (2016 compared to 2011 and 2001). The factor analyses and Cronbach alphas indicated a fairly robust and internally consistent structure for the various value orientations (see Table 6.1). In the sections to follow, we describe each factor and value orientation in detail. For each factor and value orientation, we
Table 6.1 Seven factors and factor loadings (2016)
| Factors and value orientations | Factor |
| loadings | |
|
|
|
| Factor 1: Family values(19.74% variance explained; Cronbach alpha 0.898) | |
| One should support one’s parents in their old age. | 0.742 |
| Family members should stand by one another through the ups and downs in life. | 0.865 |
| Family love makes a person feel appreciated and treasured. | 0.820 |
| One should honor one’s parents and grandparents. | 0.834 |
| Family members should communicate openly and honestly with each other. | 0.738 |
| One should strive to provide the best for one’s children. | 0.742 |
| Family members should be prepared to make sacrifices to help each other. | 0.726 |
| Factor 2: Eco-orientation (11.49% variance explained; Cronbach alpha 0.842) | |
| I am willing to pay more for products that are friendly to the environment. | 0.874 |
| I will stop buying my favourite brand if I know the company producing it was polluting the environment. | 0.761 |
| I usually buy products that use recyclable packaging. | 0.771 |
| I would be willing to bring my own bags for shopping to reduce the use of nonrecyclable bags. | 0.758 |
| I would be willing to use a nonpolluting detergent even if I have my laundry less white. | 0.783 |
| Factor 3: Status consciousness (10.08% variance explained; Cronbach alpha 0.868) | |
| I usually look out for well-known brands to reflect my status in life. | 0.803 |
| I like to own things that impress people. | 0.869 |
| I admire people who own expensive homes, cars and clothes. | 0.784 |
| I feel good if the credit card I use gives the impression of high status with exclusive privileges. | 0.807 |
| My social status is an important part of my life. | 0.540 |
| Factor 4: Volunteerism (8.42% variance explained; Cronbach alpha 0.832) | |
| I am willing to do volunteer work on a regular basis. | 0.792 |
| I often find time to be involved in community or charity work. | 0.803 |
| I feel I should do my part to help raise funds for charity. | 0.760 |
| I often donate money for charitable causes | 0.695 |
| Factor 5: Traditionalism (4.99% variance explained; Cronbach alpha 0.758) | |
| Divorce is unacceptable. | 0.653 |
| Religion is an important part of my life. | 0.640 |
| It is wrong to have sex before marriage. | 0.755 |
| I like to stick to traditional ways of doing things | 0.801 |
| I celebrate festivals in the traditional way. | 0.686 |
| Factor 6: Entrepreneurial spirit (4.24% variance explained; Cronbach alpha 0.643) | |
| I am creative and resourceful in solving problems. | 0.783 |
| I have more self-confidence than most people. | 0.796 |
| To me, realizing my fullest potential is more important than monetary rewards. | 0.610 |
| Factor 7: Materialism (3.87% variance explained; Cronbach alpha 0.758) | |
| Money can solve most people’s problems. | 0.817 |
| If I had to choose between having more money and leisure, I would choose more money. | 0.789 |
discuss the mean scores and how they compare with the 2001 Survey and the 2011 QOL Survey where applicable.
Family Values
The first factor is labeled Family Values. While a search of the literature did not reveal any studies that examined family values in detail, this value orientation is uniquely Singaporean. The Singapore Government has played a major role in promoting and upholding the importance of family values since 1994 through its Family Values campaign. The five shared family values that were purported to enhance the wellbeing of families and underpin the progress of Singapore were identified as (1) love, care and concern, (2) mutual respect, (3) filial responsibility, (4) commitment and (5) communication. We have used the same statements for the Family Values orientation for the 2001 and 2011 QOL Surveys. As shown in Table 6.2, the scores for all the seven statements measuring Family Values and the composite score have improved substantially in 2016 compared to 2011 and 2001. This was an encouraging result as it demonstrated that more than two decades after the Family Values campaign was started in 1994, Singaporeans were increasingly supportive of the core family values promoted. Singaporeans in 2016 gave top consideration to honoring one’s grandparents and parents, which used to be ranked second in 2011 and fourth in 2001. The scores for Statements A, B and C (in Table 6.2) also highlighted the importance Singaporeans placed on caring for the elderly and family love.
Eco-orientation
The second factor containing statements measuring eco-orientation in the 2016 QOL Survey is shown in Table 6.3. These five statements were also used in the 2001 Survey and the 2011 QOL Survey. The composite mean score and the
Table 6.2 Statements and mean scores on Family Values
| Statements on family values | Mean score (rank) 20011 | Mean score (rank) 20111 | Mean score (rank) 2016 |
|
|
|||
| A. Family love makes a person feel appreciated and treasured. | 4.83 (1) | 5.20 (4) | 5.39 (4) |
| B. One should support one’s parents in their old age. | 4.76 (2) | 5.28 (1) | 5.40 (2) |
| C. Family members should stand by one another through ups and downs. | 4.73 (3) | 5.23 (2) | 5.40 (2) |
| D. One should honor one’s parents and grandparents. | 4.70 (4) | 5.23 (2) | 5.43 (1) |
| E. Family members should communicate openly and honestly with each other. | 4.69 (5) | 5.09 (5) | 5.27 (6) |
| F. Family members should be prepared to make sacrifices to help each other. | 4.61 (6) | 5.02 (6) | 5.19 (7) |
| G. One should strive to provide the best for one’s children. | 4.54 (7) | 4.97 (7) | 5.32 (5) |
| Family values (composite score) | 4.69 | 5.15 | 5.34 |
1 Mean of 6-point sale: 1 = Strongly disagree, 6 = Strongly agree.
Table 6.3 Statements and mean scores on Eco-orientation
| Statements on eco-orientation | Mean score 2001 (rank) | Mean score 2011 (rank) | Mean score 2016 (rank) |
|
|
|||
| A. I would be willing to use a nonpolluting detergent even if I have my laundry less white. | 4.01 (4) | 4.00 (4) | 4.10 (4) |
| B. I would be willing to bring my own bags for shopping to reduce the use of nonrecyclable bags. | 3.90 (5) | 4.25 (2) | 4.24 (2) |
| C. I usually buy products that use recyclable packaging. | 4.04 (3) | 3.95 (5) | 4.08 (5) |
| D. I will stop buying my favorite brand if I know the company producing it was polluting the environment. | 4.12 (2) | 4.34 (1) | 4.43 (1) |
| E. I am willing to pay more for products that are friendly to the environment. | 4.30 (1) | 4.15 (3) | 4.17 (3) |
| Eco-orientation (composite score) | 4.03 | 4.03 | 4.20 |
mean scores for the individual statements for 2016 were higher than those for 2001 and 2011. However, the ranking of the mean scores in 2016 was identical to that of 2011. This result indicated that more Singaporeans continued to be appreciative of the need to protect the environment, even those who are brand conscious. It is also encouraging to note that the statement “I would be willing to bring my own bags for shopping to reduce the use of nonrecyclable bags,” which was ranked last in 2001 but ranked second in 2011, continued to be ranked second in 2016. This implies that the campaign to reduce plastic waste has gained some traction.
Status Consciousness
The third factor, Status Consciousness, comprises the same five statements used in the 2001 Survey and the QOL 2011 Survey, as shown in Table 6.4. Although the mean composite score for 2016 was lower than that for 2011, we were not able to ascertain that Singaporeans are less status conscious, as the scale items were not comparable across the two surveys. Only five statements rather than seven statements were included in the factor termed Status Consciousness in 2016. However, the means of the five statements that were measured across all three years showed a decrease in 2016 compared to 2001 and 2011. Nevertheless, in 2016, Singaporeans were just as concerned about their status (ranked first in 2016) and even more focused on owning well-known brands (this value became 2nd-ranked compared to 7th and 6th in 2001 and 2011, respectively).
Volunteerism
Table 6.4 Statements and mean scores on Status Consciousness
| Statements on status consciousness | Mean score 2001 (rank) | Mean score 2011 (rank) | Mean score 2016 (rank) |
|
|
|||
| A. I like to own things that impress people. | 3.94 (4) | 3.33(4) | 2.88 (4) |
| B. I usually look out for well-known brands to reflect my status in life. | 3.84 (7) | 3.17(6) | 3.15(2) |
| C. I admire people who own expensive homes, cars and clothes. | 3.89 (5) | 3.20(5) | 2.92(3) |
| D. I feel good if the credit card I use gives the impression of high status with exclusives privileges. | 3.85 (6) | 3.03(7) | 2.57(5) |
| E. My social status is an important part of my life. | 4.12(3) | 3.94(2) | 3.62(1) |
| F. Money can solve most people’s problems | 4.30(1) | 4.32(1) | N.A.1 |
| G. If I had to choose between having more money and leisure, I would choose more money. | 4.24 (2) | 3.94(2) | N.A. |
| Status consciousness (composite score) | 4.01 | 3.34 | 3.03 |
1 N.A.: This item was not part of the factor of Status Consciousness.
The four statements measuring Volunteerism in the 2016 QOL Survey are shown in Table 6.5, compared to three statements in the 2001 Survey and the 2011 QOL Survey. Despite the addition of one statement, the mean composite score for Volunteerism in 2016 was lower than those in 2001 and 2011. The means and ranking of the four statements in 2016 show that Singaporeans’ Volunteerism focused more on monetary contributions than on actual involvement in community work.
Table 6.5 Statements and means scores on Volunteerism
| Statements on volunteerism | Mean score 2001 (rank) | Mean score 2011 (rank) | Mean score 2016 (rank) |
|
|
|||
| A. I am willing to do volunteer work on a regular basis. | 3.93 (2) | 3.96 (2) | 3.89(3) |
| B. I often find time to be involved in community or charity work. | 3.90(3) | 3.77(3) | 3.61 (4) |
| C. I feel I should do my part to help raise funds for charity. | 4.27(1) | 4.30(1) | 4.16(2) |
| D. I often donate money for charitable causes | N.A.1 | N.A.1 | 4.17(1) |
| Volunteerism (composite score) | 4.03 | 4.01 | 3.96 |
1 N.A.: This item was not part of the factor of Volunteerism in 2001 and 2011.
Traditionalism
The three statements in the 2016 Traditionalism factor that measured views about divorce, premarital sex and the importance of religion were included as part of the Conservatism factor in the 2011 QOL Survey and the 2001 Survey (see Table 6.6). Although the mean composite score for 2016 is higher than that for 2011, we cannot ascertain that Singaporeans are more traditional (or conservative) because four statements rather than three were included in the factor termed Traditionalism in 2016. However, the mean ratings and ranking for the identical three statements used for the past three years show that, in 2016, Singaporeans appeared to be more conservative than they were in 2001 and 2011. Singaporeans were traditional in terms of celebrating festivals, with a high mean score of 4.46 (out of a 6-point scale) in 2016.
Entrepreneurial Spirit
The statements measuring Entrepreneurial Spirit in the 2016 QOL Survey are shown in Table 6.7. These are similar to the ones used in the 2001 Survey and the 2011 QOL Survey. Except for “I have more self- confidence than most people,” the other two indicators (mean scores for individual statements and means for composite scores) were higher in 2016 compared to 2001 and 2011, implying that Singaporeans were becoming more entrepreneurial over the years, despite losing some self-confidence.
Table 6.6 Statements and mean scores on Conservatism (2001 and 2011) and part of Traditionalism (2016)
| Statements on conservatism (2001 and 2011) and traditionalism (2016) | Mean score 2001 (rank) | Mean score 2011 (rank) | Mean score 2016 (rank) |
|
|
|||
| A. Divorce is unacceptable. | 4.13(2) | 3.77(3) | 3.90 (4) |
| B. Religion is an important part of my life. | 4.17(1) | 4.21(1) | 4.42 (2) |
| C. It is wrong to have sex before marriage | 4.12(3) | 4.13(2) | 4.21 (3) |
| D. I celebrate festivals in the traditional way | N.A.1 | N.A. | 4.46 (1) |
| Conservatism/Traditionalism (composite score) | 4.14 | 4.04 | 4.22 |
1 N.A.: This item was not part of the Conservatism factor in 2001 and 2011.
Table 6.7 Statements and mean scores on Entrepreneurial Spirit
| Statements on entrepreneurial spirit | Mean score 2001 (rank) | Mean score 2011 (rank) | Mean score 2016 (rank) |
|
|
|||
| A. I have more self-confidence than most people. | 4.22(1) | 4.40 (1) | 4.38 (3) |
| B. I am creative and resourceful in solving problems. | 4.14(3) | 4.33 (3) | 4.49 (2) |
| C. To me, realizing my fullest potential is more important than monetary awards. | 4.22(1) | 4.37(2) | 4.68 (1) |
| Entrepreneurial spirit (composite score) | 4.22 | 4.37 | 4.51 |
Table 6.8 Statements and mean scores on Materialism
| Statements on materialism | Mean score 2001 (rank) | Mean score 2011 (rank) | Mean score 2016 (rank) |
|
|
|||
| A. Money can solve most people’s problems | 4.30(1) | 4.32(1) | 4.04 (1) |
| B. If I had to choose between having more money and leisure, I would choose more money. | 4.24(2) | 3.94(2) | 3.71 (2) |
| Materialism (composite score) | N.A.1 | N.A.1 | 3.87 |
1 N.A.: These items were part of the factor of Status Consciousness in 2001 and 2011.
Materialism
This final and seventh factor comprises two statements relating to money that used to be part of the Status Consciousness factor in the 2001 Survey and the 2011 QOL Survey (see Table 6.8). The mean scores for the two statements on materialism have declined since 2001 and 2011, implying that Singaporeans are less pecuniary conscious over the years.
The means for the value orientations provided some insights into how the value orientations have evolved (see Tables 6.2–6.8). The means for all the value orientations have increased over the years, except for Status Consciousness and Volunteerism.
Identification of clusters

Figure 6.1
Five clusters of Singaporeans
Based on the seven factors identified, a k-means cluster analysis was conducted to identify groups of Singaporeans based on their responses to the various statements on value orientations. These clusters should be stable and reproducible according to accepted statistical protocol. We are also interested in exploring how the 2016 clusters are different from the clusters in the 2001 and 2011 studies. Our analyses showed that a five-cluster solution provided good interpretability and also comparability with the 2011 six-cluster solution. An ANOVA shows that all F ratios that describe the differences between clusters were statistically significant, hence indicating that the seven factors contributed much to the separation of the clusters. Figure 6.1 shows the radar diagram of the five clusters and the extent to which each value orientation is manifested in each of these clusters. Table 6.9 shows the cluster centroids, which, together with the demographics shown in Table 6.10, are used in describing the clusters in greater detail.
Table 6.9 Cluster centroids

Description of clusters
Cluster 1: The Pro-Social Family-Oriented
This cluster included 22.4 percent of Singaporeans. They had the second highest score on Family Values, Eco-orientation, and Volunteerism, indicating a strong focus on family and also an outward-looking perspective in terms of caring for others and the environment. They were average on Traditionalism and Entrepreneurial Spirit (3rd-ranked on both value orientations) and the least materialistic and status conscious (lowest scores on Materialism and Status Consciousness). We have labeled this cluster The Pro-Social Family-Oriented.
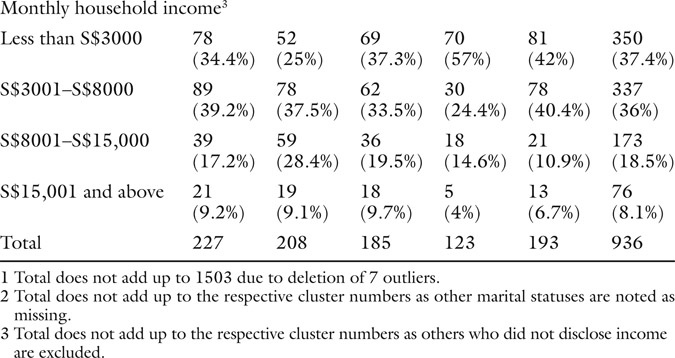
Demographically, as shown in Table 6.10, this group comprised slightly more females (62 percent). Most of the members in this cluster came from an older age group of 45 to 54 years (21.1 percent). They were mostly married (70.5 percent), with more Malays than the total sample (19.9 percent versus 14 percent). A majority of them had secondary/junior college/polytechnic educations (60.7 percent) and household incomes between S$3001 and S$8000 (39.2 percent).
Cluster 2: The Status-Conscious
This cluster included 20.1 percent of Singaporeans. They had the second highest scores on Status Consciousness and Materialism, thus the naming of the cluster as The Status-Conscious. They had the lowest score on Traditonalism and the second lowest score on Entrepreneurial Spirit. They were average on Family Values, Eco-orientation and Volunteerism (3rd-ranked on all three value orientations).
Demographically, as shown in Table 6.10, this group’s members were quite gender-balanced (48.2 percent male versus 51.8 percent female) and younger than the first cluster as almost a quarter each were from the 15- to 24-year, 25- to 34-year and 35- to 44-year age groups (20.6 percent, 20.3 percent and 25.6 percent, respectively). There was a higher proportion of singles (44 percent versus 33 percent for the total sample), and more Chinese (88.7 percent versus 76.3 percent for the total sample). Half of the Singaporeans in this cluster had secondary/junior college/polytechnic educations (53.2 percent), while more than a third were graduates (40.2 percent). Slightly more than a third (37.5 percent) had household incomes between S$3001 to S$8000, and more than a quarter (28.4 percent) of them had higher incomes of S$8001 to S$15,000.
Cluster 3: The Dreamers
This cluster included 18.9 percent of Singaporeans. They had the lowest score on Entrepreneurial Spirit and the second lowest scores on Family Values, Eco-orientation, Traditionalism, and Volunteerism. They were average on Status Consciousness and Materialism (3rd-ranked on these two values). As the scores were relatively low across the various value orientations with no strong distinctive characteristics, we have labeled this as The Dreamers.
Demographically, as shown in Table 6.10, this group’s members were also quite gender-balanced (49.3 percent male versus 50.7 percent female). They were fairly well distributed across all age groups, from the 15- to 24-years age group to 65 years and above. Close to two-thirds were married (60.4 percent), and most were Chinese (89 percent versus 76.3 percent for the total sample). More than half of Singaporeans in this cluster had secondary/junior college/polytechnic (52.2 percent) educations. Slightly more than a third of the Singaporeans in this cluster (37.3 percent) had household incomes of less than S$3000, and another third (33.5 percent) had household incomes between S$3001 and S$8000.
Cluster 4: The Traditional Entrepreneurs
This cluster included 18.8 percent of Singaporeans. They had the second highest scores on Traditionalism and Entrepreneurial Spirit, the second lowest scores on Materialism and Status Consciousness, and the lowest scores on Family

Values, Eco-orientation and Volunteerism. Hence we have labeled them The Traditional Entrepreneurs.
Demographically, as shown in Table 6.10, this group’s members were mostly male (57 percent) and slightly older, with close to a quarter from the 55- to 64-year age group. More than three-quarters of them were married (78.3 percent), and the distribution across the four races is close to the the total sample, with Chinese being the majority. More than half had secondary/junior college/polytechic educations (53 percent), although compared to the previous three clusters, this cluster had a higher percentage (27 percent) with primary and below educations. Household incomes for this cluster were low, with half (57 percent) having incomes of less than S$3000.
Cluster 5: The Materialistic Family-Oriented
This cluster included 19.8 percent of Singaporeans. They had the highest scores on all seven value orientations, namely Family Values, Eco-orientation, Status Consciousness, Traditionalism, Entrepreneurial Spirit, Materialism and Volunteerism. They were one of two highly family-oriented clusters and were different from the Pro-Social Family-Oriented cluster due to their materialistic leanings. Hence we have labeled them The Materialistic Family-Oriented.
Demographically, as shown in Table 6.10, this group’s members were quite equally distributed across both genders (52 percent male and 48 percent female), and a quarter (27.4 percent) from the 45- to 54-year age group. More than two-thirds (69 percent) were married Singaporeans. This cluster was more ethnically diverse, with more Malays (25 percent), Indian (13 percent) and others (3 percent), and fewer Chinese (59 percent) than the total sample. Also, more than two-thirds of Singaporeans in this cluster had secondary/junior college/polytechnic educations (68.6 percent), which was the highest across the five clusters and also above that for the total sample (57.6 percent). It had more Singaporeans in the less than S$3000 household income range (42 percent) and in the S$3001 to S$8000 range, compared to the total sample (37.4 percent and 36 percent, respectively). This cluster had attained a good level of education, although the incomes were in the lower range.
Comparisons of clusters: 2001, 2011 and 2016
In the following section, comparisons are made between the eight clusters of 2001, the six clusters of 2011 and the five clusters of 2016 (Figure 6.2) to shed light on the evolving value orientations of Singaporeans. The revision in the number and composition of the clusters in 2016 could be partly attributed to the changes in the factors/value orientations used in the clustering exercise. As mentioned, out of the seven factors, only three factors (Family Values, Eco-orientation, and Entrepreneurial Spirit) retained the same items as those used in the 2011 QOL Survey.
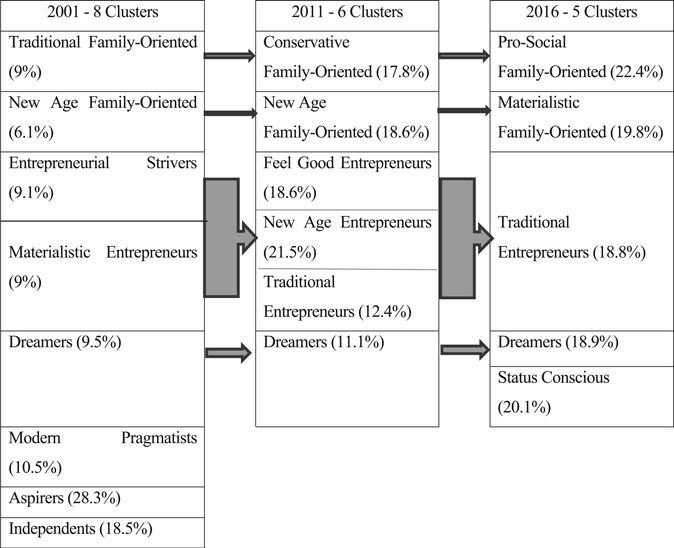
Figure 6.2
Comparisons of clusters: 2001, 2011 and 2016
In 2016, we saw some interesting developments in the five-cluster configuration. Family Values continued to feature strongly. There were two family-oriented clusters, and they were differentiated by their views on Status Consciousness and Materialism. In previous years, we also had family-oriented clusters, but they were distinguished by their views on Traditionalism/Conservatism and Eco-orientation/Volunteerism. The interesting cluster that has appeared was the Materialistic Family-Oriented cluster, which had top scores for all the value orientations. This was an “all-rounder” type of cluster that seemed to want and/or strive for everything.
Similar to 2011, the Traditional Entrepreneurs cluster remained. However, in 2016, there was only one cluster of entrepreneurs compared to the three clusters in 2011. Previously, Eco-orientation and Volunteerism were used to distinguish among the three clusters. However, in 2016, we noted that these value orientations were more diffuse across all the clusters.
The Dreamers cluster resurfaced in 2016 (18.9 percent) and was a larger cluster compared to 2001 (9.5 percent) and 2011 (11.1 percent). The 2016 and 2011 clusters were similar in terms of their lowest scores on entrepreneurial spirit.
A Status-Conscious cluster has remained through the years. The emphasis on Status Consciousness and Materialism can be seen in 2001’s clusters –The Materialistic Entrepreneurs, The Dreamers and The Aspirers – and to a certain extent in 2011’s cluster of The Dreamers. This emphasis appeared to be more pronounced in earlier years.
Conclusion
In this chapter, we reported the value orientations and clustering of Singaporeans in 2016 with comparisons to findings from the 2001 and 2011 surveys. Three out of the seven factors in the 2016 QOL Survey were identical to their counterparts in 2011 and were measured by the same statements on value orientations. These three factors were Family Values, Eco-orientation and Entrepreneurial Spirit. Another three factors in 2016 retained some of the statements used for their counterparts in 2011. The Status Consciousness factor now included all statements relating to status, while the two statements relating to money in the Status Consciousness factor in the 2011 QOL Survey formed the Materialism factor in 2016. The factors Volunteerism and Traditionalism, with five and four statements, respectively, have become more focused compared to the respective Volunteerism and Conservatism factors in 2011. Hence, there was some stability in the value orientations being measured as most of the items within each of the seven value orientations remained about the same over the years (2016 compared to 2011 and 2001).
Ronald Inglehart and Christian Welzel, in their analysis of the World Values Survey data, suggested that there were two major dimensions of cross-cultural variation in the world: (1) Traditional values versus Secular-rational values and (2) Survival values versus Self-expression values. Traditional values emphasize the importance of religion, parent–child ties, deference to authority and traditional family values. These societies also tend to be nationalistic. In contrast, societies embracing Secular-rational values are more open to and accepting of issues such as divorce, abortion, euthanasia and suicide. Survival values are related to economic and physical security, a relatively ethnocentric outlook and low levels of trust and tolerance. Self-expression values give high priority to environmental protection, a tolerance of marginalized groups and demands for participation in decision making in economic and political life.
Singaporeans’ strong emphasis on Family Values and Traditionalism would place Singapore on the Traditional values dimension. The focus of Singaporeans on Materialism, Eco-orientation and Entrepreneurial Spirit would also fit in with the Survival values dimension. However, it remains to be seen if having a Survival values orientation implies that Singaporeans have low levels of trust; trust and social capital will be discussed in Chapter 7.
With a fairly similar set of value orientations, we started with eight clusters in 2001, and these were narrowed down to six clusters in 2011 and finally to five clusters in 2016. The revision in the number and composition of the clusters over the years could be partly attributed to the changes in the compositions of the value orientations mentioned earlier, shifts in the scores respondents gave to each value item, and changes in the demographics of the respondents.
References
Nunnally, J.C. (1978), Psychometric theory, Second Edition, New York, NY, USA: McGraw-Hill.
World Values Survey. www.worldvaluessurvey.org/WVSContents.jsp (accessed November 17, 2017).