
Chapter 2
Data Management
One of the most critical design and architecture decisions adopters of advanced analytics must make is whether to store analytic data in a data warehouse or in a standalone analytic database. Where does the data go? Where is it managed? Where are we going to do our analytical processes?
Philip Russom, Senior Manager, TDWI Research
The integration of disparate data types across siloed upstream engineering disciplines is gaining momentum owing to the demand for accurate predictions and effective field engineering strategies that can address critical business issues across the exploration and production (E&P) value chain. Where the interpretation of a single data type is sufficient to provide insight into variations hidden in a limited set of physical properties or combinations thereof, a multivariate perspective enabled by integration of different data types will have potential for more robust estimates and more astute discrimination of different physical effects.
The oil and gas industry is collecting massive amounts of sensor data from operations spanning exploration, drilling, and production. The velocity and complexity of data growth has put immense strain on application and database performance. This rapid growth necessitates a fundamental change to the way data are collected, stored, analyzed, and accessed to support real-time intelligence and condensed decision-making cycles.
Oil and gas operators are faced with a daunting challenge as they strive to collate the raw data that serve as the very foundation of their business success, transforming that raw data into actionable knowledge. However, with the exponential growth in data volumes and the breadth of siloed, disparate data sources increasing at ever-faster rates, the industry is realizing that data management is fundamental to their success. Let us explore some important concepts in data management that enable geoscientists to become effective data scientists as wardens of an oil and gas (O&G) company’s vital asset: data.
EXPLORATION AND PRODUCTION VALUE PROPOSITION
Exploration and production (E&P) is inherently one of the world’s most challenging analytical, Big Data industries. The oil and gas industry produces petabytes of data and the data sizes are only increasing.
What is Big Data? Figure 2.1 identifies the three key ingredients to the Big Data amalgam: volume, variety, and velocity. Unfortunately, the methods to analyze data have not kept pace, and so value can appear as an unattainable goal.
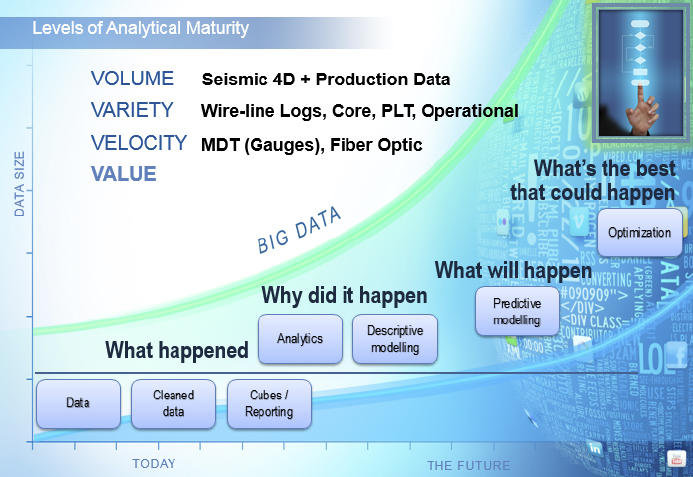
Figure 2.1 Big Data Combined with Big Analytics
The oil and gas industry has always managed significant data volumes. However, the business climate now favors companies that are positioned to use the entirety of available data (not just spatial or temporal samples) to fine-tune E&P strategies. The emergence of advanced analytics within a high-performance environment enables more companies to take advantage of the descriptive and predictive insights previously locked up in siloed data sources.
We need to establish an integrated environment of solutions, tools, methodologies, and workflows that enable oil and gas companies to manage Big Data as a valued asset, driving both core operational processes and strategic decision making. With established data management capabilities, organizations can make full use of all incoming data to uncover hidden insights and increase the competitive edge.
Over the past decade we have witnessed the adoption of a digital oilfield strategy and integrated operations. As these blueprints for automated and semi-automated processes become more pervasive across the industry, we shall see an ever-increasing frequency of data being generated. This phenomenon translates into high velocities. Sometimes high-frequency and low-latency events must be resolved to preclude catastrophic events such as pump failures. We shall investigate some of these case studies in Chapters 5 and 6 when we discuss drilling and completion optimization as well as reservoir management.
It is also critical to adopt an effective geographic information systems (GIS) environment as well as a subsurface management system (GGRE) within the data management (DM) platform. Knowledge garnered from raw disparate data collated from the diverse upstream engineering silos is tantamount to the life-blood of O&G companies. These datasets constitute the variety of input sources. Essentially, good GIS and DM protocols and architectures are fundamental to the financial success of the company as it navigates the choppy economic waters that are globally in a constant state of flux.
Invariably, an oil and gas company has multiple information systems, each churning through a plethora of data to expedite and enhance the decision-making cycles. Successful administration of these information systems necessitates professional data management practices. Key responsibilities should include.1
- Overseeing data through program coordination
- Integration across systems
- Sound stewardship
- Establishing quality processes
- Developing new systems and support operations
The industry has been impacted by the introduction of Sarbanes-Oxley,2 catapulting data management into a crucial prerequisite for effective corporate governance. Thus, O&G upper management are more interested than ever in the provenance, fullness, and accuracy of all types of information fundamental to their financial and management accounting statements. Data management processes must, therefore, be clearly defined, repeatable, and auditable, allowing risks to be quantified and ultimately mitigated.
Cadres of engineers, scientists, researchers, and other personnel across the E&P routinely apply their own cleansing routines to manipulate data prior to using them in the processes that can create value and insight. Data cleansing routines and cleansed data are seldom shared between practices and regional groups because of differences in data storage systems and application systems from different vendors.
Bad and duplicate data reduce your efficiency, increase your maintenance costs, and contribute to higher development costs for every IT project. Each project must wade through poorly documented legacy data to determine which data to use for a specific project. Often a onetime “fix” is developed for a particular project and redeveloped in subsequent projects. These “fixes” are continually revisited over time as source or destination systems change or are upgraded, resulting in added costs and inefficiencies. Often changes made in one system trigger unforeseen failures in downstream processes. The lack of unified metadata on the creation, manipulation, and use of data is the reason these events occur.
The most successful E&P companies will have a clear and precise strategy in place that recognizes data as a fundamental cornerstone of their competitive differentiation. Those who succeed by addressing data as a strategic asset will be the leaders who can address all their needs by using one integrated offering, thereby having the flexibility to react to new challenges quickly.
A single integrated offering will shorten learning curves and give decision makers the information and data confidence they really need to support decisions. Correct data will be delivered where and when they are needed with high confidence. Any questions about the lineage of the data will be answered with tools that identify the data origin and all transformations applied to that data. Eliminating the piecemeal approach of linking and managing technologies from different vendors ensures data credibility, reduces risk, and speeds results. O&G customers adopting this strategy will benefit from better decisions that will be measured as faster time to revenue, fewer dry holes, less downtime, and increased reliability.
The single integrated offering must support the needs of the enterprise, spanning both the operational and analytical needs. The use of data for operations can span virtually every department and every workflow within those departments. The data quality needs of each of these workflows must be identified and included in minimal requirements of the data quality solution. Especially important in this analysis is to capture the unique needs of the sciences for O&G companies. Improving the quality of seismic, well logs, and process data involves statistical processes and manual interpretations that are not available in most data-quality solutions.
DATA MANAGEMENT PLATFORM
With a data management (DM) platform, you can create automated and semi-automated workflows for data quality, data integration, and master data management (MDM) processes. Such a framework frees valuable time for the geoscientists to devote their energy to interpretive tasks for which they are highly trained, releasing them from the onerous and tedious assignment of collating pertinent datasets.
A well-structured DM platform enables E&P personnel to:
- Correct, standardize, and validate information across the enterprise from a single platform.
- Profile metadata and data to discover errors, inconsistencies, redundancies, and incomplete information.
- Match, merge, or integrate data from a variety of disparate sources.
- Enrich data using information from internal and external data sources.
- Check and control data integrity over time with real-time data monitoring, dashboards, and scorecards.
- Write business rules once and easily reuse them in other workflows.
Inconsistent and disjointed data can put your organization at risk by jeopardizing enterprise resource planning (ERP), customer relationship management (CRM), data warehousing, business intelligence (BI), or any other initiative that relies on accurate data drawn from multiple sources. An effective data integration strategy can lower costs and improve productivity by promoting consistent, accurate, and reliable data across your enterprise.
The DM platform is a single, unified platform that enables real-time, batch, and virtual data integration:
- Match, reconcile, and consolidate multiple data sources to create the best possible view of a well, reservoir, field, asset, gas–oil separation plant (GOSP), operator, facility, or geographical location.
- Gain access to the right data sources at the right time to spur enhanced decision making.
- Ensure that high-quality information arrives at new data targets during data migration or consolidation efforts.
- Access your data on virtually any platform during an integration project.
- Increase the quality of your data before loading it into new systems.
MDM is the creation of a single, accurate, and unified view of corporate data, integrating information from various data sources into one master record. This master data is then used to feed information back to the applications, creating a consistent view of data across the enterprise.
In a challenging economic environment, reactive decision making is not sufficient to sustain a competitive advantage. Oil and gas companies are collecting more data, dealing with more complex business issues, and experiencing heightened global competition. There has never been a greater need to transform data assets into innovation and maximize the productivity of resources to drive sustainable growth. It is plausible to combine grid computing and in-database processing to drive proactive, evidence-based business decisions and promote agile strategies to anticipate and manage change.
Previously large datasets, complexity of data relationships, and modeling such complexity made it impossible to solve the highest-value business analytic computations quickly and efficiently. High-performance computing, which combines in-database processing and grid computing, solves business problems once thought to be unsolvable. With high-performance computing, business users see exponential performance gains, an increase in productivity, and the ability to streamline their analytics processes. Together, in-database processing and grid computing enable a revolution in business analytics and offer customers immediate competitive differentiation and cost savings.
From legacy systems to enterprise resource planning (ERP) applications, data from virtually any hardware platform or operating system can be accessed, cleansed, and processed. New source systems can easily be added and security is managed centrally. This saves time, shortens learning curves, and gives decision makers the complete information they need.
Data are the common factor that enables the best business decisions. Whether you are an executive or an engineer, the best decision you will make is the one based upon data. But decision makers often lack confidence that the data are correct, current, complete, and used correctly. The lack of confidence is the direct result of the difficulties of working with data, the explosive growth in data resulting from numerous sources (digital oilfield), and the haphazard way in which they are typically used in the enterprise. To be effective the data must be considered a corporate asset that must be nurtured and managed to be useful for the creation of value to the enterprise.
Problems with data quality have existed for longer than there have been computers. Initially thought of as an irritant that could be corrected with White-Out, the data quality issue has continued to grow with the proliferation of systems and application of automation in more and more areas of operation. The ERP wave that swept the oil and gas industry in the 1990s held the promise of correcting data issues with a single instance of enterprise data. That promise was never met since the ERP systems seldom held all the enterprise’s data, and mergers, acquisitions, and business requirements resulted in multiple instances of ERP applications. Besides duplicity, bad data come from a wide variety of sources, including:
- Source systems’ inaccurate data entry
- Typographical and data manipulation errors
- Flawed data entry processes utilizing misunderstood or inaccurate data fields
- Null or blank entries
- Data transmission errors in process data
- Invalid data types
- Noise in seismic data
- Spikes in process data
- Aging of data owing to failure to use latest well logs
- Improper extraction transformation and loading (ETL) jobs
- Loss of granularity commonly found with process data
- Numeric precision
- Incorrect data types
- Incorrect data corrections
- Poorly supervised or executed media transcription intended to extend data lifecycles, corrupting metadata
The analysis of data management requirements sheds insight into the current state of affairs. The following data governance model provides guidance for the journey to world-class data governance.
- Undisciplined
- Duplication rampant
- Unintegrated silos of data
- One-off processing for all initiatives
- IT-only data quality projects addressing basics like well, reservoir, and field
- Reactive
- Some cross-functional collaboration
- Data warehouses for reporting
- Multiple data sources tapped for one-off initiatives
- High maintenance and initiative development costs
- Business users needing to rely on IT for initiatives
- Proactive
- IT and business group collaborating on targeted domains of data integration and data quality
- Some enterprise-wide views in certain domains
- Some data quality standardization
- Data recognized as corporate asset
- Enterprise data architecture defined
- Governed
- Business requirements driving IT efforts
- Repeatable automated processing of data
- Data consumers helping themselves to integrated extracts of data from multiple sources
- Development of process optimization
To address the emerging issues around managing, governing, and utilizing data, organizations have been acquiring quite a toolbox of data integration tools and technologies. One of the core drivers for these and the subsequently assembled data integration toolbox, has been the ever-evolving world of the data warehouse.
Organizations need tools and technologies that can address new requirements and enable employees to focus on the job at hand instead of spending their time constantly integrating disparate technologies in the toolbox. The need for a single, integrated data management platform that can address all aspects of data integration, data quality, and master data management could be sounding the death-knell for the data integration toolbox. These key areas will be underpinned by adapters and a federation capability, and will share technical and business metadata that aid in collaboration. Ultimately, a single user interface should surface all the capabilities of this platform rather than a disparate set of user interfaces. Let us enumerate the functions a single governance model must provide to move an enterprise into a controlled and quality-conducive environment:
- Movement and integration
- Migrate to new data stores or implementation of new systems.
- Reduce data sources.
- Consolidate from multiple environments.
- Synchronization
- Ensure consistency between systems where data cannot be moved or combined.
- Enable data capture or change in low-latency environments.
- Quality
- Monitor and alert of issues.
- Inspect and correct data errors.
- Standardize data values.
- Validate using custom-defined business rules.
- Remove redundant data entries.
- Incorporate reporting, validation, and analytical tools.
- Management
- Data quality stewards are empowered to control data assets.
- Data are enhanced with application of business rules.
- Services
- Maintain metadata linkages to surface the master data as needed.
- Coordinate and manage maintenance of master data at the source system with real-time updates provided as a called-upon service.
In summary, O&G companies must adopt an information management (IM) strategy to underpin an analytical foundation that provides the requisite intelligence—one that is based on both historical and “live” operational data—hence the concept of what is now seen as an “active” data warehouse. An active data warehouse aligns business intelligence, “What has happened,” and operational intelligence, “What is happening,” creating active intelligence that allows actionable information, enabling a company to decide “What is going to happen.” Analytics underpin these strategies in data management.
We shall retain a consistent thread of discussing the concept of analytics throughout the book. Analytics encompass a wide range of techniques and processes for collecting, classifying, and interpreting data to reveal patterns, anomalies, key variables, and relationships. The goal is to derive new insights that drive better decisions and more effective operational processes.
For many users, analytics means little more than slicing, dicing, sorting, filtering, drilling down, and visualizing data to investigate past events. However, a growing number of oil and gas companies are embracing more advanced forms of analytics in a quest to predict the future and adapt to rapid change—especially important capabilities in an unforgiving economy with unpredictable fluctuations in the price of oil and gas.
The opening gambit to all analysis is a data management platform such as the four-tiered architecture discussed in the following section.
Four-Tiered DM Architecture
In order to transform raw data into a viable and effective asset, E&P organizations are pursuing an implementation of a four-tiered platform architecture (Figure 2.2):
- Information platform
- Knowledge platform
- Collaboration and analytical framework
- Performance platform

Figure 2.2 Oil and Gas Four-Tiered DM Architecture
Information Platform
The information platform handles the transformation of data into information, assures the consistency and accuracy of the information, adapts it according to the needs of the users, and provides full access to the information. This base platform ensures that the information, communications, directives, and decisions can flow freely, striving toward a probabilistic range of acceptable outcomes based on a multivariant, multidimensional, multivariate, and stochastic analysis of the aggregated data.
What do these types of data represent in an analytical sense?
- Multivariant: Multiple independent variables that affect the outcome of a singularity as depicted in Figure 2.3.
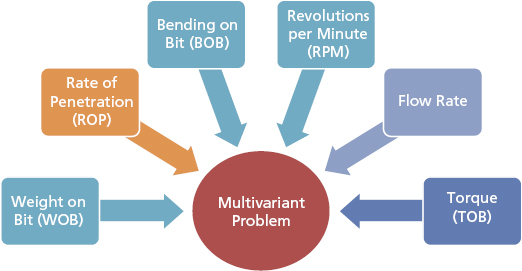
Figure 2.3 Multivariant Perspective
- Multidimensional: Dimensions that affect independent variables. For example vibrations can be axial, tangential, and lateral, as illustrated in Figure 2.4. It refers to an input space where several exploratory variables may epitomize the property of collinearity where the values demonstrate an exact or approximate linear relationship. Anisotropy inherent in some rock properties, such as permeability, increases the dimensionality of the input space since it is directionally dependent.

Figure 2.4 Multidimensional Perspective
- Multivariate: Multiple dependent variables that have to be predicted in order to reach an objective on a singularity. These are typically variables that have interdependencies that can impact the outcome of the singularity. For example, Figure 2.5 shows torque impacts RPM; weight affects torque and RPM; all three affect rate of penetration (the outcome).

Figure 2.5 Multivariate Perspective
- Stochastic: Variability and random behavior of independent variables. For example, the performance of the bit will vary, depending on time, rock strength, and flow rates, as seen in Figure 2.6.
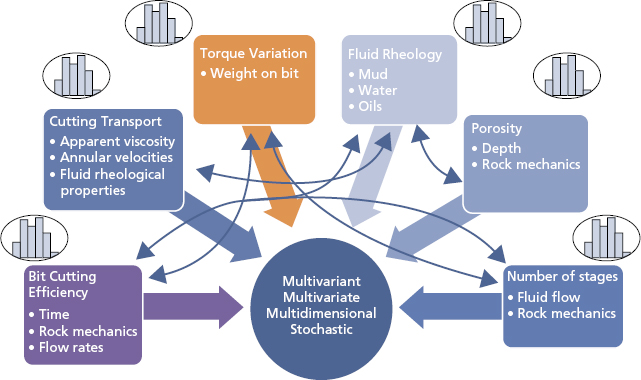
Figure 2.6 Stochastic Perspective
Knowledge Platform
This layer contains a structured collection of rules for the data, decision-making criteria, best practices, corporate standards, event patterns, and so on. The knowledge platform monitors processes, flows, and decision making. It ensures that these comply not only with corporate policy and best practices, but also with government legislation. Geoscientists can implement first principles and engineering concepts, enabling the foundation to garner a rich dataset ideal for hybrid solutions that marry data-driven models with an expert system based on interpretation and deterministic workflows. The essence of this layer is a pool of captured and formalized knowledge, accessible at any time by the organization. With the rigorous introduction of the two layers from above, the organization can preclude tedious and ineffective processes that result in obtuse and muddled data handling tasks. The foundation of business processes from this point on becomes accurate information and formalized knowledge.
Collaboration and Analytical Framework
The collaboration and analytical framework uses the information and knowledge taken from the first two layers to prepare and automate decisions. This enables your organization to get a full understanding of the past and present, as well as a glimpse into the future, by building potential future scenarios and then analyzing and ranking them. This platform includes analytical elements with capabilities such as prediction, forecasting, and optimization. It forms the decision point in the process, providing the environment necessary to integrate and link various disparate processes, such as communications and directives.
In addition, this layer provides the ability to transform decision making throughout all hierarchies and disciplines in an organization into an efficient practice that involves the full alignment of the participants.
Performance Platform
The final platform of the four-layer infrastructure is responsible for setting up the strategic framework, planning the performance metrics in line with the business strategy and then combining the decisions from the previous platforms into plans. The execution of these plans can then be monitored for their progress against the full metrics setup, which can then be established for amendment and improvement.
This layer makes sure that the strategy is consistent, the E&P professionals and management are aligned, and all the operational activities are captured and focused on the targets and improvement efforts. It also ensures that the business plan and the operations continuously adapt to business environment changes.
The good news is this challenge can be overcome by treating data as a critical asset and deploying the right strategies and technologies that enable organizations to make sound business decisions based on trusted data. There is an evolving realization that oil and gas companies require a dedicated suite of software to support an information management infrastructure that offers geoscientists a conducive playpen to aggregate and integrate key data sources.
A focus on enterprise data management can provide unprecedented insights into E&P efficiencies and deficiencies while identifying potential CAPEX and OPEX cost reduction, thereby mitigating risks and maximizing performance.
Robust data leads to improved decision making, which, ultimately, leads to enhanced asset portfolio.
ARRAY OF DATA REPOSITORIES
Let us distinguish between a data warehouse, a data mart, and an analytical database. Oil and gas companies must clarify the definitions for each of these repositories, owing to their inherent variability and appropriateness to support advanced analytics. These data repositories have fundamentally different purposes:
- An enterprise data warehouse is an all-encompassing platform that manages data for multiple geoscientific departments and their autonomous functions. It is designed to be the single version of the truth, and a supplementary historian of enterprise performance.
- Data marts tend to be more narrowly defined, usually addressing a single subject area, such as seismic data or well log data.
- “An analytical database is kind of a fuzzy term,” said Russom.3 “It can mean a lot of things to different people. As a collection of analytical data, it may be physically located within an enterprise data warehouse. For some, it may look like a data mart. More and more, I’ve seen people put together a separate database outside of their data warehouse or data marts that contains analytical data specifically for analytic purposes. Wherever it resides physically, an analytical database is not seen as a permanent record of enterprise performance but rather a test bed for exploring change and opportunity.”
The three types of data repositories are optimized by different processes. “For instance, a lot of enterprise data warehouses are optimized so you can feed data into them at different update speeds and make high-speed queries against that data,” said Russom.
Data marts have very similar attributes, except smaller. In contrast, analytical databases are optimized for fairly unpredictable data sets, because the data are not nearly as stable as in a data warehouse or mart. When you’re trying to figure out business change, the data will change quite a bit.
Online analytic processing (OLAP) enables multidimensional queries by caching data in cubes. “As with reporting, this kind of multidimensional data are carefully cleansed and carefully documented,” said Russom. “You would put a lot of effort into metadata, maybe master data. There is transformation through ETL processes and so forth. All the practices that we associate with data preparation for a data warehouse are appropriate for online analytic processing.”
With query-based analytics, users often want to begin the analysis very quickly in response to a sudden change in the business environment. The analysis can require large data volumes, often multiple terabytes of raw operational data. The urgency of the analysis precludes opportunities for substantial data transformation, cleansing, and modeling.
“Not that you would want to,” said Russom.
Too much prep at the beginning of an analytical data project may lose some of the “data nuggets” that fuel the discovery. Whether it’s query-based or predictive, or some variation of those, you need the detailed source data pretty much intact to do your first pass of discovery. Later you may come back and start transforming the data.
“Some predictive tools or algorithms need specific data structures,” said Russom.
A lot of these tools run fast on a flat record structure, so if you have data hierarchies, these may need to be flattened. If you have data strewn across multiple tables, maybe related through keys, you might want to combine these into single but very wide records. The analytic tool may prefer range fields, so certain data values may need to be transformed into ranges in a process called binning. Some algorithms demand a flat file (as opposed to in-database processing), so generating a very large flat file is core to data preparation.
Analytic discovery depends on data nuggets found in raw source data. “Both query-based and predictive analytics depend on large amounts of raw source data,” said Russom. “It’s not just the fact that it is a large sample size, but it’s also fairly raw data, which provides details that are essential for discovering facts, relationships, clusters and anomalies.”
Analytical data can also be unstructured. Text mining or text analytic tools often feed data into predictive analytics, data mining tools, and statistical tools. Text mining provides a rich additional source of data for the predictive analytics workflows. If you capitalize on unstructured data resources, such as daily drilling reports, you can have more accurate predictive models.
Data from an enterprise data warehouse can be analytical as well. “Although advanced analytics tend to need new data sets, they can also tap the content of a data warehouse,” said Russom. “Data from the warehouse provides a historic context for newly discovered facts, plus additional dimensions and other useful details. The insights of analytics should be incorporated into the historic record of the data warehouse.”
A common misconception is that preparing data for analytics is the same as preparing them for data warehousing. But, as mentioned earlier, there are perils to “improving” analytic data too much, too soon in the process.
“Often you want to do discovery with pretty raw source data,” Russom said. “Standardizing and cleansing the data too much or too soon can inhibit the insights drawn from it.” For example, permeability anisotropy is often revealed in nonstandard or outlier data, so you do not want to strip or standardize the data too heavily, the way we would for data warehousing, because that could mask the very problems you are striving to resolve.
What about remodeling data to speed up queries and enable multidimensional views? “Not advisable for advanced analytics,” said Russom.
You may also lose data details and limit the scope of queries. It’s the kind of thing you would do eventually, but not at the start of an analytic project. Do only what is required for the analytic tools, such as flattening and binning.
You want to get analysts and data stewards working with the analytic data quickly, when the data is still pretty raw. Then you come back later and start cleaning up the data and maybe remodeling it. You might do similar data preparation work as for data warehousing, but at a later phase, after analysts have worked with the data for a while.
Most organizations have automated processes around their enterprise data warehouse and data marts, but data preparation for analytics has traditionally been done in a very ad-hoc manner, which is inefficient, inconsistent, and unsustainable. As the enterprise becomes more reliant on advanced analytics, it needs to ensure that best practices are applied consistently across analytical applications and in operationalizing the results.
A structured framework for automating data preparation for analytics is critical to enable organizations to:
- Document and automate the analytical data preparation processes, making them more consistent and repeatable, with traceable metadata.
- Incorporate best practices from the organization’s data management experts into a shared, standardized, and reusable best practice.
- Schedule the formerly ad-hoc data preparation stages for analytics, such as incremental updates, loading of transactional data, or more frequent refresh of OLAP cube data.
- Automate the process of pushing the results of analytics into operations, either directly into databases or to support fast-acting decisions in the organization.
- Flag suspect data, missing data, and outliers (as determined by predefined range or category variables), without necessarily changing the data before analysis.
- Proactively run “triage” models in the central repository as appropriate, such as customer segmentation, customer lifetime value, and risk scoring, so analysts can begin discovery work more quickly.
- Set up live alerts around analytic data governance that are consistent across the enterprise, such as, “If the well’s average high-risk BHP changes by x or y, deliver an alert.”
Operational excellence begins with understanding your data. You need to capture, store, contextualize, and visualize real-time information and make it available to the right people at the right time to enable the right decisions.
The oil and gas industry has a voracious appetite for data. Exploration and production value chains acquire terabytes of seismic data that are processed to produce new projects, creating exponential growth of information. Furthermore, these data are increasingly acquired in three or four dimensions, creating some of the most challenging archiving and backup data management scenarios of any industry.
With the rise of the digital oilfield, the oil and gas industry is gathering more data, more often, at every stage of the business lifecycle. Your company is investing millions of dollars to gather, analyze, and interpret that data without any assurance that the data are complete, correct, and contextual.
The lack of a single view of upstream data leads to:
- Delayed projects
- Underutilized production capacity
- Missed revenue opportunities
- Runaway costs
- Regulatory noncompliance
STRUCTURED DATA AND UNSTRUCTURED DATA
Data is widely available; what is scarce is the ability to extract wisdom from it.
Hal Varian, Chief Economist, Google
One way to accelerate decision making is to link structured and unstructured data together to enhance pattern recognition that can improve the optimization of oil and gas operations. For example, real-time data inputs can be compared against patterns mined from a historical database through base analytics or enhanced visualization techniques. Companies are able to identify issues and root causes in massive volumes of information, and then identify and implement appropriate actions that will treat the cause upon detecting the pattern, rather than waiting for a crisis to trigger action.
The challenge in E&P is to provide quick, seamless, and automated access to structured and unstructured seismic data for geophysical interpretation. This linkage enables geotechnical professionals to understand the context in which seismic surveys were conducted, and it makes supplementary information available in real-time to support the decision-making process. Additional benefits are gained when well master data are integrated with unstructured information. Correlating seismic and well production data is critical to enable unified production and profitability analysis.
Integrating and potentially mobilizing this information helps oil and gas firms optimize processes by providing collaborative information and integrating seismic data management with unstructured information. This supports data preservation, data quality, data accessibility, and real-time process refresh.
O&G companies can leverage information gathered at the development site to enhance results obtained during the drilling process. Using complex algorithms that correlate multiple information sources, engineers can identify signatures and patterns associated with undesirable results. Information is then fed back into automated or manual control processes to either capture potential events in real-time or address needed process changes to avoid suboptimal results.
We can identify appropriate signatures through the use of algorithms to analyze information from multiple control systems and data historians. These algorithms are then implemented in appropriate real-time control systems to act automatically, or support manual processes for intervention or process change.
It is feasible to optimize results such as uptime with condition-based maintenance techniques involving the linkage and analysis of real-time operating data with asset maintenance and inspection data. The increased use of mobility solutions, whether based on common mobile devices or sophisticated machine-to-machine systems, provides another set of potential data streams for either analysis or condition-based monitoring activities.
In support of this, the trend toward an integrated operations model that provides common, standardized data for improved processes and enhancing the ability to detect, analyze, and show trends in operational data aberrations helps to significantly facilitate optimizing uptime. For example, by leveraging a predictive/preventative model, oil and gas companies can better determine if a piece of equipment is degrading or requires inspection or maintenance, or should have its primary duty changed based on fatigue or power cycles.
The increased web of local, state, and federal regulations that change and mature with increasing activity of unconventional assets has increased compliance requirements across the oil and gas lifecycle. Documentation and the ability to show traceability across structured and unstructured information help demonstrate what activity happened and when, so it is clear when the energy firm has completed the steps necessary to avoid incidents, mitigate impacts, resolve problems, and prevent similar incidents in the future.
EXTRACTION, TRANSFORMATION, AND LOADING PROCESSES
Loading data warehouses and data marts within allotted time windows, quickly building analytical marts for special projects, and creating extract files for reporting and analysis applications are tasks IT organizations face each day. It is necessary to build logical process workflows, quickly identify the input and output data stores, and create business rules in metadata. This enables the rapid generation of data warehouses, data marts, and data streams. Users can also choose to have many transformations and processes take place inside a connected database, data warehouse, or storage system. This is referred to as ETL, pushdown, or in-database processing, and can substantially speed up overall processing times by reducing unnecessary data movement.
Major Tasks in Data Preparation
The workflows that underpin data processing in preparation for stochastic analytical methodologies fall into five major categories:
- Data cleansing to impute missing values, smooth noisy data, identify and remove outliers, and resolve inconsistencies
- Data integration of multiple datasets be they cubes, flat files, or temporal and spatial in nature
- Data transformation to normalize and aggregate across siloes E&P engineering disciplines
- Data reduction to obtain a minimal representation in dimension and volume as well as retain consistent variance and entropy for similar analytical results
- Data discretization to apply data reduction techniques for numerical data types
Some of the important steps that define data cleansing necessitate focus on data acquisition with an emphasis on the metadata. What are metadata? They are essentially data that describe data. The term carries some ambiguity since there are two fundamental types or variations on a theme. Structural metadata concerns the design and specification of data structures and is more succinctly coined as “data about the containers of data,” whereas descriptive metadata is more about individual instances of application data (i.e., data content). Imputation is the computation of replacement values for missing input values. This can be attained by adopting the attribute mean for all samples belonging to the same class. The most probable value could be induced by adopting an inference-based approach such as a Bayesian formula or decision tree. It is also critical to unify data formats such as dates and convert nominal to numeric type to be conducive with soft computing methodologies such as artificial neural networks, regression, and nearest neighbor. Once outliers are identified, it is an interpretive process to determine whether such values are to be removed or integrated into the sample data under study. Having de-noised the data by applying smoothing algorithms or filtering techniques, we can attain correct, consistent, and robust data in preparation for analytical workflows.
Data integration of multiple datasets from different databases or data marts could result in redundancy as the same attribute may have different names. Correlation workflows can aid in reducing such attribute bloat.
Data transformation can also remove noise inherent in the data as well as perform summarization and data cube construction and development of a concept hierarchy. Normalization strives to ensure that attributes when compared across different temporal or spatial axes retain valid and plausible insight and trends. Perhaps production logging tool (PLT) data are collated at different times across a well portfolio. It is essential to generate a new attribute such as QgN that represents cumulative gas production measured N days after the PLT data were initiated in each well, ensuring a comparative parameter across all wells in the study.
Min-Max Normalization:
There are several data reduction techniques such as cube aggregation, dimensionality reduction of the input space, numerosity reduction and discretization, and concept hierarchy generation. Dimensionality reduction encompasses feature selection whereby a minimum set of features are ascertained such that the probability distribution of different classes given the values for those features is as close as possible to the original distribution. There are also heuristic methods such as stepwise forward selection and stepwise backward elimination as well as decision-tree induction.
BIG DATA BIG ANALYTICS
Data-driven analytical workflows incorporate “hard data” referred to as factual or measured field data such as well logs (gamma ray, density, sonic, etc.), fluid type, and production rates, as well as “soft data” that refer to interpreted or estimated parameters.
In exploration, the seismic datasets being generated can result in a plethora of soft data by way of seismic attributes.
- Volume
- Wide azimuth offshore seismic data acquisition
- Velocity
- Real-time streaming data from drill-heads and equipment sensors
- Variety
- Structured, unstructured, and semi-structured data
- Value
- Increased speed to first oil
- Maximized production
- Reduced risk and costs
The petroleum industry is no stranger to large volumes of data. Operating in arguably the original sensor-based industry, oil and gas companies have for decades used tens of thousands of data-collecting sensors installed in subsurface wells and surface facilities to provide continuous, real-time monitoring of assets and environmental conditions. These companies closely monitor the performance of their operational assets. They also conduct advanced physics-based modeling and simulation to support operational and business analytics and optimization.
Organizations are capturing a greater volume and variety of data, at a faster velocity, than ever before. In addition to sensor data, these Big Data include large volumes of semi-structured and unstructured data, ranging from high-frequency drilling and production measurements to daily, written operations logs that quickly add terabytes of new data. They also contain a massive collection of business data, such as internal financial results, and news on energy and petroleum competitors bidding on leases and making major capital investments. Those organizations accumulate petabytes of such information with the goal of using it to improve performance and increase their competitive edge.
With the right technology solutions, these companies can move beyond traditional real-time monitoring to more agile real-time prediction. By rapidly analyzing incoming technical and business data and applying that information to complex models in real-time, they can generate tactical insights that help increase drilling and production performance while preventing problems. By quickly searching and analyzing a large volume and variety of competitive intelligence, such as news about mergers, acquisitions, or new investments, they can substantially improve strategic decision making.
Big Data can help companies develop the digital oilfield, integrated operations that unite information technology (IT) with operational technology (OT)4 to improve decision making and enhance operational and business performance as depicted in Figure 2.7. Adding empirical analytics to existing physics-based analytics can take the industry to a new level of business improvement.

Figure 2.7 Information and Operational Technology Comparison
To capitalize on these opportunities, many oil and gas companies will need to adopt new IT solutions designed to address the specific challenges of Big Data. They need technology that can collect, manage, and analyze large and rapidly growing volumes of data, such as the petabytes of production data generated by oilfield sensors. In addition, they need solutions that can analyze a wide variety of data types, including numerical data streaming in from drilling-rig sensors and unstructured data from logs, microseismic, and other sources. New solutions must help integrate business data with technical data, bringing together multiple IT and OT systems. They must enable searches of Big Data repositories to help oil and gas companies quickly identify and visualize information among vast quantities of structured and unstructured data, and deliver results to support time-sensitive processes.
STANDARD DATA SOURCES
There are several crucial standards bodies across the E&P industry that identify areas of intersection so as to preclude duplicity or conflict when ascertaining O&G standards in data.
Energistics is a global consortium that enables the development, management, and adoption of data exchange standards for the upstream O&G industry. There is a focus on asset and data management as well as work processes. Their standards portfolio covers the following areas:
- WITSML
- PRODML
- RESQML
These focal points address the transfer of data and hence knowledge across the geosciences, drilling, completions, interventions, production, and reservoir organizations.
PPDM is the Professional Petroleum Data Management association that provides a data model covering multiple subject areas that could essentially act as an MDM. The body strives to evangelize the use of faceted taxonomies to help control the evolving Big Data waves across the disparate engineering silos within E&P.
PODS is an acronym for Pipeline Open Data Standard, providing a scalable database architecture to integrate critical records and analysis data with geospatial location for each component of a pipeline system.
PCA stands for POSC Caesar Association and under its auspices develops open specifications to enable the interoperability of data and software. As a body it participates in research and joint industry projects to develop reference data and semantic technology.
OPC, OPen Connectivity, is a widely accepted industrial communication standard that enables the exchange of data between multivendor devices and control applications without any proprietary restrictions.
Semantic Data
Semantic data standards exist in the oil and gas industry to enable you to integrate different types of data. The O&G industry is striving to add meaning to the data. In Chapter 10, we delve into text analytics to identify ontology management of the upstream data. Such a management system is an organizational lens on your upstream content, providing interfaces to define the relationships between O&G entities such as wells in a portfolio, reservoirs and fields in an asset, and global basin characterization. We can generate semantic terms that codify engineering subject matter expertise in geology, geophysics, petroleum, and reservoir engineering as well as drilling and completions.
Semantic data relates content stores and informational silos with defined terms to help propagate the value of domain experts. It is essential to emphasize that data-driven analytics that are the core subject matter of this book must be married to first principles or at the very least constrained by the empirical and interpretive methodologies. This approach promotes the now-rapid adoption of hybrid solutions in the upstream where we see the combination of a user-driven expert system and a data-driven knowledge capturing system calibrated with historical data.
CASE STUDY: PRODUCTION DATA QUALITY CONTROL FRAMEWORK
Production data in petroleum engineering is often affected by errors occurring during data acquisition and recording. As interventions in the well alter the natural exponential decay of the production curve, the errors made during the data acquisition and recording are concealed. Automatic data validation techniques can help in cleaning production data.
- Detection of outliers in non-stationary signals
- Detection of sudden changes altering the natural trend of the signal
- Detection of rogue values disrupting signal trend in the light of statistically related variables
Data validation is concerned with finding erroneous data in a time series and, when appropriate, suggesting a plausible alternative value. Data validation can be defined as a systematic process in which data are compared with a set of acceptance rules defining their validity. In petroleum engineering, causes for erroneous data include noise, sensor failures, and data manipulation mistakes.
Outliers are observations numerically distant from the rest of data. Surprisingly there is not a standard method for identifying them. Often data are assumed to comply with a Gaussian distribution and a distance criterion (e.g., deviation from the distribution descriptor determines the outlier condition of a data sample). Oil well production data are a non-stationary process, and thus the naïve approach does not suffice. However, upon looking at a sample neighborhood, stationarity can be assumed. Here we propose a local solution for outlier identification.
Atypical sudden changes deviating from the natural trend of the signal often correspond to noise, or failures in data recording. Noise in the context of oil well production can often be associated to well interventions. There already exist a number of approaches for the detection of sudden changes as, for instance, the use of the Laplacian or a Gaussian operator. Here we use Haar wavelets for the detection of sudden changes in the signal, proposing a variant from an existing approach developed for neuroimaging data.
The final validation problem addressed here is the detection of suspicious values that may be in range and agree with the signal trend but that contradict the trend in statistically dependent variables. In order to catch these rogue values we recommend an approach based on Bayesian networks. The use of a Bayesian network for validating data by related variables capitalizes on the following idea: The trend of statistically related variables must grossly follow each other. When this premise is violated, the observation is likely to be a rogue value.
Outliers
Perhaps the easiest form of outlier detection consists of imposing a valid data range within which variable data are allowed, and labeling values outside the range as outliers. Often this range is established from the data distribution as defined by equations 1 and 2:
where m is the distribution median and σm is the deviation from the median.
If stationarity does not hold, the above solution is not satisfactory. Notwithstanding, upon accepting that the decay of the oil well production curve is slow, local stationarity holds and the above solution can be reused. A local outlier detection can be constructed upon windowing the data. The basic idea is then to shift the window along the data and compute the lower and upper limits of the data range only for the visible data within the window.
Abrupt Change
The wavelet transform decomposes a signal in its time-scale components re-expressing the original function in terms of the wavelet family basis. The continuous wavelet transform (CWT) of a signal x(t) is defined by equation 3.
- where a and b are the scale and shift parameters respectively, and ψ(t) is the wavelet function used for the decomposition of x(t).
Among the wavelets functions families, Haar wavelets are especially suitable for the detection of discontinuities.
For each time-scale pair represented by (a, b), a wavelet coefficient grasps the similarity of the signal x(t) and a stretched and shifted version of ψ(t). These coefficients discriminate sudden changes in the signal. Application of the median filter to the coefficients independently at each scale endorses the characteristics of the sudden changes in addition to minimizing the influence of white noise. Determining the limit between acceptable and unacceptable changes, a threshold T is imposed in the matrix of coefficients. Thus we set the threshold automatically using the universal threshold in accordance with equation 4:
where σ is the absolute deviation over the median and n is the number of coefficients.
BEST PRACTICES
It is imperative to adopt a methodology that supports the entire data integration lifecycle through an integrated phased approach (Figure 2.8). These phases include data profiling, data quality, data integration, data enrichment, and data monitoring. The methodology may be implemented as an ongoing process to control the quality of information being loaded into target information systems.

Figure 2.8 Data Integration Management Lifecycle
Additionally, this methodology fits into an overarching three-phase business methodology approach: analyze, improve, and control. The first phase of this methodology focuses solely on data discovery or assessment to accurately identify the consistency, exactness, and validity of the source data. During this phase, data quality issues are identified and documented, and business rules are created to correct the issues. The second phase, improve, supports the flexible correction of the identified data quality issues and, if appropriate, the improvement of core business processes. The last phase, control, supports ongoing monitoring and trending of source data to ensure information accuracy and to automatically detect and alert users if data violate defined business rules or corporate data quality standards.
Data Profiling
The first phase of the methodology, data profiling, includes data discovery and auditing activities that support complete assessment of the validity, accuracy, and completeness of the source data. The profiling functions include profiling the actual record value and its metadata information. Too many organizations embark on data integration projects without first discovering the quality levels of source data. Undiscovered data quality issues typically show up late in the integration lifecycle and often cause project overruns, delays, and potentially complete project failure. By including data profiling at the beginning of the integration lifecycle, users can:
- Immediately identify if the data will fit the business purpose.
- Accurately plan the integration strategy by accounting for all data anomalies up front.
- Successfully integrate the source data using an automated data quality process.
Data Quality
The second phase, data quality, supports the correction of all quality issues discovered during the profiling phase. This often includes eliminating semantic differences found within the source data, breaking apart multi-value fields into discrete elements, moving information into the appropriate location, normalizing patterns, and so on.
For example, during the profiling phase, a data quality issue may be uncovered, such as multiple versions of the same basin name.
This type of advanced analysis is difficult to discover using manual processes, and building the rules to correct the nonstandard versions is extremely time consuming and requires a very data-dependent process. Other issues such as well names or reservoir nomenclature in the wrong field, multiple versions of hydraulic fracture strategy descriptions, and missing geomechanical information can be immediately corrected using out-of-the-box data standardization, parsing, identification, and validation routines.
A proposed data quality solution to furnish aggregated and robust data in an upstream E&P environment must fulfill some rudimentary objectives:
- Interface seamlessly with all identified data sources across the E&P.
- Access engines to facilitate both real-time and historical data transfer.
- Automate and semi-automate workflows for exploratory data analysis:
- Identify outliers.
- Perform transformations.
- Impute missing data.
- Cleanse data.
- Surface hidden patterns.
- Identify trends and correlations.
- Perform factor analysis and/or principal component analysis to reduce input space.
- Generate metadata.
- Create data quality assessment reports:
- Highlight data quality issues.
- Audit trail for data value changes.
- Update or synchronize values based on a priori business rules.
The 80/20 rule5 (Figure 2.9) means that in anything a few (20%) are vital and many (80%) are trivial. In Pareto’s case it meant 20 percent of the people owned 80 percent of the wealth. After Pareto made his observation and created his formula, many others observed similar phenomena in their own areas of expertise. We can ostensibly apply this principle to time consumed when resolving a business problem in E&P—exhausting 80 percent of our time in data management and preparation prior to actually addressing the problem via a suite of invariably deterministic workflows or visual interpretations.

Figure 2.9 Pareto’s Principle: The 80/20 Rule
The data management solution must reverse this paradigm and ensure that 80 percent of the geoscientists’ time is consumed by interpreting the data and marrying first principles with stochastic and data-driven methodologies.
Data Integration
The third phase, data integration, includes processes for automatically identifying related information within a single data source, or across multiple, disparate data sources. Once these records are identified, the integration phase calls for the records to be either linked or consolidated into one single “best” record. Data integration strategies may vary from simple duplicate detection and removal, to advanced entity resolution in both real-time and batch environments. During this phase, the organization begins to build a unified view of its assets, reservoirs, wells strategies, and tactics or any other type of entity found within source systems.
Data Enrichment
The fourth phase, data enrichment, encompasses techniques for enhancing the value of source data using other sources of reference information. By enriching the source information, organizations can populate incomplete fields, as well as append valuable information that will better identify well attributes. Enrichment may include well nomenclature enhancement, geocode enhancement, asset code updates, basin sedimentology information, and other pieces of data that add value to existing information.
Data Monitoring
The final phase of the methodology, data monitoring, supports ongoing data quality analysis and tracking/trending of data quality over time. This phase of the methodology extends data quality processes beyond traditional project-based application and ensures the accuracy and reliability of information sources over time. Monitoring may include simple data profiling trend analysis over time, or it may include specific business rules analysis. By configuring rules that define acceptable data quality values, monitoring can be used to automatically identify records that violate quality standards and alert users of the violations. Monitoring allows the team to take action well before the data anomaly affects business decisions, processes, or projects.
Understanding and leveraging data in the upstream business segment enables companies to remain competitive throughout planning, exploration, delineation, and field development. The downstream segment depends on data to maximize production with regard to maintenance and forecasting. Fortunately, oil and gas companies have access to an abundance of valuable data in both upstream and downstream operations. Unfortunately, this information comes in various and increasingly complex forms, making it a challenge for energy companies to collect, interpret, and leverage the disparate data.
It is of paramount importance to integrate common and disparate datasets to deliver the right information at the appropriate time to the correct decision maker. These capabilities help companies act on large volumes of data, transforming decision making from reactive to proactive and optimizing all phases of exploration, development, and production.
Benefits:
- Reducing time to first oil
- Increasing the productivity of assets across their lifecycles
- Applying advanced business intelligence and embedded analytics
- Ensuring the right information is available to the workforce at the right time
- Improving planning and forecasting results
Figure 2.10 represents a maturity matrix that encapsulates all the requisite steps in data management, quantification of uncertainty in the data, and risk assessment resulting from analytical workflows and methodologies based on data stored across upstream repositories.
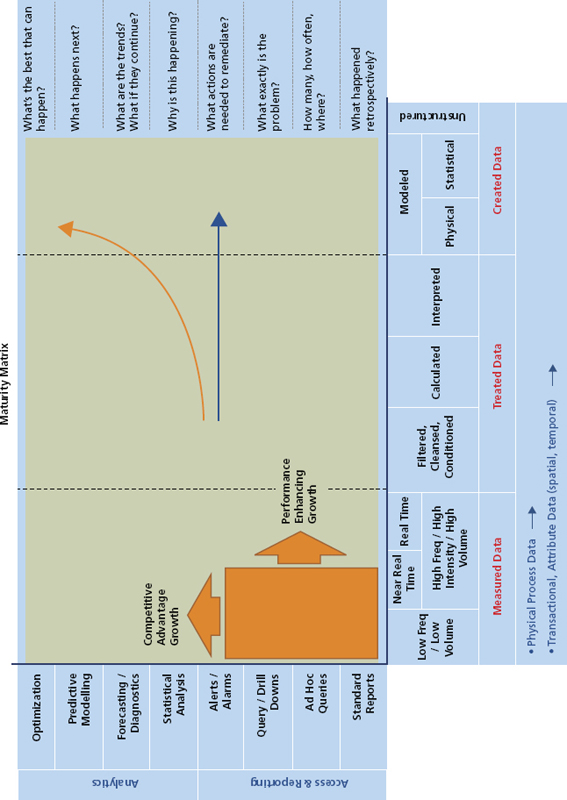
Figure 2.10 Data Converted from Their Raw State to Garner Knowledge