
Gaze-Dependent Tone Mapping for HDR Video
R. Mantiuk West Pomeranian University of Technology, Szczecin, Poland
Abstract
The human visual system constantly adapts to different luminance levels when viewing natural scenes. We present a model of the visual adaptation, which supports displaying the high dynamic range content on the low dynamic range displays. In this solution, an eye tracker captures the location of the observer’s gaze. Temporary adaptation luminance is then determined as the impact of the light area surrounding the gaze point. Finally, the high dynamic range video frame is tone mapped and displayed on the screen in real time. We use a model of local adaptation, which predicts how the adaptation signal is integrated in the retina, including both time-course and spacial extent of the visual adaptation. The applied tone mapping technique uses a global compression curve, the shape of which is adapted to the local luminance value. This approach mimics a natural phenomenon of the visual adaptation occurring in human eyes.
Keywords
Gaze-dependent tone mapping; Eye tracking; Adaptation luminance; Tone mapping operators; Real-time tone mapping; High dynamic range video
Acknowledgments
This work was partially funded by the Polish National Science Centre (decision number DEC-2013/09/B/ST6/02270).
1 Introduction
The human visual system (HVS) is sensitive to contrast in luminance ranging from a 10−6cd/m2 (objects viewed under illumination from the stars) to 108cd/m2 (objects viewed on a bright sunny day) [1]. However, momentary dynamic range is limited to 4 orders of magnitude. In this range of luminance, a human can see details and at the same time, experiences lower luminance as noise and higher luminance as over-saturated areas. To extend the dynamic range, the HVS has the ability to adapt to changes in the ambient luminance and move the “detailed vision” window along the luminance range of a scene. Interestingly, it mainly adapts to an area covering approximately 2–4 degrees of the viewing angle around the gaze direction [2, 3]. Other areas of the scene, observed not in foveal but in para-foveal, and peripheral regions, have significantly less impact on the adaptation level, although, a human frequently changes gaze direction (even a hundred times per second) and tries to adapt to different regions. As the process of the luminance adaptation is slower than changes of gaze direction, the HVS is permanently in the maladaptation state, in which the adaptation luminance is changing toward a target value, but never reaches this value, because in the meantime, the target is changed.
We dynamically reproduce the process of maladaptation using the scene data stored in high dynamic range (HDR) video. We use an eye tracker to capture the gaze direction of a human observer. Then, we compute the temporal adaptation luminance and use its value to display the HDR image on the low dynamic range (LDR) display. The global tone mapping parameterized by the temporal adaptation can be applied to HDR frames to obtain perceptually correct and plausible tone compression results. For every pixel in the HDR frame, we use the same compression curve which changes over time, following the new values of the adaptation luminance. This technique, maintaining the advantages of the global compression, like lack of video artefacts, halos, or perceptual plausibility of visualization, and simultaneously retains visibility of details in the high dynamic range regions. Advanced local tone mapping algorithms apply different compression curves for every pixel in an HDR image. These techniques preserve visibility of details in the output LDR image, although the excess of details can be distracting for an observer and interpreted as unnatural. The GDTMO technique reveals all the details in the HDR image and at the same time, retains noisy and over-saturated areas at the peripheral region of vision.
We call this approach a gaze-dependent tone mapping operator (GDTMO). This concept was first proposed in Mantiuk and Markowski [4]. In this work, we extend the application from static images to the HDR video. We also introduce a new model of local adaptation proposed in Vangorp et al. [2] and modify the compression curve.
In Section 2 we present an overview of the eye tracking technologies and their limitations related to the computer imaging applications. In Section 3 we explain details of GDTMO and introduce its real time implementation. Section 4 presents results of the tests of this approach and discusses its limitations. We conclude the chapter and suggest directions for further work in the last section.
2 Background
Advanced tone mapping techniques were developed to minimize the deterioration of brightness, contrast, and/or perceptual appearance of the HDR images displayed on the LDR displays (see [1] for comprehensive reviews). However, most of the TMOs assume that an observer adapts to luminance of the individual pixels [5], rather than take into account the temporary adaptation to luminance caused by changes of the view direction [6]. This “nonperceptual” approach together with the local modification of the tone curve causes the unnatural appearance of the HDR content after the tone compression. We argue that more plausible results can be achieved using the eye tracking.
The devices called video eye trackers [7, 8] employ the pupil-corneal reflection (P-CR) technique [7]. An eye tracker usually consists of an IR camera and an IR light source, which are directed at the eye. The camera captures the image of the eye with the dark circle of the pupil and the bright corneal glint, which is a reflection of the infrared light from the outer surface of the cornea. The pupil follows the gaze direction during eye movement, while the corneal reflection stays in the same position. The relative position between the reflection and the center of the pupil is used to estimate the gaze direction.
Eye trackers capture two types of eye movements, saccades and smooth pursuits [9]. A smooth pursuit is active when eyes track a moving target and are capable of matching its velocity. A saccade represents a rapid eye movement used to reposition the fovea to a new location, which lasts from 10 to 100 ms. However, the main goal of the eye tracking is to estimate a single location an observer intends to look at for a longer time. This process is known as a visual fixation. A point of fixation can be estimated, for example, as a location where saccades remain stable for a 200–400 ms on the most significant areas of an image (called region-of-interest, ROI) [10].
The accuracy of eye trackers is defined as the average distance between the real stimuli position and the measured gaze position [9]. A typical video eye tracker is capable of estimating the gaze point on a display screen with accuracy close to 1 degree of the viewing angle (a circular region of roughly 80 pixels in diameter observed on a 22-in. display of 1960 × 1050 pixel resolution from a 60-cm distance). These are rather mediocre results, which makes the estimation of the fixation point challenging. Moreover, the accuracy is prone to higher temporal errors, even when using the state-of-the-art fixation techniques like velocity-threshold identification (I-VT) or dispersion threshold identification (I-DT). More accurate solutions exist, but they require a database of the potential fixation target [11], which is particularly difficult to built for video materials [12].
All these observations suggest that the eye tracker cannot be assumed as a device, which captures exact gaze direction. Rather, it estimates an area of the visual attention. The gaze-dependent tone mapping technique must comply with the eye tracking inaccuracies.
3 Gaze-Dependent Tone Compression
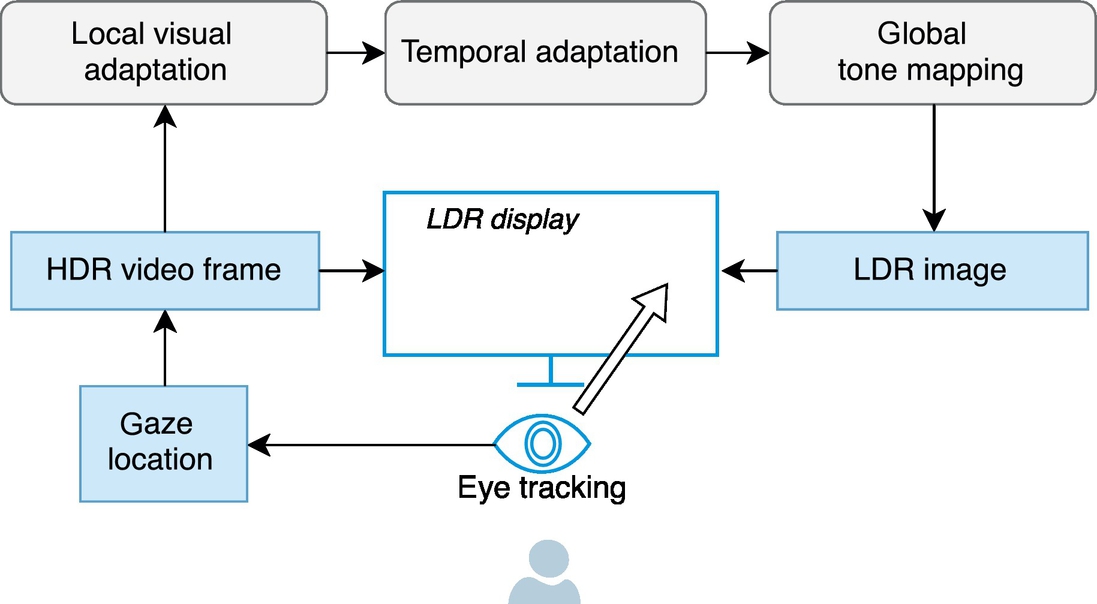
The complete gaze-dependent tone compression system is illustrated in Fig. 1. The observer’s gaze direction is captured by tracker. Then, the luminance of the pixels surrounding the gaze point (taken from a video frame) is used to estimate the adaptation luminance (La) (see Section 3.1). The current La value is used to build a global tone compression curve and compress the HDR content (see Section 3.3). Finally, the output R, G, and B color values are computed, and desaturated using the exponential rule from Mantiuk et al. [13] and the LDR frame is displayed on the screen. This procedure is repeated for consecutive frames in the video. Additionally, La is smoothly modified from the previous to the next frame, using the temporary adaptation rules (see Section 3.2).
3.1 Spacial Extent of Visual Adaptation
To compute the spacial extent of the visual adaptation, we use a model proposed in Vangorp et al. [2]. This model estimates the adaptation luminance, applying the OTF filter in the linear luminance domain and two Gaussian pooling filters in nonlinear domains:
where La denotes the output adaptation luminance, α = 0.654, * is the convolution operator, parameters of the Gaussian kernels g are σ1 = 0.428° and σ2 = 0.0824°. n1 and n2 are nonlinearities that can be approximated with sigmoidal function:
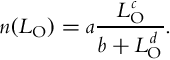
The parameters a, b, c, d were estimated by training the model on empirical data obtained from the perceptual experiments. The authors propose using 3.46, 70.2, 2.38, 2.37 for n1, and 2.19, 66.8, 2.37, 2.37 for n2, respectively. LO is the retinal luminance given by the convolution of a HDR frame luminance with the OTF proposed by Deeley et al. [14] (with assumed pupil diameter 4 mm).
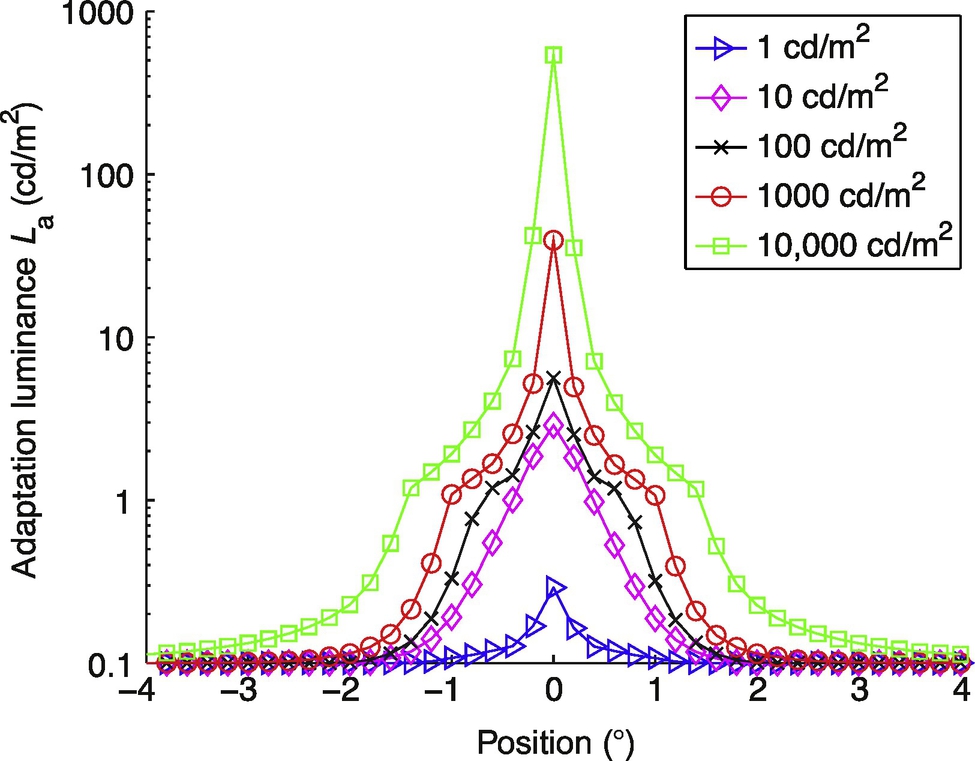
Fig. 2 shows the response of the model to stimuli containing a 0.2° disk displayed at luminance ranging from 1 to 10,000 cd/m2. An example of a local adaptation map computed for the natural image is presented in Fig. 3.
3.2 Temporal Adaptation to Light and Dark
The luminance conditions can change drastically over time. The HVS reacts to such changes through the temporal adaptation process, which differs depending on whether we adapt to light or to darkness, and whether we perceive mainly using rods (during nighttime) or cones (during daytime). In the tone mapping algorithm, the adaptation can be modeled by varying the adaptation luminance value over time. Ferwerda et al. [15] presented a computational model of changes in luminance sensitivity over time using Ward’s scaling tone mapping approach [16]. Pattanaik et al. [17] proposed a complex photoreceptor-based, time-dependent, retinal adaptation mechanisms for both cones and rods.
In GDTMO we implemented a simplified model, which is based on the mentioned approaches, proposed in Krawczyk et al. [18]:
where La and Lanew are the previous (from previous video frame) and new adaptation luminance, respectively, LHDR denotes the luminance of the HDR frame at location of the gaze point, and ![]() . T is the time step between the display of two frames, and the τ constant defines the speed of the adaptation process. This speed is different for cones and rods; to account for this, we use the following interpolation:
. T is the time step between the display of two frames, and the τ constant defines the speed of the adaptation process. This speed is different for cones and rods; to account for this, we use the following interpolation:
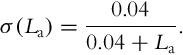
where τrod = 0.4 s, τcone = 0.1 s, and σ models the sensitivity of rods with the following equation:
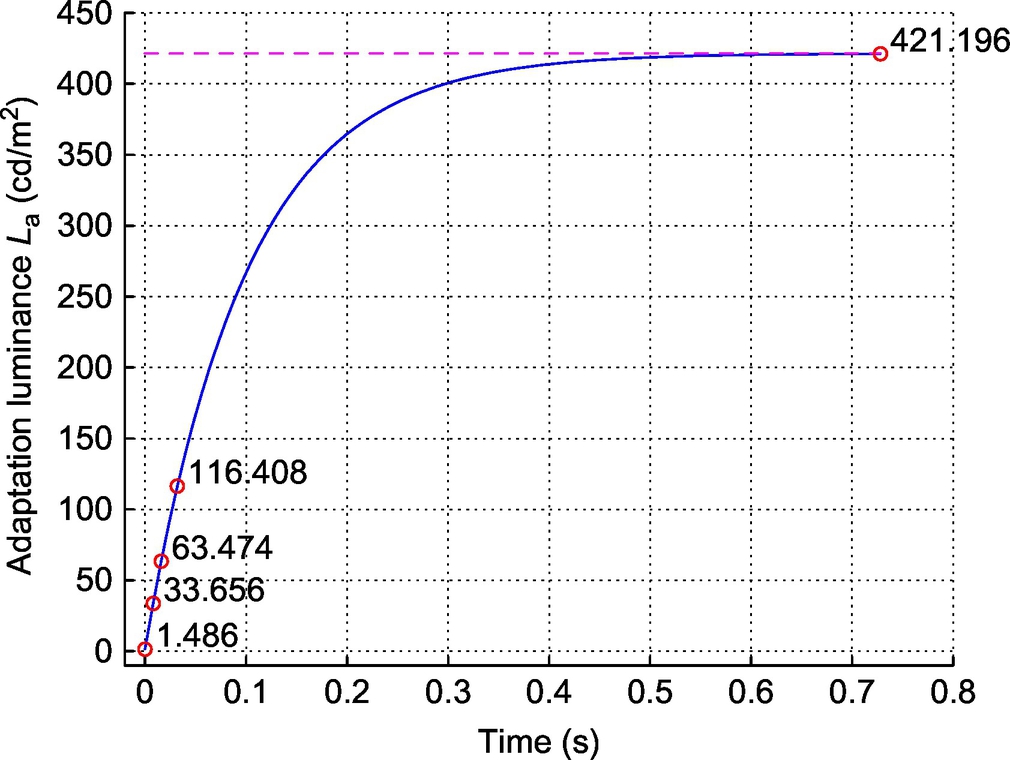
The presented model describes adaptation to light, in which the observer adapted to a dark area turns his eyes to the bright areas of the HDR frame. Fig. 4 shows an example response of the adaptation luminance over time.
We simulate the reverse process—adaptation to the dark as the linear decrease of adaptation luminance. It is slow process, which does not require any nonlinear adaptation model, because this change in practice would be imperceptible to an observer [18]. Furthermore, we artificially accelerate the adaptation by two orders of magnitude. In the real world, the adaptation to dark takes up to tens of minutes and preserving perceptual correctness would be impractical in GDTMO. After quick adaptation to light (about a second), one would wait for more than a minute to see any changes caused by the adaptation to dark.
3.3 Tone Compression
For HDR tone compression we apply the modified Naka-Rushton equation [19], which models the intensity-response function of the distal retinal neurones in HVS:
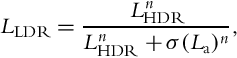
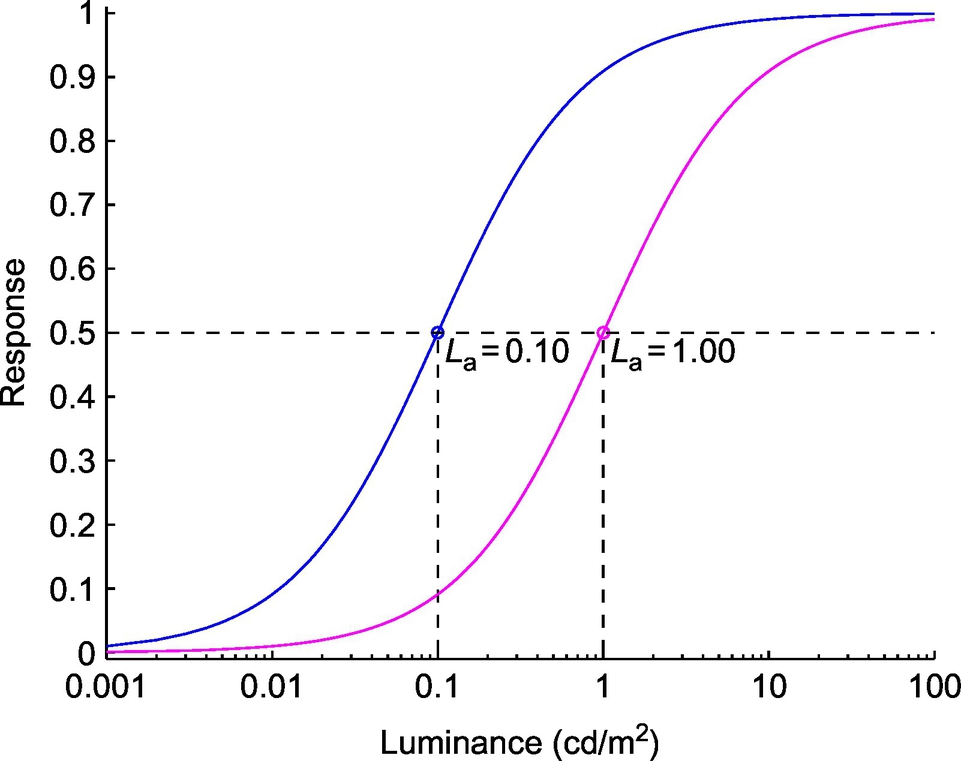
where LLDR denotes the output low dynamic range luminance, LHDR is a luminance of HDR pixels, and n is a constant between 0.7 and 1 (we assumed n = 1 in our implementation). The semisaturation constant σ(La) controls the translation of the response curve along the log-luminance axis, as shown in Fig. 5. Following Vangorp et al. [2], we assumed that this factor is equal to the adaptation luminance: σ(La) = La.
The mechanism of visual adaptation is responsible for constant contrast perception in varying luminance conditions and in a direct way can be adapted for compression of HDR values. Additionally, the Naka-Rushton equation correctly mimics the perceived brightness in a maladaptation state, because it was modeled in an experiment with pulsing stimuli [20]. It is consistent with natural HVS behavior, as we use saccadic movements to scan the whole scene, thus, the stimuli fields are not steady, but pulsed.
4 Testbed and Results
GDTMO was implemented in Matlab using a set of GPU shaders controlled by the Psychtoolbox1 library. The shaders are responsible for tone compression, color desaturation, and final image display. The software was executed on a 2.8-GHz Intel i7 930 CPU equipped with an NVIDIA GeForce 580 GTI 3072MB graphics card. To capture gaze direction, we use 250 Hz P-CR RED250 eye tracker controlled by the proprietary SMI iViewX software (version 2.5) running on a dedicated PC. RED250 eye tracker was mounted under a 22-in. Dell E2210 LCD display with the screen dimensions 47.5 × 30 cm, and the native resolution 1680 × 1050 pixels (60 Hz).
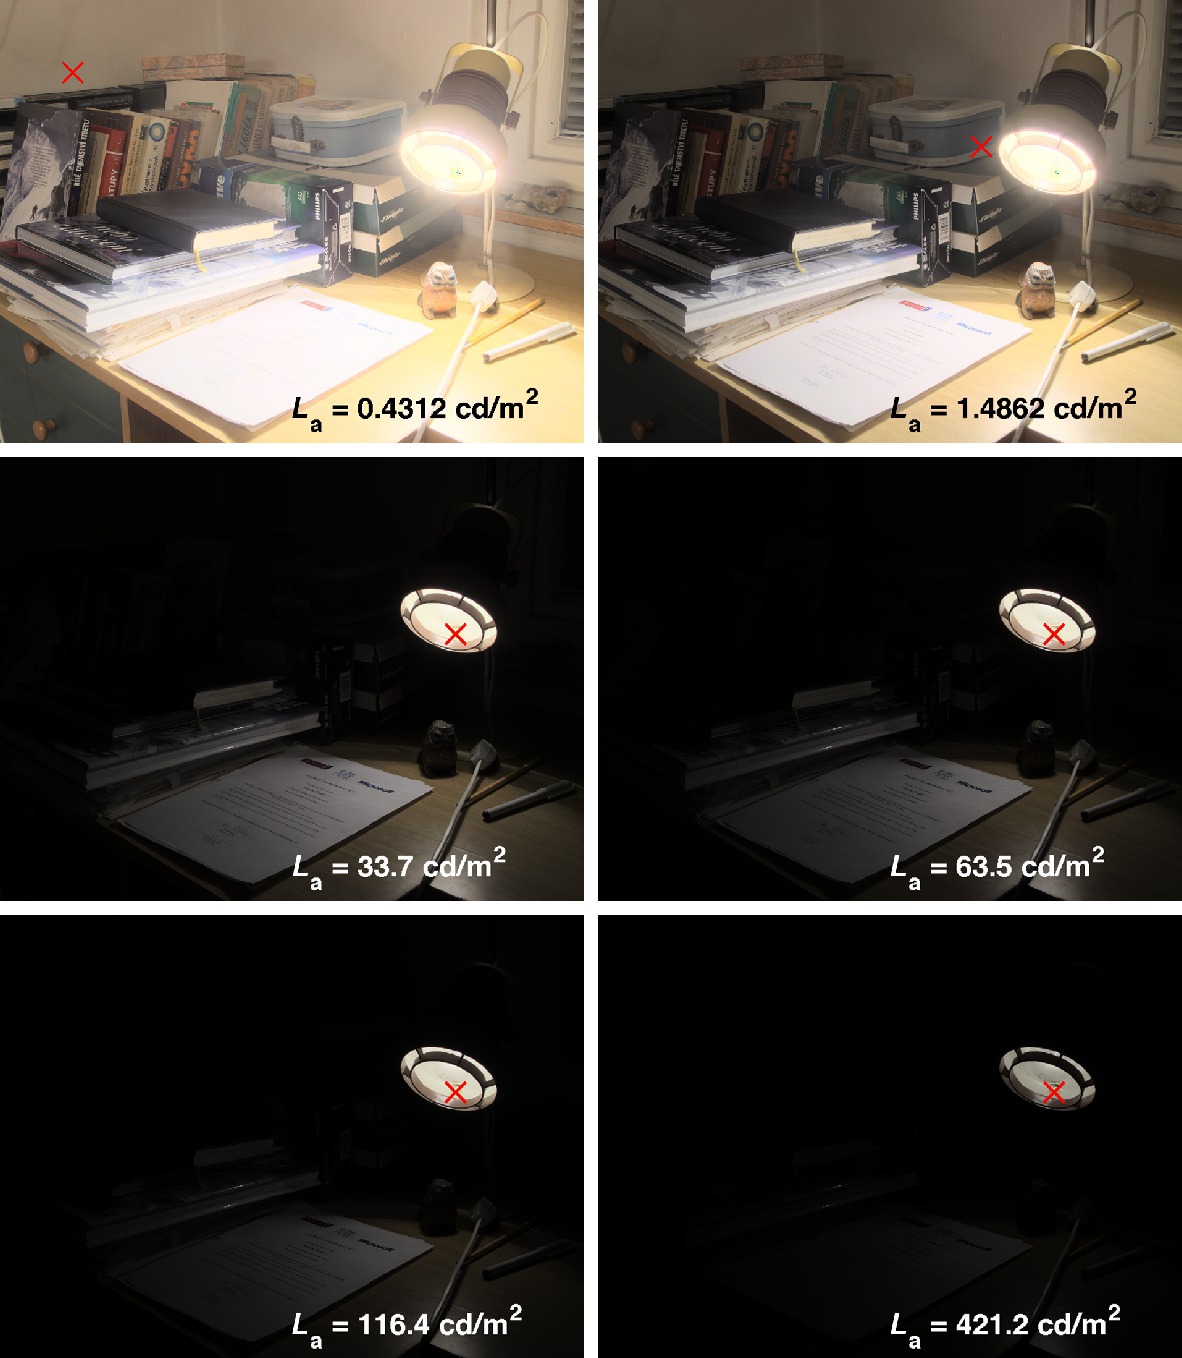
Fig. 6 presents a set of output images generated by GDTMO. An observer changes his/her gaze inducing modification of the target adaptation luminance from 0.43 to 421.2 cd/m2. The temporary adaptation smoothly changes between these values. The presented images correspond to levels of the adaptation luminance depicted as magenta circles in Fig. 4.
5 Conclusions and Future Work
We have shown how information about gaze direction can be used to tone map HDR video in real time. The proposed model is based on local and temporary adaptation to luminance and perceptual compression of the luminance range. The eye tracker is used to capture observers’ gaze location and compute the spatial extend of visual adaptation. The local adaptation value modified over time to account for the maladaptation state is applied by the tone mapping technique to adjust the global compression curve to the current brightness.
In future work, we plan to test the perceptual plausibility of this solution. It would be interesting to evaluate if humans would not experience changes in the displayed video as unnatural, or in other words, if they would accept the time and content-dependent changes of the global luminance level. To perform such an experiment, a fast display offering the wide viewing angle will be the most suitable. We plan to conduct the experiment based on the head-mounted displays, as well as use displays that show more than 120 frames per second.