

114 115
how finance works
Financial accounting
Case study: operating costs
This table breaks down the company’s operating costs in more detail. It is important to
read any notes regarding depreciation and ordinary and extraordinary costs and gains.
Manpower costs 51.7 45.3
Materials and consumables 29.1 26.7
Other operational costs 67.6 63.8
Depreciation 120.3 114.0
Amortization of grants and contributions (0.8) (0.8)
Loss/(gain) on disposals of fixed assets 0.2 (0.5)
268.1 248.5
Operating leases for plant and machinery 1.5 1.2
Research and development 0.1 0.1
Directors’ remuneration 2.1 1.8
Fees paid to the auditor 0.2 0.2
Manpower costs including basic pay
and pensions, overtime payments,
staff training, and maternity leave
Term given to the gradual decline in an
asset’s value, caused by factors such as
wear and tear and market conditions.
Decrease in value over time of
intangible assets or loans
Leasing costs for buildings
and equipment
Research and development carried
out to improve the reliability and
effectiveness of services
Directors’ remuneration including
base salaries and benefits, pensions,
car and health benefits, share options,
and bonuses
Year 2013
£m
Year 2012
£m
Payroll
Salaries and wages paid to staff, temporary
contractors, and indirect labor
Utilities
Water, electricity, and gas; postage and
shipping; transportation
Insurance
Insurance on fixed assets and personal
liability insurance for employees
Phone/internet bills
Cost of telephone, broadband internet,
and mobile devices used by employees
Advertising
Sales and marketing of the company and
its products
Office supplies
Stationery such as pens, paper, and filing
systems, office printers, furniture, lighting
Legal fees and professional services
Accounting and legal fees, payable to
accountants, auditors, and legal advisers
Interest on loans
Interest paid on money borrowed, which
counts as a business expense
Tax
Varying among jurisdictions, this may
include payroll tax and corporation tax
Entertainment
Legitimate costs of business entertaining,
subject to certain criteria being met
TYPICAL EXPENSES
Figures in parentheses represent negative numbers.
Profit or loss on the sale of fixed assets
%
$
$
$
US_114-115_Profit_and_loss.indd 115 21/11/2014 14:24
How it works
The balance sheet essentially
shows what the company owns,
what it owes, and how much is
invested in it. It is based on the
accounting formula, sometimes
called the balance-sheet equation,
which is the basis of double-entry
bookkeeping. This shows the
relationship between assets,
liabilities, and owners’ capital—
what the company owns (assets)
is purchased either through debt
(liability) or investment (capital).
The equation always balances, as
everything a company owns has to
have been bought with its owner’s
funds or through borrowing.
Balance sheet
A balance sheet is a financial statement that shows what a business is
worth at a specific point in time. Its primary purpose is to show assets,
liabilities, and equity (capital), rather than financial results.
Deferred income Income a
company receives for goods
or services that have not yet
been delivered or provided. Until
income is received it is recorded
on a balance sheet as a liability.
NEED TO KNOW
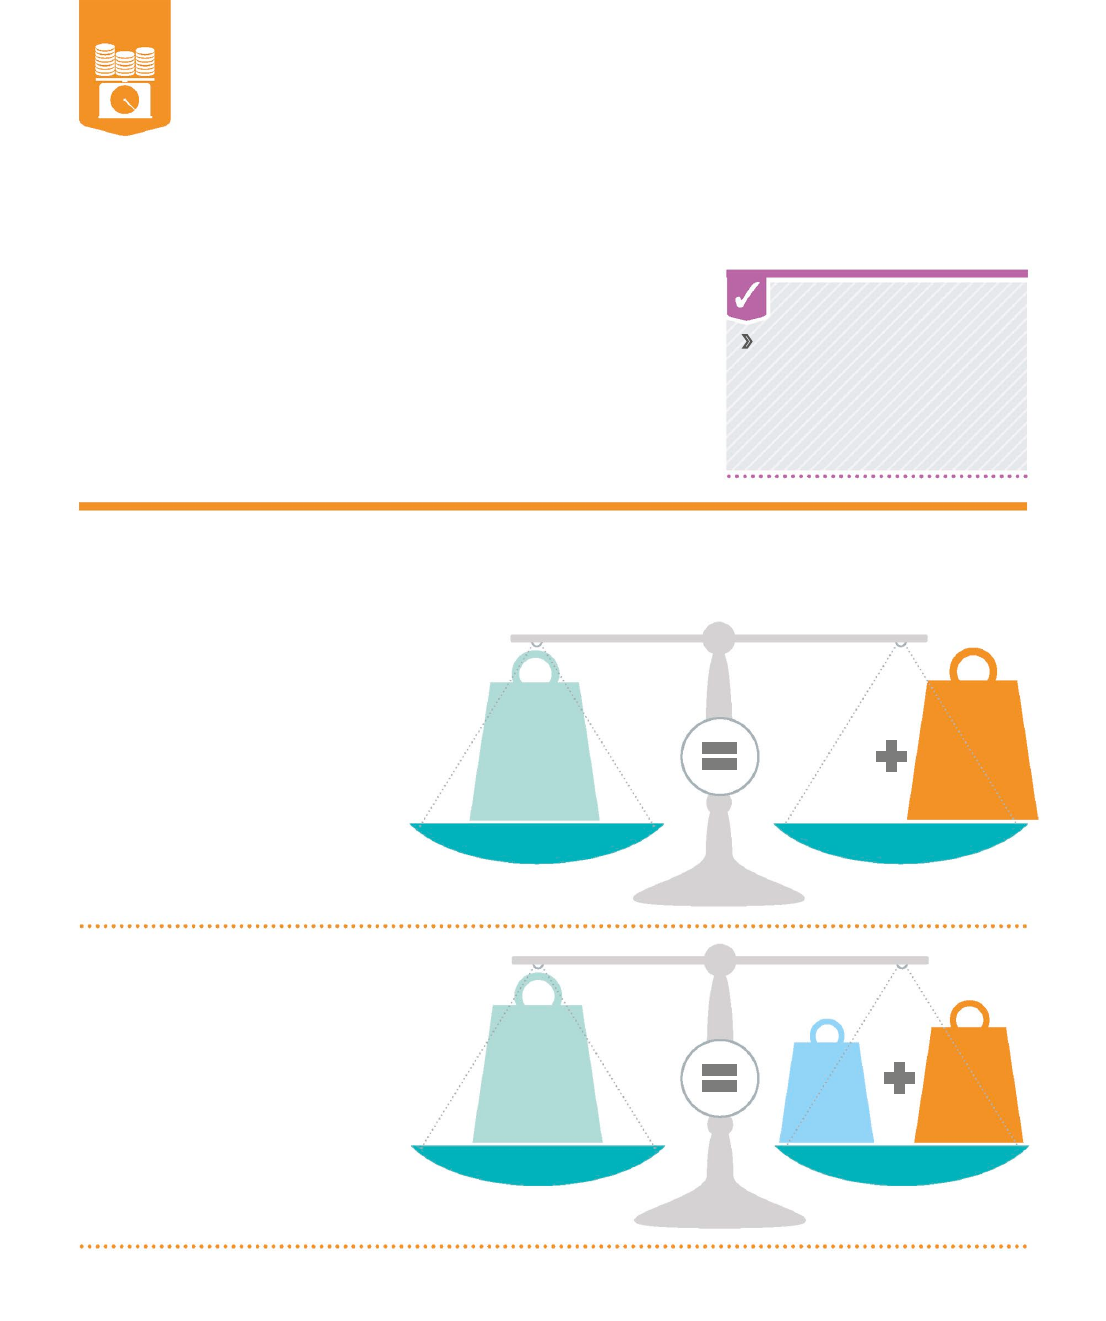
The balance-sheet equation
As the name suggests, the balance sheet must always balance. This is
because everything the business owns (its assets) must be offset against
the equivalent capital (or equity) and liabilities (debt).
ASSETS
$1,000
ASSETS
$1,000
CAPITAL
$600
LIABILITY
$400
LIABILITY
$0
CAPITAL
$1,000
Company incurs $400
in liabilities
After spending $400 on, for example,
an illuminated sign for the storefront,
the owner incurs $400 in liabilities and
so the formula changes. However, since
the sign is worth $400, and the owner
has $600 remaining, the equation
remains balanced—as it always does.
Company has no liabilities
For example, a young business may
have assets of $1,000. It currently has
no liabilities so its capital is equal to
its assets—that is, it is the amount of
equity the owners or shareholders
have invested in the business. Using
the accounting formula, the equation
would look like this:
US_116-119_Balance_sheets.indd 116 15/12/2014 12:57
116 117
HOW FINANCE WORKS
Financial accounting
Case study: balance sheet
This example from Wessex Water, a UK public utility company, shows how a balance
sheet works in practice (at the time, the exchange rate was £1 = $1.58).
Fixed assets
Tangible assets 2,167.1 2,069.2
Investments – –
Current assets
Stock and work in progress 7.0 6.3
Debtors 162.6 153.9
Cash in the bank and in hand 181.0 211.0
350.6 371.2
Creditors—amounts falling due within one year (198.8) (171.7)
Creditors—amounts falling due after more (1,891.5) (1,811.9)
than one year
Provisions for liabilities and charges (114.9) (115.3)
Retirement benefit obligations (93.1) (83.0)
Deferred income (17.2) (17.9)
Capital and reserves
Called-up equity share capital 81.3 81.3
Profit-and-loss account 120.9 159.3
Net assets 202.2 240.6
Shareholders’ funds 202.2 240.6
Net current assets 151.8 199.5
Total assets less current liabilities 2,318.9 2,268.7
Current assets are assets that last
one year or less, and can be easily
converted into cash. Cash, cash
equivalents, and inventory are
the most common current assets
Creditors are the individuals or
organizations to which the company
owes money. Here, the money must
be repaid in the current financial year
Net current assets equal current
assets after money due to creditors
within one year has been deducted
Total assets less current liabilities
is the sum of fixed and net current
assets minus liabilities due within the
current financial year
Fixed assets (or non-current assets)
are not easily converted into cash
and usually last longer than one
year. They are either tangible, such
as land, or intangible, such as a logo
Net assets are what is left once
liabilities have been deducted from
the company’s fixed and net current
assets to give the overall net assets
Shareholders’ funds, or owner’s
equity, is the remaining capital;
this money can be reinvested
into the business or paid out as
an annual dividend
Year 2013
£m
Year 2012
£m
ASSETS, LIABILITIES, AND CAPITAL
Liabilities due in more than one
year are amounts due to creditors,
which are deducted from total fixed
and net current assets
SYMBOLS FOR DEBITS AND CREDITS
Accountants use a number of different terms and symbols to indicate debits and credits.
Some use “Dr” for debits and “Cr” for credits, others use “+” for debits and “–” for credits.
On this balance sheet, parentheses are used to show credits (negative numbers).
$
US_116-119_Balance_sheets.indd 117 09/11/2016 11:01
BALANCE SHEET
Understanding the notes
The balance sheet is a useful indication of the health
of a business, and it is important that investors know
how to analyze it. It can be read in two ways—“at
a glance,” as on the previous page, where general
information is summarized, or in depth, with more
detailed information about each element. Provided
after the summary, the detailed section of the balance
sheet explains the specific financial workings of the
business in a number of notes. It shows exactly where
money has been gained or lost, in figures, and it
often includes a written commentary about potential
developments that may affect the company, such as
court cases, staffing, or availability of resources.
Cost
As of April 1, 2012 676.3 1,229.7 1,204.6 105.0
93.2 3,308.8
Additions 9.5 67.8 49.1 2.3
96.2 224.9
Transfers on
commissioning 13.7 11.2 42.2 2.8
(69.9) –
Disposals (0.2) - (13.1) (0.5)
– (13.8)
Grants and contributions – (5.0) – –
– (5.0)
As of March 31, 2013 699.3 1,303.7 1,282.8 109.6
119.5 3,514.9
£m £m £m £m
£m £m
LAND AND
BUILDINGS
INFRASTRUCTURE
ASSETS
PLANT,
MACHINERY,
AND
VEHICLES
OTHER
ASSETS
PAYMENTS
ON ACCOUNT AND
ASSETS IN COURSE
OF CONSTRUCTION
Net book value of an asset
is its initial cost minus all its
depreciation to date
Total value of the company’s
fixed assets is listed by
category and in total
Depreciation is the decrease
in value of assets over time
Value of depreciation
of assets is listed by
category and in total
Disposals are any tangible
fixed assets the business has
disposed of or sold this year
Tangible fixed assets
include land and machinery
Additions are new tangible
fixed assets the business
has acquired this year
Combined value of the
company’s tangible fixed
assets in each category,
and also in total, is listed
Depreciation
As of April 1, 2012 211.3 435.5 558.8 34.0
– 1,239.6
Charge for the period 13.7 43.2 56.8 6.6
– 120.3
Disposals (0.1) – (11.5) (0.5)
– (12.1)
As of March 31, 2013 224.9 478.7 604.1 40.1
– 1,347.8
As of April 1, 2012 465.0 794.2 645.8 71.0
93.2 2,069.2
Net book value
As of March 31, 2013 474.4 825.0 678.7 69.5
119.5 2,167.1
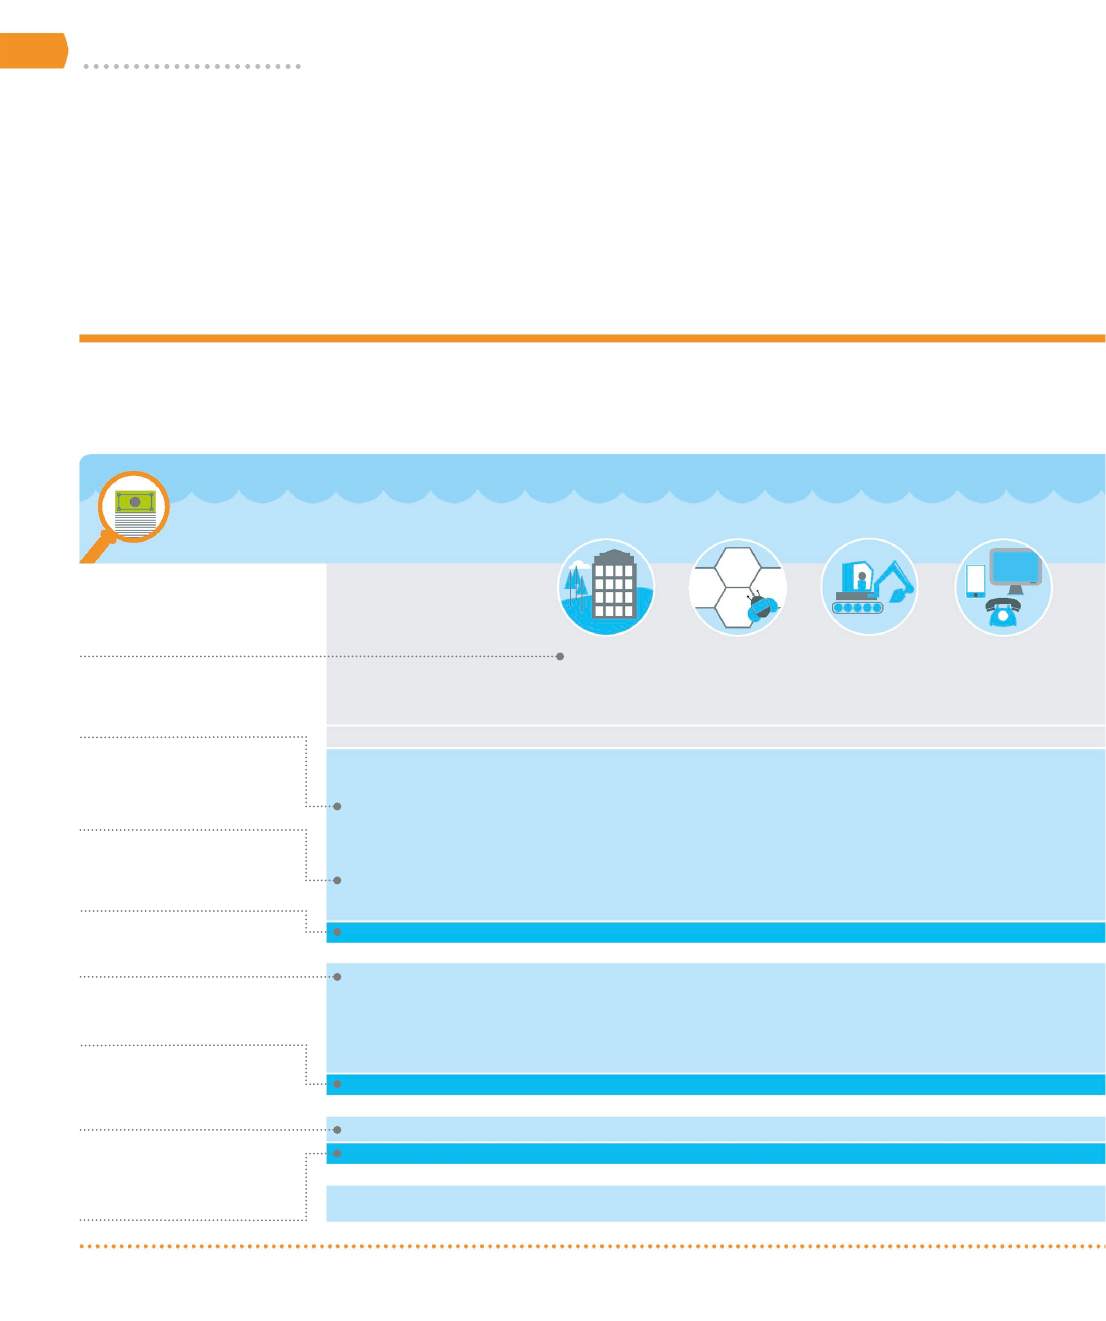
Balance-sheet notes
Investors may want to know more about the figures in the summary section, so additional notes and
tables give detailed breakdowns of the figures (at the time, the exchange rate was £1 = $1.58).
Case study: tangible fixed assets
This table presents details of Wessex Water’s tangible fixed assets (long-term assets
that cannot easily be converted into cash).
$
US_116-119_Balance_sheets.indd 118 02/12/2014 14:57
118 119
how finance works
Financial accounting
Cost
As of April 1, 2012 676.3 1,229.7 1,204.6 105.0 93.2 3,308.8
Additions 9.5 67.8 49.1 2.3 96.2 224.9
Transfers on
commissioning 13.7 11.2 42.2 2.8 (69.9) –
Disposals (0.2) - (13.1) (0.5) – (13.8)
Grants and contributions – (5.0) – – – (5.0)
As of March 31, 2013 699.3 1,303.7 1,282.8 109.6 119.5 3,514.9
£m £m £m £m £m £m
Trade debtors 48.9 48.1
Owed by group companies 31.8 35.0
Prepayments and 70.3 62.1
accrued income
Other debtors 11.6 8.7
162.6 153.9
Bank overdraft 21.8 18.6
Inter-company loan - 1.3
Obligations under 7.0 6.3
finance leases
Trade creditors 4.3 3.1
Amounts owed to subsidiary 18.9 14.2
company
Amounts owed to other group 0.6 0.6
companies
Amounts owed to associate 0.7 0.2
company
Dividend 23.3 21.7
Other creditors 2.4 2.0
Corporation tax 16.7 9.2
Taxation and social security 1.9 1.7
Accruals and deferred income 101.2 92.8
198.8 171.7
TOTAL
PAYMENTS
ON ACCOUNT AND
ASSETS IN COURSE
OF CONSTRUCTION
Individuals or entities that
sell assets to third parties on
credit, receiving payment at
a later date
Individuals or entities
that are owed money for
supplying raw materials
or components
Money owed to
related companies
that are owned by
the same group
Prepayments for services
that will be received in the
future, which the business
has already been paid for,
and accrued income that
is expected in the future
Any notes relating
to creditors
The inter company loan was due to a fellow subsidiary
company SC Technology GmbH and has been repaid.
Depreciation
As of April 1, 2012 211.3 435.5 558.8 34.0 – 1,239.6
Charge for the period 13.7 43.2 56.8 6.6 – 120.3
Disposals (0.1) – (11.5) (0.5) – (12.1)
As of March 31, 2013 224.9 478.7 604.1 40.1 – 1,347.8
As of April 1, 2012 465.0 794.2 645.8 71.0 93.2 2,069.2
Net book value
As of March 31, 2013 474.4 825.0 678.7 69.5 119.5 2,167.1
Case study: debtors
Debtors are individuals or entities that owe the business money.
Wessex Water has four categories of debtor.
Case study: creditors
Creditors are individuals or entities that the business
owes money to. They are in credit of Wessex Water.
2013
£m
2012
£m
2013
£m
2012
£m
Tax and employee
benefit payments
Payment to shareholders
Money owed to the bank
$
$
=
US_116-119_Balance_sheets.indd 119 02/12/2014 14:57

118 119
how finance works
Financial accounting
Cost
As of April 1, 2012 676.3 1,229.7 1,204.6 105.0
93.2 3,308.8
Additions 9.5 67.8 49.1 2.3
96.2 224.9
Transfers on
commissioning 13.7 11.2 42.2 2.8
(69.9) –
Disposals (0.2) - (13.1) (0.5)
– (13.8)
Grants and contributions – (5.0) – –
– (5.0)
As of March 31, 2013 699.3 1,303.7 1,282.8 109.6
119.5 3,514.9
£m £m £m £m
£m £m
Trade debtors 48.9 48.1
Owed by group companies 31.8 35.0
Prepayments and 70.3 62.1
accrued income
Other debtors 11.6 8.7
162.6 153.9
Bank overdraft 21.8 18.6
Inter-company loan - 1.3
Obligations under 7.0 6.3
finance leases
Trade creditors 4.3 3.1
Amounts owed to subsidiary 18.9 14.2
company
Amounts owed to other group 0.6 0.6
companies
Amounts owed to associate 0.7 0.2
company
Dividend 23.3 21.7
Other creditors 2.4 2.0
Corporation tax 16.7 9.2
Taxation and social security 1.9 1.7
Accruals and deferred income 101.2 92.8
198.8 171.7
TOTAL
PAYMENTS
ON ACCOUNT AND
ASSETS IN COURSE
OF CONSTRUCTION
Individuals or entities that
sell assets to third parties on
credit, receiving payment at
a later date
Individuals or entities
that are owed money for
supplying raw materials
or components
Money owed to
related companies
that are owned by
the same group
Prepayments for services
that will be received in the
future, which the business
has already been paid for,
and accrued income that
is expected in the future
Any notes relating
to creditors
The inter company loan was due to a fellow subsidiary
company SC Technology GmbH and has been repaid.
Depreciation
As of April 1, 2012 211.3 435.5 558.8 34.0
– 1,239.6
Charge for the period 13.7 43.2 56.8 6.6
– 120.3
Disposals (0.1) – (11.5) (0.5)
– (12.1)
As of March 31, 2013 224.9 478.7 604.1 40.1
– 1,347.8
As of April 1, 2012 465.0 794.2 645.8 71.0
93.2 2,069.2
Net book value
As of March 31, 2013 474.4 825.0 678.7 69.5
119.5 2,167.1
Case study: debtors
Debtors are individuals or entities that owe the business money.
Wessex Water has four categories of debtor.
Case study: creditors
Creditors are individuals or entities that the business
owes money to. They are in credit of Wessex Water.
2013
£m
2012
£m
2013
£m
2012
£m
Tax and employee
benefit payments
Payment to shareholders
Money owed to the bank
$
$
=
US_116-119_Balance_sheets.indd 119 02/12/2014 14:57
..................Content has been hidden....................
You can't read the all page of ebook, please click here login for view all page.