
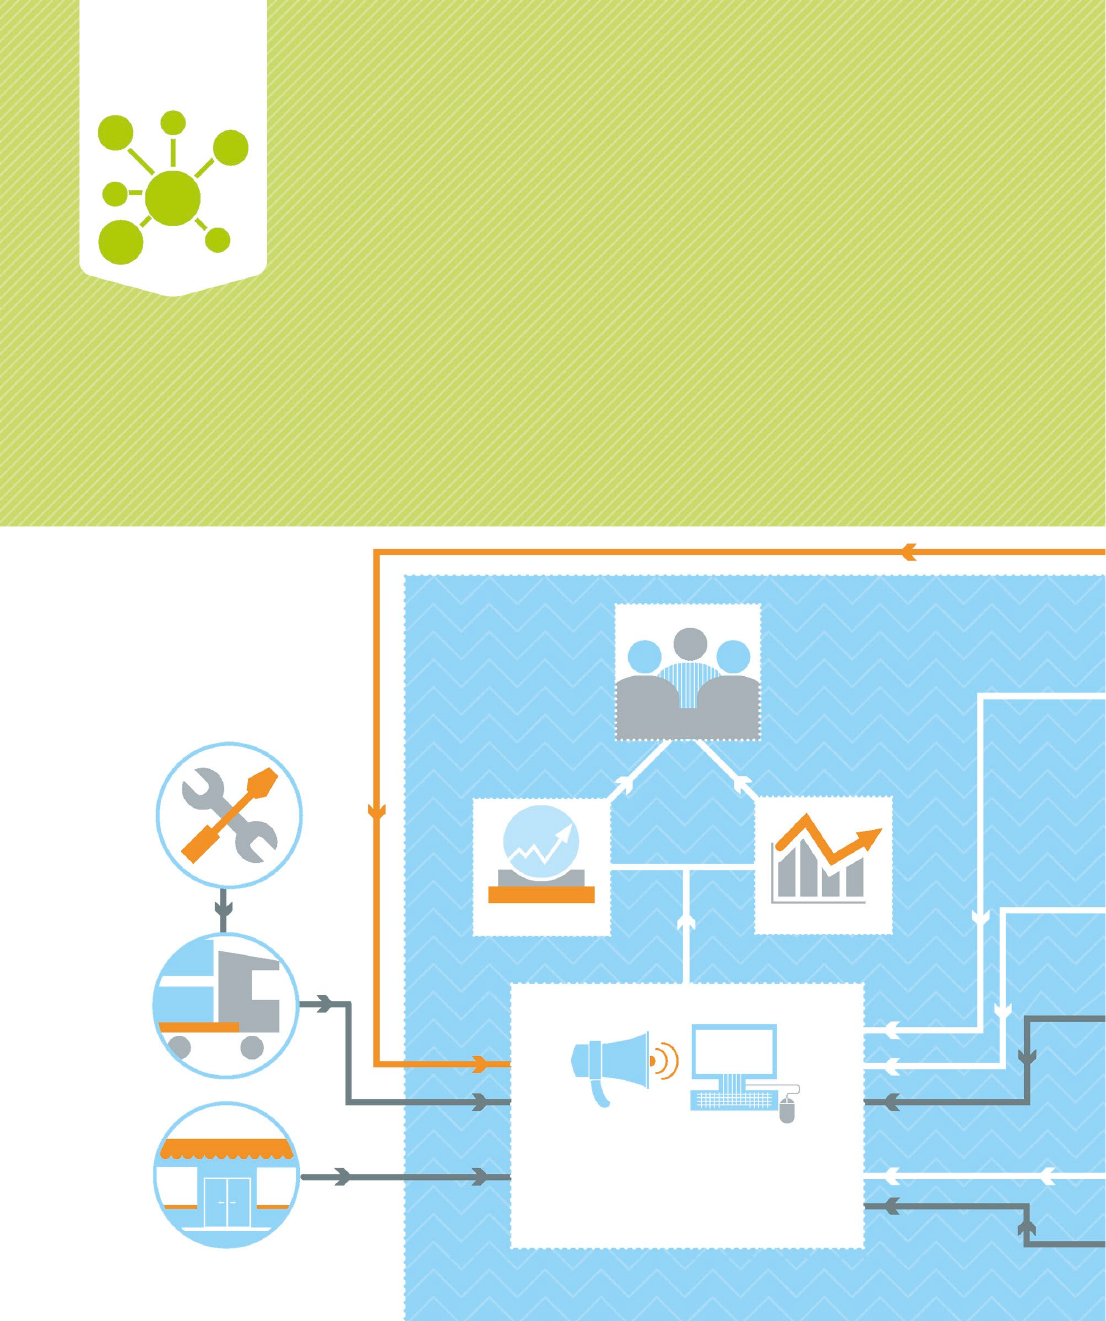
The marketing and IT departments are at
the center of information management.
They are responsible for collecting and
analyzing data, and then reporting their
findings to executives. See pp.252–253.
Forecast
Executives
Analysis
Information
management
Monitoring the marketplace and making sense of the vast quantities of data
available has become a priority for businesses; the data is crucial for digital
marketing, which is taking on increasingly sophisticated forms. Most businesses
have a system in place for managing information—and the most successful ones
use data not only to monitor day-to-day performance at every level, but to predict
future outcomes and plan accordingly.
P
r
o
d
u
c
t
i
o
n
S
u
p
p
l
y
c
h
a
i
n
S
a
l
e
s
o
u
t
l
e
t
Data
Data
Data
Data
Data
Data
Data
Internal
Within the business
itself, data feeds into
the marketing and IT
teams from operations,
finance, and human
resources.
External
Outside the business, data flows in
from production, supply chain, sales
outlets, partners, and customers.
Marketing and IT
US_246-247_Info_Management_OVERVIEW.indd 246 21/11/2014 16:27
246 247
how sales and marketing works
Information management
The legal system
ensures the use of
data adheres to
privacy and other
laws. See pp.266–267.
Operations
Finance
Human Resources
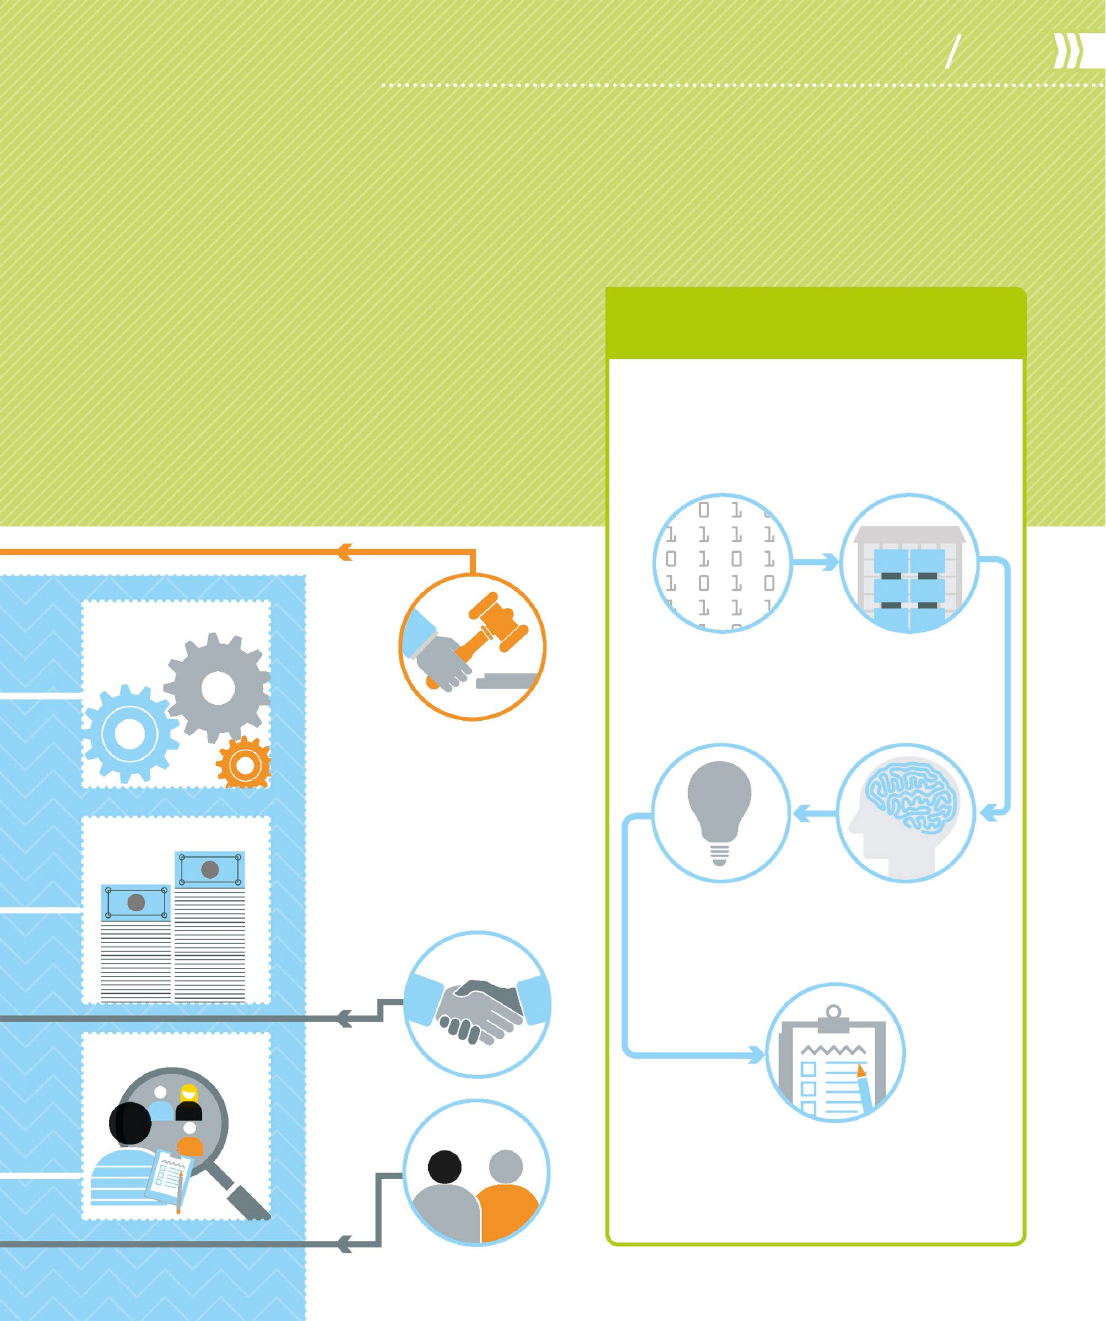
LEGAL COMPLIANCE
7%
of organizations
employ a chief
digital officer
TRANSFORMING DATA
INTO DECISIONS
With relevant data easily accessible (see pp.262–263)
a business can identify its strengths and weaknesses
in order to improve its processes and operations, as
well as its customer relationships (see pp.264–265).
Store information
Store data via data
warehousing.
See pp.256–257.
Make decisions
Plan and budget
for future outcome
Access knowledge
Retrieve data with
business intelligence tool.
See pp.248–249.
Source raw data
Gather customer data.
See pp.254–255 and
pp.258–261.
Gain insight
Examine data using
business analytics.
See pp.250–251.
L
e
g
a
l
s
y
s
t
e
m
P
a
r
t
n
e
r
s
C
u
s
t
o
m
e
r
s
$
$
US_246-247_Info_Management_OVERVIEW.indd 247 15/12/2014 13:53
246 247
how sales and marketing works
Information management
The legal system
ensures the use of
data adheres to
privacy and other
laws. See pp.266–267.
Operations
Finance
Human Resources
LEGAL COMPLIANCE
7%
of organizations
employ a chief
digital officer
TRANSFORMING DATA
INTO DECISIONS
With relevant data easily accessible (see pp.262–263)
a business can identify its strengths and weaknesses
in order to improve its processes and operations, as
well as its customer relationships (see pp.264–265).
Store information
Store data via data
warehousing.
See pp.256–257.
Make decisions
Plan and budget
for future outcome
Access knowledge
Retrieve data with
business intelligence tool.
See pp.248–249.
Source raw data
Gather customer data.
See pp.254–255 and
pp.258–261.
Gain insight
Examine data using
business analytics.
See pp.250–251.
L
e
g
a
l
s
y
s
t
e
m
P
a
r
t
n
e
r
s
C
u
s
t
o
m
e
r
s
$
$
US_246-247_Info_Management_OVERVIEW.indd 247 15/12/2014 13:53
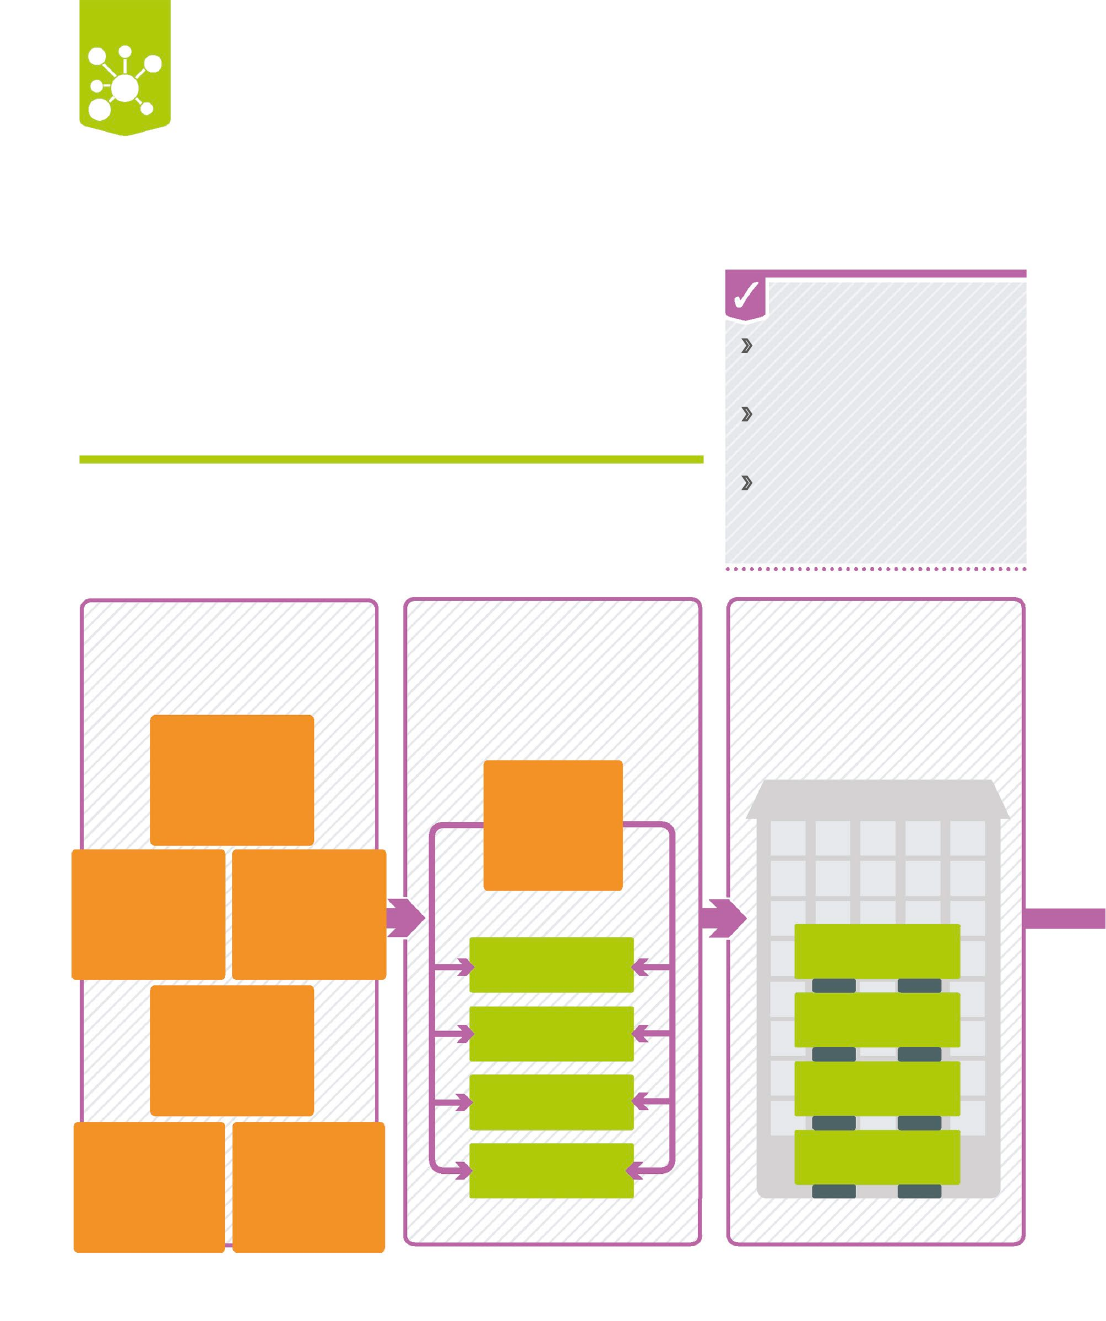
How it works
BI relies on software programs and
computerized systems for collecting
and integrating data in order that a
business can report on its activities,
both past and present. The tools
allow staff to pull relevant data
Business intelligence
Business intelligence (BI) is an umbrella term referring to the variety
of software applications companies use to access and analyze the
massive amounts of raw data they have at their fingertips.
from the company database.
The marketer then views the
information on a computer
screen using a data visualization
tool known as a dashboard, which
can also be used for real-time
monitoring of business operations.
Extract, transform, load:
ETL process
ETL system pulls raw data from
the source, formats it, and loads
it for use.
Collect source data
Company gathers raw data via
several operation systems.
Store data
Business uses data warehousing
to integrate and bank data in a
readily accessible form.
Business intelligence process
BI tools allow retrieval of specific relevant data by specifying the terms of the
intelligence they need (such as real-time sales compared to previous year’s sales).
Star schema Simplest format
of online analytical processing
(OLAP) in data warehouse
Data quality (DQ) Condition
of company’s master data, which
should be complete and accurate
Slice and dice Process in which
large amounts of data are broken
down to help analysis
NEED TO KNOW
ENTERPRISE
RESOURCE
PLANNING (ERP)
Manages
company data
WEB LOGS
Data relating
to activity on
corporate or
e-commerce sites
ETL SYSTEM
Migrates raw
data to data
warehouse
DATA WAREHOUSE
Flexible access to data
CUSTOMER
RELATIONSHIP
MANAGEMENT
(CRM)
Data from CRM
sources
TRANSACTIONAL
DATABASE
Data of current
commercial
transactions
EXTERNAL
DATABASE
Information
gathered from
sources outside
the company
SUPPLY CHAIN
MANAGEMENT
(SCM)
Data from SCM
sources
Creates data archives
Translates data codes
Transposes data
columns and rows
Splits and separates
information
Data from across
organization
Current data
Historical data
Data from outside
organization
US_248-249_Business_Intelligence_Steve.indd 248 21/11/2014 16:27
248 249
Retrieve and analyze
Staff can fetch data to answer
specific questions about what is
happening in the company.
SPREADSHEETS
Form primary BI
tool to display data
(basic or advanced)
OLAP CUBES
Online analytical
processing cubes
enable 3-D analysis
of three variables
on spreadsheet
DATA MINING
Allows the sifting of
data to find patterns
and relationships
REPORTING
TOOLS
Help users
develop and
produce reports
how sales and marketing works
Information management
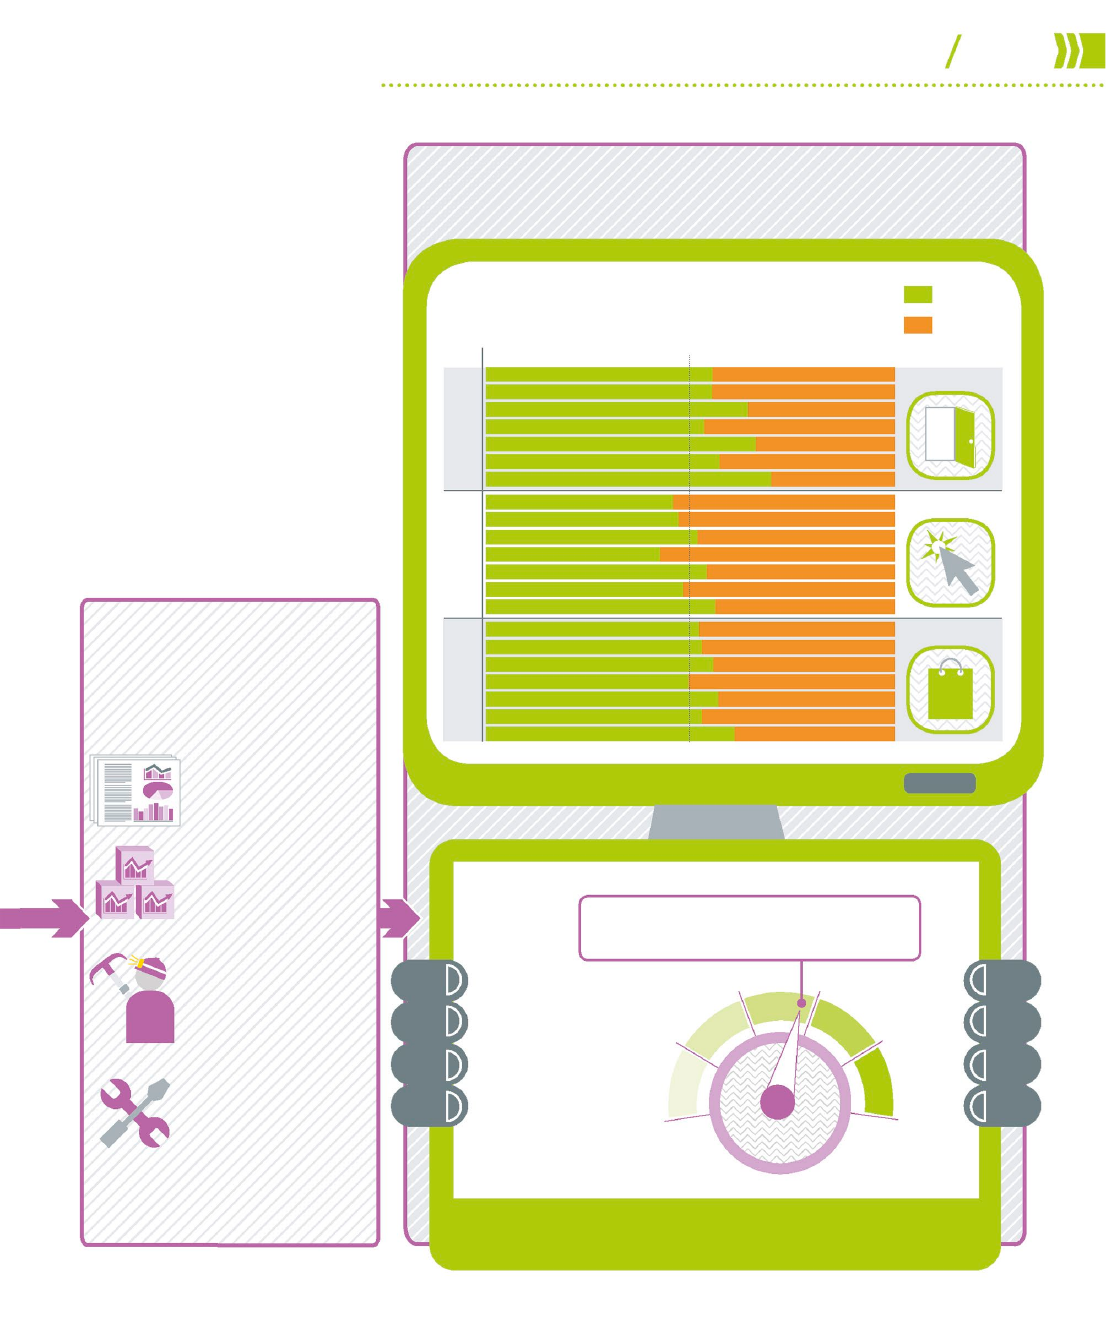
14%
the increase
in sales per
employee if
data usability
is improved
by 10%
Digital dashboard
Displays regularly updated business results using customized graphics.
TRACKING EMAIL CAMPAIGN
This dashboard tracks the percentage of people who open an email,
click on a website, and make a purchase on different days of the week.
Mon
Tue
Wed
Thu
Fri
Sat
Sun
Mon
Tue
Wed
Thu
Fri
Sat
Sun
Mon
Tue
Wed
Thu
Fri
Sat
Sun
Actual sales: $4,700,000
Expected sales: $8,125,000
58%
TRACKING SALES
This dashboard
shows the sales a
company actually
makes as a
percentage of
expected sales.
DAYS
OPENS
CLICKS
PURCHASES
YES
NO
50%
0%
20%
40%
60%
80%
100%
US_248-249_Business_Intelligence_Steve.indd 249 15/12/2014 13:54
248 249
Retrieve and analyze
Staff can fetch data to answer
specific questions about what is
happening in the company.
SPREADSHEETS
Form primary BI
tool to display data
(basic or advanced)
OLAP CUBES
Online analytical
processing cubes
enable 3-D analysis
of three variables
on spreadsheet
DATA MINING
Allows the sifting of
data to find patterns
and relationships
REPORTING
TOOLS
Help users
develop and
produce reports
how sales and marketing works
Information management
14%
the increase
in sales per
employee if
data usability
is improved
by 10%
Digital dashboard
Displays regularly updated business results using customized graphics.
TRACKING EMAIL CAMPAIGN
This dashboard tracks the percentage of people who open an email,
click on a website, and make a purchase on different days of the week.
Mon
Tue
Wed
Thu
Fri
Sat
Sun
Mon
Tue
Wed
Thu
Fri
Sat
Sun
Mon
Tue
Wed
Thu
Fri
Sat
Sun
Actual sales: $4,700,000
Expected sales: $8,125,000
58%
TRACKING SALES
This dashboard
shows the sales a
company actually
makes as a
percentage of
expected sales.
DAYS
OPENS
CLICKS
PURCHASES
YES
NO
50%
0%
20%
40%
60%
80%
100%
US_248-249_Business_Intelligence_Steve.indd 249 15/12/2014 13:54

How it works
BA takes a scientific approach
to interpreting information.
Businesses use BA’s advanced
software tools to analyze
information about past or current
trends and behavior to predict a
future scenario. Unlike business
intelligence or predictive analytics
Business analytics
More cutting-edge than business intelligence (BI), business
analytics (BA) allows advanced statistical analysis of data,
which is used to help make future business decisions.
that analyze current and past data,
BA allows businesses to forecast
with a high degree of confidence.
BA can be applied on a macro
level to get a broad view of future
business performance and on a
micro level to assess, for example,
the likelihood of individuals in
niche markets making purchases.
93%
of IT executives
in Brazil say
that their
business could
be improved
by using big
data analytics
or intelligence
Business analytics process
A skilled analyst interprets the raw data using
BA tools. The results influence the business
actions that will be taken in the future.
Software program that predicts
patterns of behavior and the
likelihood of specific sets of
customers, or even individuals,
making a purchase.
Predictive modeling
The example of a 5 percent sales dip shows how BI and
BA can be used to examine and understand the situation.
Business intelligence
Type of data investigation Results reveal past and
current event in the business.
Questions answered What has happened in the
business in the past and what is happening currently?
Tools used Reporting, dashboards, scorecards,
online analytical processing (OLAP)
Business analytics
Type of data investigation Examines past event in
the business, and applies the patterns discovered to
a future scenario.
Questions answered Why did it happen? Will it happen
again? What can we do to stop it from happening again?
Tools used Statistical analysis, data mining, pattern
matching, predictive modeling
BUSINESS INTELLIGENCE
AND BUSINESS ANALYTICS
US_250-251_Business_Analytics_Steve.indd 250 21/11/2014 16:27
250 251
HOW SALES AND MARKETING WORKS
Information management
This includes company records
(past and current customer data
and transaction histories) and
external data (economic, trade,
and industry reports).
Raw data
Software tools are used to
process and study raw data.
Analysts interpret results and
make forecasts that help future
business decisions.
Analysis
Formulation of graphs depicting
the results of data analysis;
graphs may rank data, group
common attributes, and compare
relationships.
Data visualization
Process of trawling through large
quantities of data to find patterns
between variables, which can be
applied to other sets of data.
Pattern matching
Use of computerized processes
and software programs to find
relevant patterns in large sets
of data.
Data mining
O
u
t
I
n
Predictive analytics
Program that conducts
advanced analysis of data
to forecast future outcome
Monitoring
Process that uses software
to show what is currently
happening in a business,
providing real-time results
to help key operations
make decisions
Statistical analysis
Software that organizes and
investigates every piece of
relevant data and interprets
it to show trends and patterns
Reporting
Method that draws on
historical data to provide
a general overview, revealing,
for example, how the business
performed in a given year
Some data is more useful than
other data; value is determined by
the extent to which marketers can
use it to make confident forecasts.
Methods of interpreting data are
increasingly sophisticated.
DATA USEFULNESS
US_250-251_Business_Analytics_Steve.indd 251 21/11/2014 16:27
..................Content has been hidden....................
You can't read the all page of ebook, please click here login for view all page.