
Appendix A. The Taylor-Russell Tables
These are tables of the proportion of employees who will be satisfactory among those selected (success ratio) for given values of the proportion of present employees considered satisfactory (base rate), the selection ratio, and r.
Source: H.C. Taylor and J.T. Russell, “The relationship of validity coefficients to the practical effectiveness of tests in selection: Discussion and tables,” Journal of Applied Psychology, 23, 1939, 565-578.
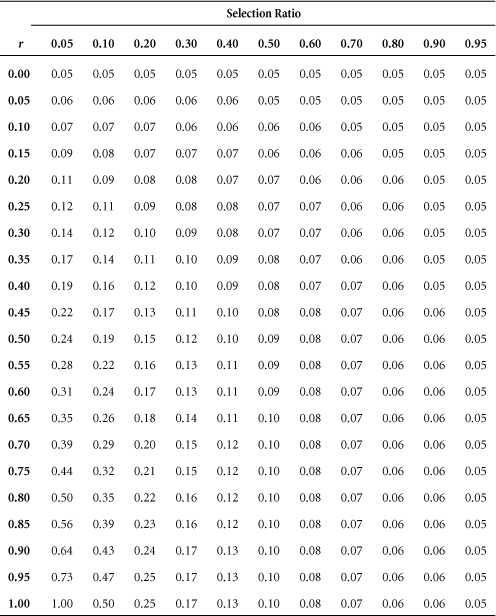
Proportion of Employees Considered Satisfactory = 0.05

Proportion of Employees Considered Satisfactory = 0.10
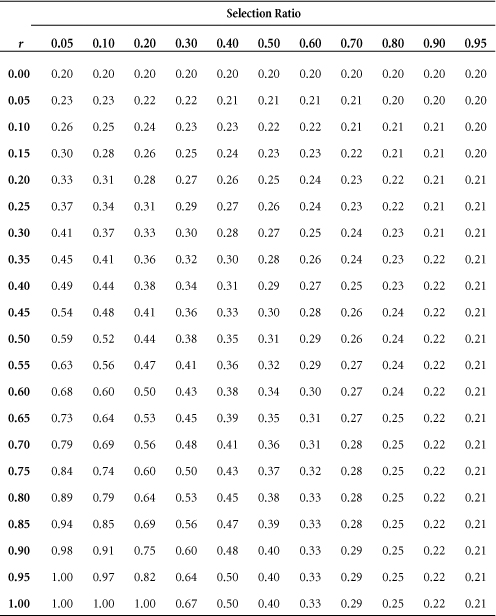
Proportion of Employees Considered Satisfactory = 0.20

Proportion of Employees Considered Satisfactory = 0.30
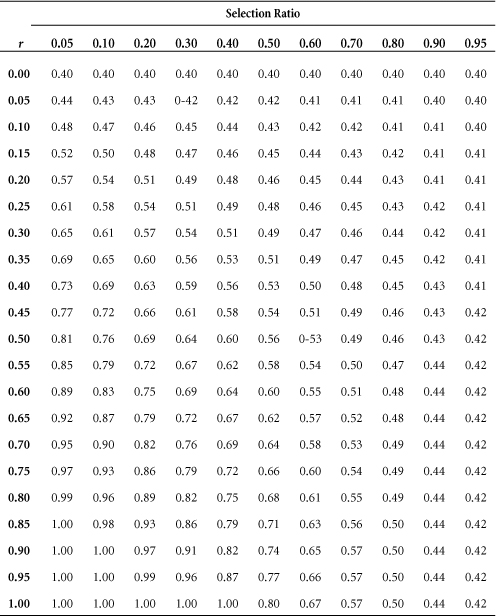
Proportion of Employees Considered Satisfactory = 0.40
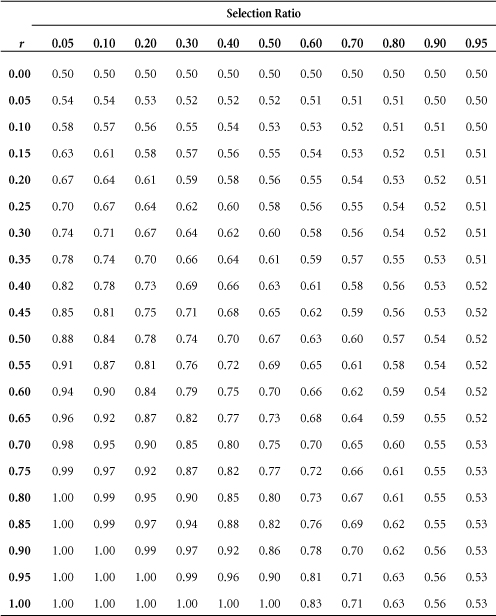
Proportion of Employees Considered Satisfactory = 0.50
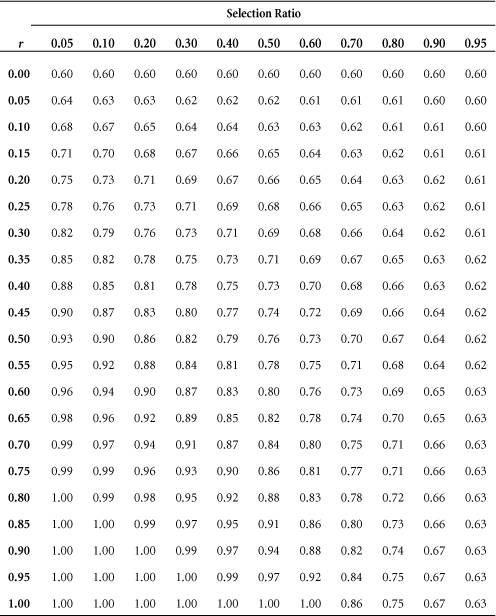
Proportion of Employees Considered Satisfactory = 0.60
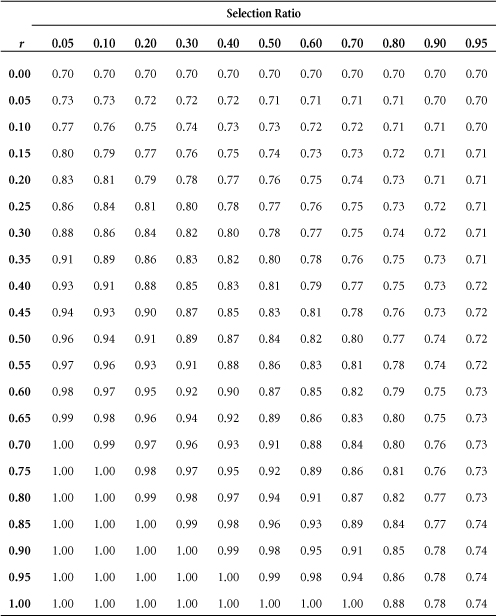
Proportion of Employees Considered Satisfactory = 0.70

Proportion of Employees Considered Satisfactory = 0.80
