
4. Incentive Compensation
Aims and objectives of this chapter
• Explain the accounting issues involved in incentive compensation programs
• State the different types of cash incentive compensation plans currently in use
• Explore the prevalence of incentive compensation plans
• Discuss the various key incentive compensation metrics
• Explain the need to use sustaining financial value creation metrics
• Discuss the free cash flow measure as an incentive compensation metric
• Discuss the economic value added measure as an incentive compensation metric
• Discuss the residual income measure as an incentive compensation metric
• Discuss the use of a balance scorecard system as an incentive compensation triggering mechanism
An Introduction to Incentive Compensation Programs
One important element of the total compensation system is the short-term annual incentive compensation program. Most organizations have some form of this element of the total compensation system. The structure of short-term incentives can take many forms. This chapter presents a detailed analysis of incentive compensation programs. The focus is on, as it is throughout this book, the accounting and finance implications of incentive compensation.
The chapter discusses the following:
• The accounting for annual incentive compensation plans
• Key incentive compensation program metrics
• Free cash flow as an incentive plan metric
• Economic value added as an incentive plan metric
• Residual income as an incentive plan metric
• The balance scorecard and incentive compensation
Cash incentive plans are also called cash bonus plans. Cash incentive compensation can fall into the following categories:
• Annual plans covering all employees or a large percentage of employees of the company
• Long-term cash incentive plans that are provided mostly to senior executives
• Cash profit-sharing plans
• Incentive plans for specific employee groups (such as engineers, scientists, and other key employees)
• Annual bonus plans specially designed for senior executives
• Nonqualified deferred compensation plans tied into an annual incentive plan
• Other types of cash incentive/bonus plans
• Sign-on bonus
• Referral bonus
• Spot bonus
• Retention bonus
Note that these cash plans can be either annual plans, triggered by an annual metric, or they can cover multiyear periods if the plans are designed to be triggered by multiyear financial performance.
The prevalence of annual cash incentive plans clearly demonstrates that a majority of companies, both public and private, offer such plans to employees. A term pay at risk has been introduced to indicate that companies are increasingly asking employees to share in the risk/reward playing field of a business venture. Companies are now reducing or controlling the fixed component of pay (the base pay) and increasing the incentive component. The idea is that if a company achieves its financial goals the employees who made that happen should be rewarded accordingly. Such a motivational philosophy clearly applies to senior executives, but more and more companies are including all levels of employees within this conceptual structure. There is a great appeal for the pay-at-risk approach in an era of expense-reductions, financial control, and austerity. So, there is an increasing incidence of these plans. Note, as well, that by reducing or controlling the “fixed” component of pay and increasing the short-term component, companies can reduce fixed expenses. Compensation expenditures are contingent on increasing financial results.
In a paper written for the Coastal Business Journal, authors Mike Schraeder and J. Bret Becton provide an overview of recent trends in incentive pay programs. The paper suggests the following with regard to incentive compensation programs:
• Increased use of incentives for employee groups, teams, and project teams.
• More use of both qualitative and quantitative measures in incentive compensation programs.
• Increased use of incentive compensation programs in entrepreneurial firms.
• Increased use of incentive compensation programs in service industries has also been observed.1
1 Schraeder, M., and Becton J.B., “An Overview of Recent Trends on Incentive Pay Programs,” The Coastal Business Journal, Vol. 2, No. 1, Fall 2003.
The authors suggest that an incentive program plays an important role in motivating staff to achieve organizational goals.
The authors further suggest that the process used to develop the incentive program is often as important as the specific elements of the program. This is in keeping with motivation theories that suggest employees consider the programs fair when they know how pay outcomes are determined. Employees perceive that the process used in determining amounts to be paid is more important than the amount of pay received. The more the employees participate in program development, the more they are satisfied with the entire incentive program. The process is as important as the outcome.
In addition, short-term incentive plans are becoming more and more important as an element of the total compensation structure. Short-term plans help strengthen the connection between the execution of a business strategy and payouts received from the plan. Incentive plans are also being customized to reinforce mission-critical functions. This means it becomes possible to align incentives with sales and functions that are critical to the successful execution of business strategies.
You can read an excellent analysis of the prevalence of short-term cash bonus plans in a report produced by the professional association WorldatWork. This report comprehensively analyzes the various types of bonus plans used to incent to achievement of various types of strategic and operational business objectives.2 The report focuses on bonuses granted to generate specific types of employee behavior outcomes.
2 “Bonus Programs and Practices,” a research report by WorldatWork, April 2011, Scottsdale, AZ.
Accounting for Annual Cash Incentive Plans
The accounting for short-term incentive plans is fairly straightforward. All expenditures for these plans are expensed in the period in which they are incurred. This is in keeping with the matching principle of accounting. These expenses are regarded as period expenses and carried to the income statement in the year they are incurred. The same principle applies to cash wages. The logic for this holds that most annual incentive plans are built around performance triggers that cover the current accounting or fiscal year. Therefore, these expenses should be “matched” against the revenues earned during the same period—the matching principle.
Usually, though, the annual payouts are made in the year following the year covered by the incentive plan. The payouts are normally made within the first three months of the upcoming year. The reason for this is that the accounting transactions for the completed year has to be closed, audited, and reported before incentive payouts can be finalized. For example, if the incentive plan measurement period is the calendar year 2013, the incentive payouts will be made in the first quarter of 2014. So, for 12/31/13 financial reporting, the expense for incentives will be recognized in 2013.
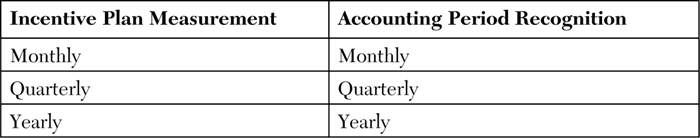
Another accounting issue dealing with incentive plans is the need to accrue these expenditures on a proactive basis. This means as the bonus is earned during the year the requisite amount needs to be accrued as a payable and also recorded as an expense. The key consideration here is the determination of when the participant earns the incentive out. Some plans have monthly, quarterly, or semi-annual measurement periods. If the formal plan document specifically stipulates the measurement period to be other than annual, the accounting system needs to accrue the liability and recognize an expense before publishing interim financial reports. Exhibit 4-1 shows this process in tabular form.
Exhibit 4-1. Incentive Plan Measurement and Accounting Period Recognition
Estimated incentive payouts need to be accrued during the year the incentive is being earned. Suppose, for instance, that the current year is 2013. During the course of 2013, the accounting department needs to work with the human resource (HR) department and estimate incentive payouts per the plan provisions. This estimation needs to be based on the actual results to date of the financial and operational measures used in the incentive plans. These measures or objectives should be those that are stipulated in the plan. Based on these estimates, the journal entries listed in Exhibit 4-2 need to be made.
Exhibit 4-2. Journal Entries Illustrated

The calculation and journal entry needs to be made whenever performance on the financial or the other operational incentive compensation metrics matches or exceeds the planned levels in the incentive plans, for all categories of employees.
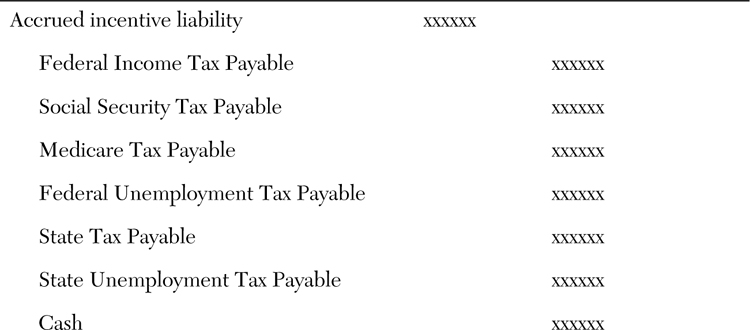
When the incentives are actually paid out, the accrual accounts should be cleared out in the manner shown in Exhibit 4-3.
Exhibit 4-3. Journal Entry Illustrated
Note that estimating incentives could be a subjective exercise. This is because estimates are made by making a guess about the financial and operational performance in the future months. This way, companies might wait for some months to pass in the year before any accruals of the incentives are recorded. This will allow for a better estimation of the eventual payouts.
Also, if the incentive plan has a provision for reduced payouts when targets are not achieved (usually up to a minimum threshold), the estimate of future payouts should account for this possible occurrence.
Nevertheless, at the end of the year, when the actual performance of the financial and operational measures that were used in the incentive plans are known, the incentive compensation accrual should be adjusted as final.
Another noteworthy accounting issue with respect to annual incentive compensation accounting is termed the circular effective. Accountants, when determining projected year-end net income (for interim reports), make an estimate of incentive compensation to be paid out. Based on the final results on the performance against plans for the incentive compensation performance metrics, however, the estimates made by the accountant for the annual incentive compensation to be paid might need to be revised at year end, thus affecting year-end net income. So, during-year incentive compensation estimates might be one of the causes of the deviation of year-end net income from the earlier-in-the-year projections. If the projected versus actual net income deviations are large enough, the accounting department might come under scrutiny for the inaccuracy in estimating incentive compensation payouts. These deviations are a further reason for the practice of earnings management.
Although the accounting treatment of these annual cash incentive plans is straightforward, accounting-related and finance-related issues need to be discussed, as we do throughout the remainder of this chapter.
Key Incentive Compensation Metrics
Although the development of key incentive compensation indicators is not a strictly accounting and finance issue, the selection and use of specific indicators does indirectly have finance and accounting implications. Key indicator or triggering metric determination is the most important design and implementation issue with respect to incentive plans.
Key indicators can be financial and nonfinancial, but financial indicators are usually given the highest weight in plan design. For executive incentive plans in public companies, the selection of these indicators requires board compensation committee and the entire board’s approval.
The following financial metrics are commonly used in incentive plans:
• Return on equity (ROE)
• Return on assets (ROA)
• Earnings per share (EPS)
• Net income (NI)
• Earnings before taxes (EBT)
• Earnings before interest and taxes (EBIT)
• Earnings before interest, taxes, depreciation, and amortization (EBITDA)
• Total shareholder return (TSR)
• Gross sales
• Gross margin
• Expenses to budget
• Economic value added
• Intrinsic value (discounted free cash flow)
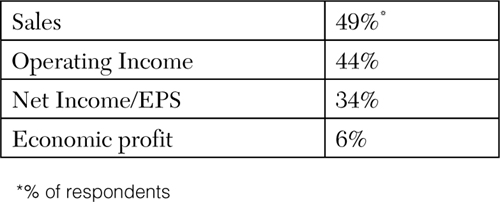
For private companies, the financial measure used might differ. An October 2007 research report by WorldatWork and Vivient Consulting3 found the prevalence of financial metrics to be as shown in Exhibit 4-4.
3 “Private Company Incentive Pay Practices,” a research report by WorldatWork and Vivient Consulting, October 2007.
Exhibit 4-4. Financial Metrics for Private Companies
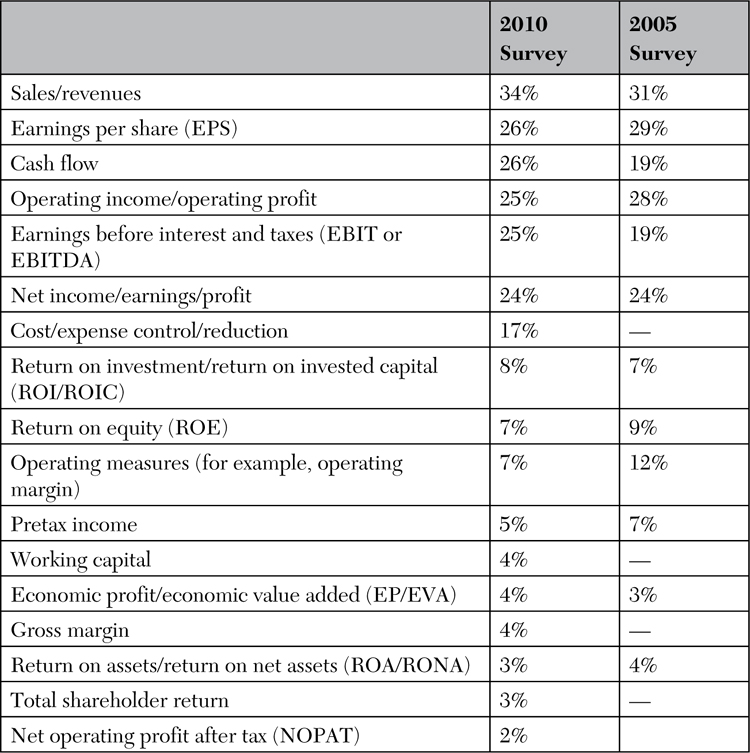
In another report from the premier compensation consulting firm Towers Watson, the incidence of financial metrics was reported. In this report, the change in the use of key metrics over a five-year period was demonstrated. Exhibit 4-5 shows the results of that report.
Exhibit 4-5. Prevalence of Financial Performance Measures4
4 Data from Towers Watson; Executive Compensation Bulletin; Smith, Max, and Stradley, Ben; February 25, 2010; p. 4; reprinted with permission.
To more accurately assess an executive’s performance, compensation plan designers should focus on organizational metrics that most closely resemble the company’s operating fundamentals. Two such metrics are operating cash flow and EBITDA. Some incentive plan designers use these metrics to trigger incentive compensation plan payments because these metrics are also among the metrics used by business valuation specialists to value companies. Operating cash flow and EBITDA are regarded as better measures of the operating performance of a business.
Operating cash flow, rather than net income, can generally give plan designers a clearer picture of the company’s sustainability. Moreover, operating cash flow takes into account a company’s working capital (receivables, payables, and inventory) while eliminating noncash charges associated with depreciation. EBITDA is similar to operating cash flow; however, it does not take into account working capital or the firm’s capital structure. In some cases, from an operational point of view the capital structure may be an important consideration, especially when companies are strategically attempting to deleverage. The control of excessive interest expense can also be a primary operational concern.
It can be safely concluded that financial metrics are generally used in defining the parameters for short-term incentive compensation or variable pay. They are also used for long-term incentives for companies in all stages of growth. Others are also currently advocating the need to include nonfinancial measures as incentive plan payment-triggering metrics.
Of all the financial metrics mentioned so far, two specific metrics, Economic Value Added (EVA) and Discounted Free Cash Flow, are effective measures for evaluating the performance of managers and other key employees vis-à-vis shareholder interests. These measures clearly emphasize sustaining value creation. However, these measures are not as widely used as financial metrics. Therefore, these measures need to be explored as valid incentive compensation metrics. So, the next sections discuss these two measures and comment on the validity of their use as incentive plan triggers.
These two metrics are effective as measures to assess long-term value creation for a business. So, using them to evaluate management and key employee performance (and therefore incentive compensation) is highly desirable. However, these metrics are seldom used. Instead, the use of short-term performance metrics is more common (for example, EBIT, NI, and EBIDTA). These measures currently being used are earnings-based measures. Arguably, managers and other key employees of corporations are hired to improve the sustainable value of a business and so they should be compensated on value creation and not just on short-term earnings measures. The true financial measure of sustaining value creation for a firm is the free cash flow generated. The sustaining value of this measure is the intrinsic value. Economic value added is also regarded as a valid value-creation measure. Incentive plans designed around these value measures can prove very effective for all concerned stakeholders.
Managers and shareholders alike need to know how alternative actions being contemplated are likely to affect stock prices. Intrinsic value as a measure clearly demonstrates the connections between managerial decisions and action and the firm’s value. Therefore, using an intrinsic value measure to trigger managerial compensation makes a lot of sense.
The value measures also consider the cost of capital, as measured by the weighted average cost of capital. So, the cost of capital needs to be integrated into incentive plan design. Management will then be motivated to take all necessary actions to ensure that the company’s return of invested capital exceeds the cost of that capital.
Let’s now look at designing plans around these value measures.
Free Cash Flow as an Incentive Plan Metric
The value of a company is a function of the future cash flows it generates. Therefore, free cash flow (FCF) is an integral part of the analysis of the value enhancement for a firm. This is normally defined as after-tax operating profit minus the amount of new investment in working capital and fixed assets necessary for sustaining and maintaining the growth of the business. Managers make the business sustainable by increasing free cash flow. Therefore, an appropriate measure of managerial and key employee performance and thus incentive payouts is the increase in FCF from period to period and over the long run.
Calculating the FCF requires certain sequential calculations.5
5 Ehrhardt, M.C., and Brigham, E.F., Financial Management: Theory and Practice, 13e, 2011, South-Western Language Learning, pp. 59–70.
First, the net operating profit has to be determined by multiplying EBIT by one minus the company’s tax rate. Second, operating current liabilities should be subtracted from operating current assets, which will result in net operating working capital (NOWC). Third, the NOWC needs to be added to operating long-term assets to arrive at total net operating capital. Then, the year-to-year change in total net operating capital is calculated by subtracting this measure from one year to the next. This results in net investment in operating capital. Finally, the total net operating capital for the current year is subtracted from the NOPAT to derive FCF for the year. Sometimes, from operating cash flow (NOPAT + depreciation), the gross investment in operating capital (net investment in operating capital + depreciation and net investment) in working capital is subtracted to derive FCF.
To state the FCF measure in value-creation terms, we need to calculate the present value of the FCF over a fixed time period by applying a discounting factor using the weighted average cost of capital (WACC) for that company, as shown in Exhibit 4-6. The result of this formula is also referred to as the intrinsic value of a firm.
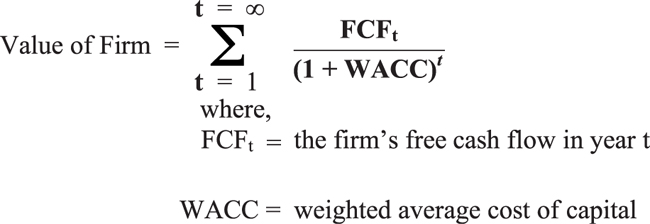
Exhibit 4-6. Intrinsic Value Calculation
The year-to-year change in this measure should be calculated and used in designing an incentive plan. Targets should be set for incentive payouts. Then, performance achieved against targets should establish the actual incentive payments.
Economic Value Added as an Incentive Plan Metric
Managers are the agents of the owners: the agency model. The owner’s interest is to maximize the wealth that they have invested in the business. The board of directors, whom the owners elect to take care of their interests, hire professional managers to take care of the interests of all stakeholders.
The challenge for the board of directors is to align the managers’ interests with those of the shareholders. Managers whose interests are not aligned with those of the shareholders will tend toward behavior that suits their interests, which might not necessarily be those of the shareholders. This is where the temptation to manage earnings arise. Management might channel investments that bring the most value to themselves personally through benefits such as perks and short-term profitability incentive payments. Management is tempted to do earnings management instead of making investments that create the most value for shareholders.
Therefore, it is in the interests of both the parties to align shareholder interests with those of managers. This can best be achieved by tying management compensation directly to a measure that indicates organizational value creation. EVA directly measures the value created by a company. It is a metric that considers both operating and capital costs.
EVA treats the opportunity cost of capital as a real cost that needs to be deducted from revenues to arrive at a more relevant “bottom line.” A firm that is earning profits but is not covering its basic opportunity cost can use the capital in other areas. Therefore, many companies alter the management compensation paradigm and tie manager compensation to the EVA metric.
“Economic value added (EVA) is the spread between RoA and the cost of capital multiplied by the capital invested in the firm. It therefore measures the dollar value of the firm’s return in excess of its opportunity cost.”6
6 Bodie, Z., Kare, A., and Marcus, A., Essentials of Investments, 8e, 2010, McGraw Hill Irwin, New York, p. 452.
Clearly the EVA metric is an important measure to assess the maximization of shareholder wealth. Therefore, management (who are appointed nominees of the board of the directors and custodians of the interests of shareholders) should also be evaluated on their performance and rewarded based on EVA. In addition, EVA as a measure is not as global as the price of a stock. EVA measures can be developed for managers down the corporate ladder. EVA measures can be developed for a division, a business unit, a factory, or a store (for a retailer). Before we look at the connection of EVA to incentive plans, let’s first review the calculations involved in developing the EVA measure.
The basic equation can be stated in various forms:
• EVA = Net income + Interest charges – Capital charge
where
Capital charge = (Notes payable + Current maturities of long-term debt + Long-term debt + Stockholders’ equity) × Cost of capital7
7 Harrison, Walter T., and Horngren, Charles T., Financial Accounting, 7e, 2008, Pearson Prentice-Hall, Upper Saddle River, NJ, p. 707.
The cost of capital is the weighted average of the returns sought by stock investors and lenders.
• EVA can also be calculated by first calculating net operating profit after taxes, which is earnings before interest and taxes minus the effective tax rate. From this number, the total net operating capital multiplied by the weighted average cost of capital is subtracted to derive EVA.
• To derive economic value added or EVA, you can simply take the after-tax operating profit and remove a charge for the cost of the capital employed to deliver that profit. Specifically
Net sales – Operating expenses = Operating profit (or EBIT)
EBIT – Taxes = Net operating profit after tax (or NOPAT)
NOPAT – Capital charge (Invested capital × WACC) = EVA
Where the weighted average cost of capital is a firm’s cost of capital for each category of capital proportionately weighted. All capital, common stock, preferred stock, bonds, and any other long-term debt are included in a WACC calculation.
After calculating the EVA for incentive compensation purposes, a formula needs to be set up to capture the year-to-year or interperiod change in the EVA measure. Such a model is described in “Using EVA to Align Management Incentives with Shareholders’ Interests.”8 The author, Heather Balsley, identifies the following EVA-based incentive formula:
8 Balsley, H., “Using EVA to Align Management Incentives with Shareholder Interests,” December 2005, student paper, International Financial Management, Harvard Business School, pp. 1–2.
Current year incentive = Target bonus + y% (Change in EVA less expected EVA improvement)
This is a unique incentive setup, in that the author is suggesting that the incentive participant should be paid his or her target incentive (a percentage of base salary) plus a percentage of the change in EVA that the participant helped generate, which is above the EVA improvement that was expected.
Setting up an incentive formula based on EVA improvement is quite appropriate. But another way to set up the scheme is as follows:
1. Set a numeric EVA improvement target at the start of the fiscal plan year. For a multiyear target, set up a cumulative interperiod EVA improvement target.
2. At year-end, calculate the plan to actual percentage. For a multiyear plan, calculate plan versus actual and do the calculations on the cumulative interperiod EVA improvement target.
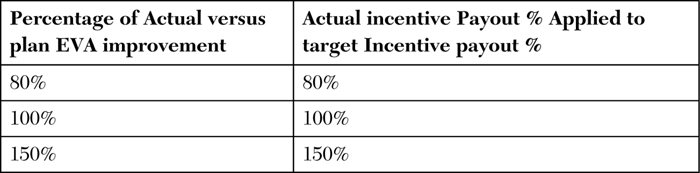
3. If 100% of planned improvement is actually achieved, 100% of target bonus can be paid out. Then a sliding scale should be developed for the achieved versus the planned improvement percentage. There should be a minimum threshold and a maximum ceiling.
Exhibit 4-7 shows a payout matrix.
Fundamentally, EVA is a robust incentive compensation measure because it takes into account all the variables managers are responsible for: sales, operating expenses, and capital changes that offset the value added.
Residual Income as an Incentive Compensation Plan Metric
In both theory (the published literature) and actual current practice, residual income (RI) is sometimes used as an incentive compensation triggering metric. In general, RI is considered to be the net operating income that any economic unit earns above the minimum required return on the unit’s operating assets. It is also defined as earnings before interest less a capital charge on total capital (debt and equity).9
9 Commonly, RI is calculated by subtracting from net operating income average operating assets multiplied by the minimum required rate of return.
Note that the residual income measure is similar in line with EVA and that some consider EVA an adoption of RI. Minor technical differences exist between EVA and RI. In the most practical sense, EVA is based on making some adjustments to the RI calculation. These are minor differences; for example, EVA could make an adjustment for research and development and treat R&D as an asset as opposed to the normal practice of expensing period R&D outlays. Ultimately, RI is basically the projected net operating income minus the dollar cost of capital. And, in essence, EVA projects what the company’s NOPAT will be after subtracting the cost of capital. So, RI and EVA are fairly similar measures of business value creation.
In a research study conducted by James S. Wallace and published in the Journal of Accounting and Economics,10 the author empirically established that RI is an effective incentive compensation metric. The study used data from 40 firms and analyzed the effectiveness of the decision making of managers who are under an RI incentive compensation system. The study considered (1) investing decisions (asset dispositions will increase and new investment will decrease), (2) financing decisions (share repurchases and dividend payouts will increase), and (3) operating decisions (total asset turnover will increase). The author concluded that those firms that used RI as an incentive compensation metric; “(i) increased their disposition of assets and decreased their new investment, (ii) increased their payouts to shareholders through share repurchases, and (iii) more intensively utilized their assets.”11
10 Wallace, James S., “Adopting Residual Income-Based Compensation Plans: Do you get what you pay for?” Graduate School of Management, University of California, Irvine, October 1, 1996 pp. 275–300.
11 Ibid pp. 275–300.
The Balanced Scorecard and Incentive Compensation
Much has been written about the balanced scorecard form of evaluating corporate performance and tying the results to incentive compensation. This section reviews this concept.
A case can be made for tying incentive compensation, for all employees and (more important) executives, to balanced scorecard performance measures. However, all the evidence suggests that an organization should do this only after it has been using the balanced scorecard methodology for performance evaluation for some time. This period could be a year or more. The organization should feel confident that the balanced scorecard system is part of the corporate culture. And the organization as a whole should believe that the performance measures being used make sense. And, of course, these measures should be clearly understood by all those whose performance is being evaluated using the balanced scorecard measures (because evidence suggests employees’ often perceive that senior management might manipulate these measures). Furthermore, the data required to make the balanced scorecard methodology effective needs to be validated for relevancy of the performance measures and accuracy. In essence, compensation being a powerful psychological tool, an organization needs to be quite certain that it selects the right metrics for the balance score card and that the data being used to create a link is quite good.
As mentioned previously, many believe that a balanced scorecard methodology is an ideal tool for tying incentive compensation to organizational performance. This is because the balanced scorecard system facilitates clear communication of departmental, divisional, and corporate objectives and expectations, which flow directly from the organization-wide objectives and strategies. The balanced scorecard system’s uniqueness lies in the fact that data from financial and nonfinancial drivers can be incorporated into the balanced scorecard system. So, the balanced scorecard superiority, it is believed, is the fact that all relevant organizational success measures (not just financial) can be used in an effort to improve overall performance, which ultimately will lead to improvement in financial performance.12
12 Atkinson, A.A., Kaplan, R.S., Matsumura, E.M., and Young, S.M; Management Accounting: Information for Decision-Making and Strategy Execution, 6e, 2012, Pearson, Upper Saddle River, NJ.
Before we look at a specific example of tying in incentive compensation to the balanced scorecard system, let’s briefly analyze the balanced scorecard system itself.
A balanced scorecard system is an integrated set of performance standards that directly flow from the organization’s overall strategy. In this system, the company translates overall organizational strategy in terms that can be understood by all levels of employees. In a balanced scorecard system, performance measures usually fall into four categories: financial, customer, processes, and learning and growth. Within each of these categories, the organization needs to define the strategic objectives, the metrics that will be used for performance evaluation, the targets for the chosen metrics, and both the strategic and operational actions required.
Fundamentally, the assumption is that financial measures are lagging measures. The leading measures are customer satisfaction and employee skills based on continual learning and growth. So, if an organization’s employee base is skilled through learning and growth, they then will do what is necessary to satisfy customers. Satisfied customers will buy more from the organization, which will then lead to better financial performance (and hence the reason for the balanced scorecard). Internal processes are what the employees use to satisfy customers. The employees need to be trained to be skilled in the efficient use of internal processes. So, with continuous training, the employees will be motivated to improve the internal processes. Improved internal business processes used by trained and skilled employees is what increases customer satisfaction. The internal processes need to be improved before the final result is improved in financial performance. Continuous improvement is emphasized.
Financial measures are not sufficient in of themselves (but most incentive plans today are mainly centered on financial measures). They need to be integrated with nonfinancial measures in a well-integrated balanced scorecard system. Nonfinancial dimensions are often crucial to improving customer satisfaction. And improved customer satisfaction leads to improved financial performance.
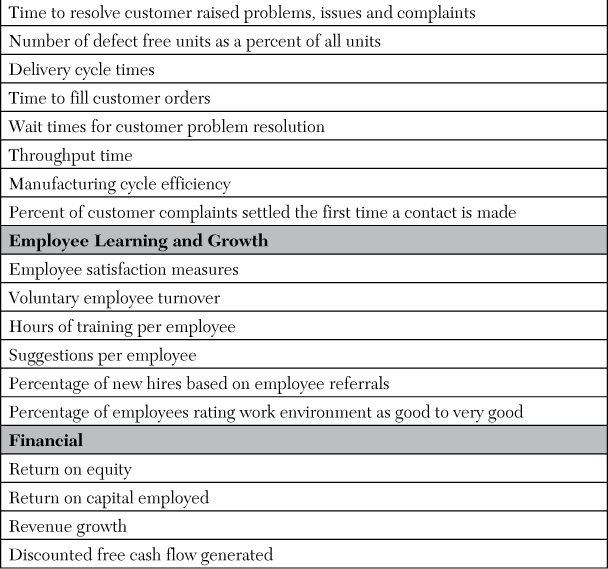
Exhibit 4-8 lists performance metrics typically found in a balanced scorecard system.
Exhibit 4-8. Balance Scorecard Performance Metrics
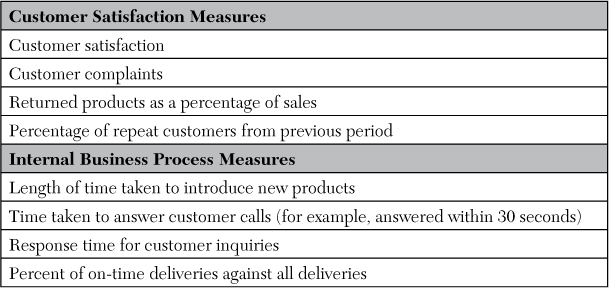
Companies should select performance measures carefully, selecting only those that fit the company’s culture and unique characteristics. First and foremost, the measures selected should be clearly connected to the company’s strategies and objectives. Second, the performance measures should be understandable to all constituents in a clear and concise manner. And finally, an organization should not use too many performance measures in its balanced scorecard.
From these, organization-wide measures, there should be a drill down of measures all the way to the individual level. This drill down exercise is not a trivial task. It will take concerted effort to develop connected balanced scorecard measures all the way down to the individual level. And it will take some time to develop this system for the entire organization and then follow up with a disciplined performance evaluation system built around the balanced scorecard measures. The system needs to be ingrained into the corporate culture, and that takes time. This is why before an organization uses balanced scorecard measures in incentive compensation plans it should first institutionalize the practice of using balance scorecard measures all the way from strategic objectives down to the individual level. And this balanced scorecard operating system should be in use for a while before tying the system to incentive compensation programs.
Each individual should have his or her own personal scorecard. These measures should be those that the individuals themselves can influence and affect. And the individual measures should be connected to the organization’s overall scorecard. The individual needs to perceive as clearly as possible the “the line of sight.” This means that the individual has to perceive that his or her individual efforts can indeed influence the results on the scorecard. They need to know that when their efforts produce positive results on the scorecard measures their individual performance evaluations will reflect such on the scorecard measures. In essence, they expect to receive positive recognition from their superiors for their efforts and actions.
If a balanced scorecard is constructed correctly, the performance measures should be linked on a cause and effect basis. For example, a high-end custom home builder might have a marketing strategy that involves enhancing the customer experience. The company believes that this will result in more sales. This high end custom home builder wants to offer more customized options to enhance the customer experience. In this case, the balanced scorecard process starts at the bottom. To execute the “more options” strategy, the internal processes involved in offering more options and in reducing the time to incorporate an option need to be improved. Along with improving the processes, employee skills in custom building need to be improved through additional training. So, when employee skill and competency enhancement has been addressed, the internal processes to build highly customized luxury homes and the time to build will also have been addressed. Then, customer satisfaction with custom building will improve. Customer satisfaction can be measured through customer satisfaction surveys. And now we can say that because of increasing customer satisfaction the number of expensive highly customized luxury homes sold will increase, and when the number of these custom homes sold increases, the financial numbers will show improvement. Such an integrated process is an example of how a balanced scorecard system works.
Balanced Scorecard and Compensation
As mentioned previously, before an organization considers using the balance scorecard measurement system as the incentive compensation triggering mechanism, the balanced scorecard system has to have been firmly in place as the performance management process for the organization for some time. The target-setting mechanism has to be firmly in place, as well. If these conditions have been met, the incentive compensation plan built around a balanced scorecard can be designed as follows:
• A target incentive compensation payout percentage must be established using salary surveys for each position in the organization. If it is too cumbersome to develop a target for every position, a target can be developed around job groupings, pay-grade levels, or salary bands.
• The target incentive percentage will be paid if the balanced scorecard measurement target is achieved.
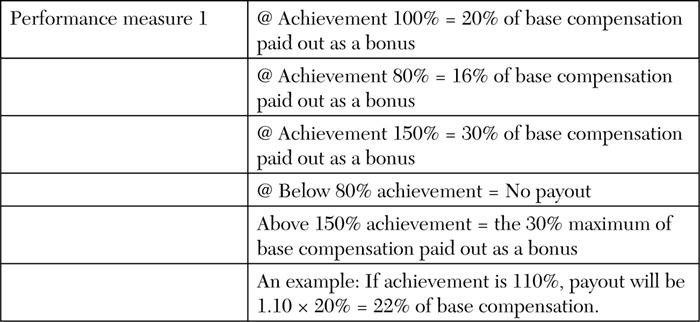
• An incentive compensation payout range can be established (for example, 80% to 150%—80% being the minimum and 150% being the maximum payout levels). If the individual achieves a composite 80% of the balanced scorecard measures assigned, the individual receives 80% of the target incentive. And if he or she achieves 150% of the balanced scorecard measures, that individual receives 150% of the target incentive. Then, between 80% and 100% and between 100% and 150% proration can be done to derive the actual incentive payout. In other words, 80% is the minimum; no incentive will be paid out for performance below 80%. And 150% is the maximum; no incentive will be paid above 150% of the target incentive. The 150% is the ceiling. This ceiling is established to dissuade the establishment of easily accomplished performance measures.
Exhibit 4-9 shows the mechanics.
Exhibit 4-9. Mechanics of a Balanced Scorecard System
When designing these plans, and in the light of financial reasonableness and adequacy, organizations sometimes establish an overall financial budget amount for the incentive program. If all individual payouts added exceed the budgeted amount, then even after the initial individual bonus tabulations have been made a downward recalibration calculation of the individual bonus amounts is made to keep the program within budget.
Note that, as mentioned earlier, tying the balanced scorecard to the organization’s incentive compensation system is an involved and time-consuming process. To start this journey without the combined corporate will and without the wholehearted support of senior management risks failure.
The incentive compensation portion of the total compensation system is growing in significance. As economic uncertainties have plagued organizations over the past few years, many organizations have established incentive compensation programs. Incentive program payouts happen only when success targets are met. In a way, this puts employee pay at risk. Such a pay philosophy is finding acceptance because incentive compensation is directly connected to the organization’s ability to pay. All employee groups, in both service and manufacturing organizations, are adopting these plans.
Incentive compensation is an important element of the total compensation structure. Therefore, it is important that incentive compensation is paid to managers in keeping with the interests of shareholders. Shareholders are keen on companies that increase their financial values period after period over a long term. Shrewd investors look for companies that have sustained value creation. Investors try to avoid companies that are fraught with volatility. Therefore, it is equally important to base executive and manager incentive compensation payouts on value-creation measures such as EVA, intrinsic value, RI. In addition, consideration needs to be given to a balanced scorecard system of organization performance evaluation. In summary, incentive compensation programs make a lot of sense from the finance and accounting point of view.
Key Concepts in This Chapter
• Economic value added
• Residual income
• Free cash flow
• Incentive compensation metrics
• Balanced scorecard and incentive compensation
• Prevalence of incentive compensation programs
• Financial measures used in incentive compensation
• Incentive compensation accounting
• Intrinsic value determination
• Balanced scorecard performance metrics
• Tying the performance measures to incentive compensation payouts
• Types of incentive plans
• Incentive plan circular effect
• Sustaining financial value metrics