

IBM DS8900F Storage Management GUI
This chapter describes the DS8000 Storage Management DS GUI that is available with the IBM DS8900F system. The DS GUI enables you to perform most functions on the storage system, including:
•Initial system setup for a new installation
•Activation of licensed functions
•Simplified and advanced logical configuration for open systems and IBM Z
•Graphical view of system resource availability
•System status and events viewer
•Access to advanced help and IBM Documentation
•Performance monitoring dashboard and statistics offload
•Custom user roles for more robust security of the system
This chapter covers the following topics:
9.1 Introduction
The DS GUI is packed with usability features that offer an easy-to-use interface for administration of the DS8900F.
The DS GUI was designed and developed with three major objectives:
•Speed: A graphical interface that is fast and responsive.
•Simplicity: A simplified and intuitive design that can drastically reduce the time that is required to perform functions with the system, which reduces the total cost of ownership (TCO).
•Commonality: Use of common graphics, widgets, terminology, and metaphors that facilitate the management of multiple IBM storage products and software products. The DS GUI that was introduced with Release 9.0 enables a consistent graphical experience and easier switching between other products like IBM FlashSystem®, IBM Spectrum Virtualize, or IBM Spectrum Control and IBM Storage Insights.
Based on these objectives, following the initial setup of the storage system, a system administrator can use the DS GUI to complete the logical configuration and then prepare the system for I/O. After the initial setup is complete, the system administrator can perform routine management and maintenance tasks with minimal effort, including the monitoring of performance, capacity, and other internal functions.
Logical storage configuration is streamlined in the DS GUI for ease of use. The conceptual approach of array site, array, and ranks is streamlined into a single resource, which is referred to as an array (or managed array). The storage system automatically manages flash adapter pairs and balances arrays and spares across the two processor nodes without user intervention.
Creating usable storage volumes for your hosts is equally simplified in the DS GUI. The system can automatically balance volume capacity over a pool pair. If custom options are required for your workload, the DS GUI can override defaults and customize your workload needs.
Configuring connections to hosts is also easy. Host ports are updated automatically and host mapping is allowed at volume creation.
The overall storage system status can be viewed at any time from the dashboard window. The dashboard presents a view of the overall system performance when a system administrator first logs in for a picture of the system status. This window also contains a “Hardware View” and a “System Health View” that displays the status and attributes of all hardware elements on the system.
Additionally, functions that include user access, licensed function activation, setup of encryption, IBM Fibre Channel Endpoint Security, and remote authentication, and modifying the power or Fibre Channel (FC) port protocols are available to the system administrator.
All functions that are performed in the DS GUI can be scripted by using the DS Command Life Interface (DS CLI), which is described in Chapter 10, “IBM DS8900F Storage Management Command-line Interface” on page 339.
9.2 DS GUI: Getting started
This section describes how to accomplish the following tasks:
9.2.1 Accessing the DS GUI
The DS8000 Storage Management GUI (DS GUI) is a web-based GUI that is installed on the Hardware Management Console (HMC). You can access the DS GUI from any network-attached computer by using a supported web browser. Examples of the minimum levels of the supported web browsers at the time of writing are:
•Mozilla Firefox 68
•Microsoft Edge 44
•Google Chrome 76
For any specific requirements on your browser, see IBM Documentation.
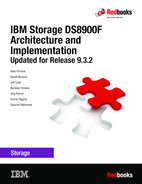
On a new storage system, the user must log on as the administrator. The password expires immediately, and the user is forced to change the password.
The initial view of the system is shown in Figure 9-1.
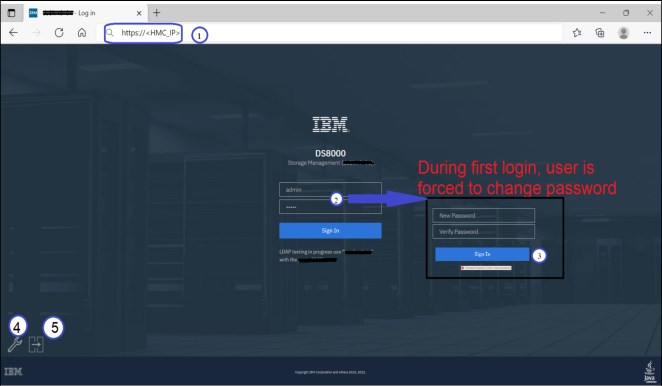
Figure 9-1 Storage Management GUI initial login
Figure 9-1 on page 235 shows the following components:
1. DS GUI URL:
https://<HMC_IP>
This DS GUI URL is configured by the IBM Systems Service Representative (IBM SSR) during system installation.
2. Initial log in to the new system:
– User = admin
– Password = admin
3. The default password expires immediately, and the user is forced to change the password for the admin user ID.
4. IBM Support personnel use the Service Management Console (wrench) icon to log in to the system as needed.
5. Clicking the IBM Copy Services Manager icon opens a window to the IBM Copy Services Manager Console that is installed on the HMC, as shown in Figure 9-2.
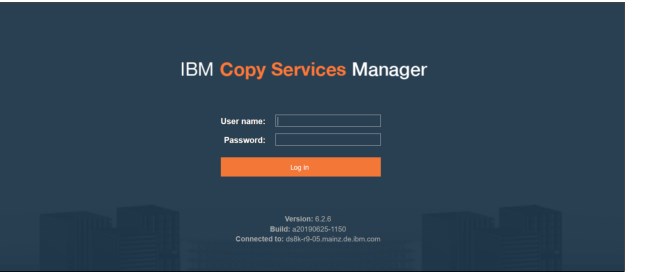
Figure 9-2 IBM Copy Services Manager window started from the DS GUI
9.2.2 System Setup wizard
For a new storage system installation, the DS GUI starts the System Setup wizard. The wizard starts automatically after the admin password is changed and a user with the Administrator role and authority logs in.
The wizard guides the admin user through the following tasks:
1. Set the system name.
2. Activate the licensed functions.
3. Provide a summary of actions.
The System Setup window opens with the Welcome pane, as shown in Figure 9-3.

Figure 9-3 System Setup: Welcome pane
Starting with the Welcome pane, complete the following steps:
1. Click Next. The System Name window opens. The default entry is the storage system serial number, which is shown in Figure 9-4. The user can create a preferred system name that complies with the name convention that is used in the environment.

Figure 9-4 System Setup: System Name window
2. Click Next. The Licensed Functions window opens. Click Activate Licensed Functions.
3. The Activate Licensed Functions window opens. Keys for licensed functions that are purchased for this storage system must be retrieved by using the Machine Type, Serial Number, and Machine Signature. The keys can be stored in a flat file or an XML file. Licensed function keys are downloaded from the data storage feature activation (DSFA) website.
Figure 9-5 shows the Activate License Functions window, the help information, and the activation of the licensed functions. You can import the keys by selecting the Folder icon or paste the keys in the window. For more information about licensed functions, see Chapter 7, “IBM DS8900F features and licensed functions” on page 199.

Figure 9-5 System Setup: Activate Licensed Functions
4. When the license keys are entered, click Activate to enable the functions, as illustrated in Figure 9-6.

Figure 9-6 System Setup: Enabling Licensed Functions
5. Click Next to open the Summary window, which is shown in Figure 9-7. If everything looks correct, click Finish to exit the System Setup wizard. After the wizard is closed, the System window opens.
|
Note: The Summary shows licenses for basic functions. The list might include some advanced functions such as Copy Services (CS), Z Synergy Services (zsS), and IBM Copy Services Manager on HMC if the corresponding licenses were activated.
|
Figure 9-7 System Setup: Summary
9.2.3 Configuring Fibre Channel port protocols and topologies
After the initial setup is complete, you can configure the FC port topologies for your host attachment requirements (open system or IBM Z).
There are several ways to do this task in the DS GUI:
•A quick way to perform this action is by clicking Actions on the Dashboard window and selecting Modify Fibre Channel Port Protocols, as shown in Figure 9-8.

Figure 9-8 Quick way to modify the fiber adapter port protocols
•Another option is to click Settings → Network → Fibre Channel Ports, select a specific port from the list, and select Actions to set the ports, as shown in Figure 9-9.

Figure 9-9 Configuring the Fibre Channel port topology
•You can also configure the port topology from the System view or from the System Health overview, as shown in Figure 9-10.

Figure 9-10 Modifying the FC port protocol from the System Health overview
You can also perform this configuration during logical configuration. For more information, see 9.6.4, “Creating FB host attachments” on page 282, and 9.13, “Monitoring system health” on page 309.
9.3 Managing and monitoring the storage system
When the initial setup of the system is complete, the Dashboard opens. This view is what opens after a user logs in. It displays the main hardware components of the DS8900F system and shows the status of the system hardware, a view of the overall system performance for a quick picture of the system performance, and a summary of the system capacity. You can return to this window at any time by clicking the Dashboard icon in the upper left of the GUI.
|
Note: Different users might have a limited view of the Dashboard when logging in, depending on their role. Most of the material that is documented here describes what the Administrator role sees.
|
From the DS GUI, the administrator can manage the system by performing actions for various activities, such as:
•Logical configuration
•Controlling how the system is powered on or off
•Modifying the FC port protocols and customer network settings
•Modifying Easy Tier settings
•Viewing system properties
•Displaying performance monitoring graphs
•Accessing the embedded DS CLI
•Viewing the status and properties of some CS functions, such as FlashCopy and mirroring
Figure 9-11 presents a high-level overview of the System window and all the objects that can be accessed from this window.
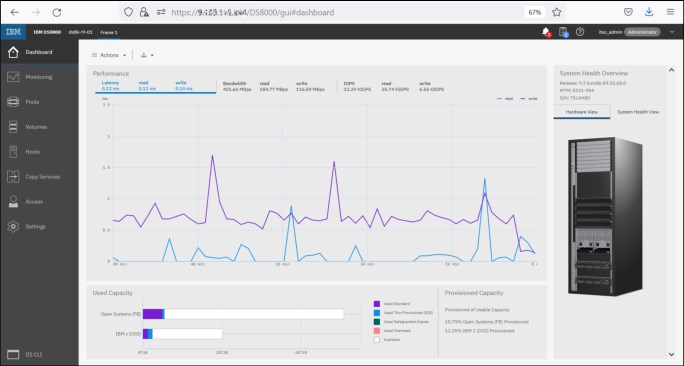
Figure 9-11 Initial System view
|
Note: The menu items and actions that are shown in the DS GUI depend on the role of the user that is logged in, and they can vary for each user. For more information about user roles, click Help at the upper right of the DS GUI window and search for user role.
|
This initial view of the system provides access to a wealth of information in a quick and easy to use view. Items that are included in this initial view are:
•Dashboard icon:
– Click the Dashboard icon from anywhere in the DS GUI to return to the system Dashboard. The Dashboard provides an overall view of the DS8000 system.
– At the top, the serial number of the DS8000 system you are working on is shown.
– Actions menu:
• Rename.
Change the name of the DS8900F storage system.
• Modify Fibre Channel Port Protocols.
Select the protocol that is used by FC ports to connect the storage system to a host or to another storage system. The user can also display the properties of the selected port, which opens the same view that you get when you select Settings → Network → Fibre Channel Ports.
• Power Off/On.
Initiate a power-off or power-on of the DS8000 storage system.
• Performance
Shows graphs that display performance metrics for I/O operations per second (IOPS), Latency, Bandwidth, and Caching.
• Properties.
This view displays the system properties that are shown in Table 9-1.
Table 9-1 System properties
|
System property
|
|
System name
|
|
Current state
|
|
Product type
|
|
Release and bundle version of the IBM system software
|
|
Machine type and model (MTM)
|
|
Unique serial number
|
|
Machine Signature (string of characters that identifies a DS8000 storage system), which is used to retrieve license keys from the DSFA website
|
|
Worldwide node name (WWNN) of the system
|
|
Hardware component summary (such as processor type, total subsystem memory, raw data storage capacity, or number of FC ports)
|
|
Last power-on timestamp
|
– Export reports.
Since Release 9.2, every user role, including Monitor, can download reports such as the System Summary comma-separated values (CSV) report, Performance Summary CSV report, Easy Tier Summary report, and FC Connectivity report. Previously, exporting reports was limited to the Storage Administrator role.
To select multiple options that will be saved in a compressed CSV file, click the Download icon. The options include the System Summary, Performance Summary, Easy Tier Summary, and the FC Connectivity report.
|
Note: The System Capacity section in the System Summary CSV is composed of consolidated data. The System Capacity, Used IBM Z (Count Key Data (CKD)) Capacity, and Used Open Systems (Fixed-Block (FB)) Capacity sections in the System Summary CSV are now combined into one section that is called System Capacity. All sections are now shown with the column headers listed even if there are no items in the list. For example, the FlashCopy section is shown even if no FlashCopy relationships are present on the system.
|
Another enhancement since Release 9.2 is the FC connectivity report, which is a compressed file that contains a report that shows one row for every connected path between the DS8000 and a host system, a switch, or another DS8000. It also shows the status of these paths and their security settings.
– Alerts.
Highlights events at which you should look with priority.
– Suggested tasks.
If there are any suggested tasks, they are indicated here.
– Help icon.
Clicking this icon opens a drop-down menu that includes the following options:
• The first option in this menu is context-sensitive, and it depends on the window in which you are currently in the DS GUI. Clicking this option opens a separate window to the DS GUI IBM Documentation for that specific window, and describes resources and actions for that specific window.
• What’s New: This option provides descriptions of new features that are in the installed release of the GUI with a link to the DS GUI IBM Documentation for each of the new functions. Also provided is a link to learn more about the newest functions.
• Help Contents: This option opens a separate window for the DS GUI
IBM Documentation main window.
IBM Documentation main window.
• About DS8000: This option opens the DS8000 Storage Management window, which shows information that is specific to the system, including code level, product, and machine serial number.
For more information about the DS8900F help functions, see 9.3.1, “Storage Monitoring and Servicing from the Unified Service GUI” on page 248.
– Hardware View.
A graphic of the DS8900F frame is shown.
Hover your cursor over an enclosure, node, HMC, or the processor nodes, and a Properties window opens that shows basic information about that particular component in the frame.
If a magnifying glass icon appears when hovering over a component, click it to bring the component to the center of the window. You can now hover your cursor over the subcomponents to see a Properties window that shows basic information about it. Click anywhere on the window to close the view.
When viewing an FC port on a host adapter within an enclosure, you can right-click a port to modify the FC port protocol and view properties and events.
The following information is typically shown for an enclosure:
• Enclosure.
• ID.
• State, for example, online, offline, or service required.
• Enclosure-specific data.
• Enclosure serial number.
The following information is typically shown for a node:
• ID.
• State, for example, online, offline, and service required.
• DS8900F release.
• Data that is specific to an IBM Power server.
For more information about the Hardware view, see 9.13, “Monitoring system health” on page 309.
– Performance.
This graph displays the performance of the system reads/writes based on latency, bandwidth, or IOPS. Click one of the sections to view the graph.
– System Health Overview.
Clicking this tab opens the System Health Overview in a table format. In addition to displaying the machine type, model, serial number, and microcode level that is installed on the system, this section also shows the overall health status and quantity of various hardware components in the system, including processor nodes, HMCs, storage enclosures, drives, I/O enclosures, host adapters, device adapters (DAs), and FC ports. Clicking each component shows the details for that component in a table. Click Close to exit.
– Capacity.
The capacity area consists of a bar graph displaying the used capacity of the system by type (Open Systems or IBM Z) and unassigned capacity. Next to the bar graph is a legend for each of the colors that are used on the graph. On the right side of this area is the provisioned capacity summary of the system.
•Monitoring menu:
– Events: This option opens the Events window, which displays all of the events in severity order.
– Performance: This option opens the Performance (statistics) window.
• Pools menu:
– Arrays by Pool: Access this view to see all the pools on the system along with the arrays that they contain. Use this view to access actions that can be performed on pools and arrays. This view shows any unconfigured arrays.
– Volumes by Pool: Access this view to see all the pools on the system along with the volumes that they contain. Use this view to access actions that can be performed on pools and volumes.
•Volumes menu:
– Volumes: Access this view to see all the volumes on the system. Use this view to access all actions that can be performed on volumes, such as create, modify, or delete volumes.
– Volumes by Pool: This view is the same one that is described in the Pools menu.
– Volumes by Host: Access this view to see volumes that are based on the host or host cluster to which they are assigned and all volumes that are not mapped to a host. Use this view to access all actions that can be performed on volumes and hosts or host clusters.
– Volumes by LSS: Access this view to see volumes that are based on the logical subsystem (LSS) to which they belong. Use this view to access all actions that can be performed on volumes and LSSs.
•Hosts menu:
– Hosts: Access this view to see all the hosts and host clusters on the system. Use this view to access all actions that can be performed on hosts and host clusters, such as create, modify, or delete hosts or host clusters, and the state of host port logins.
– Volumes by Host: The same view that is described in the Volumes menu.
•Copy Services menu:
– FlashCopy: The FlashCopy window provides details about FlashCopy relationships.
– Mirroring: The Mirroring window provides details and status information about Remote Mirror and Remote Copy volume relationships.
– Mirroring Paths: The Mirroring Paths window displays a list of existing Remote Mirror and Remote Copy path definitions.
•Access menu:
– Users:
Only users with the administrator role can access this menu. This menu opens the Users window. A system administrator can use this menu to perform the following actions:
• Create user accounts.
• Set a user account role.
• Set temporary passwords (to be reset at first use by the new account).
• Modify an existing user account role.
• Reset an existing user account password.
• Disconnect a user account.
• Determine a user account connection (DS CLI or GUI).
• Remove user accounts.
– Roles:
A storage or security administrator can set up user roles in the GUI or CLI with a fully customizable set of permissions to ensure that the authorization level of each user account matches their job role to ensure that the security of the system is more robust against internal attacks or mistakes. The following actions can be taken against roles:
• Create custom user roles.
• Modify remote mappings.
• Delete roles.
|
Restriction: Default roles cannot be deleted.
|
• View permissions for each role.
• View properties for each role.
– Remote Authentication.
This menu allows the user to set up remote authentication through a central repository.
•Settings menu:
– Network:
• Modify the FC ports protocol for a selected port or group of ports.
• Display error rates for a selected port or group of ports.
• Display a single port’s properties.
• View the current Ethernet network information and change settings for both HMCs.
– Security:
• Manage encryption for the storage system, that is, data at rest encryption and
IBM Fibre Channel Endpoint Security.
IBM Fibre Channel Endpoint Security.
• Manage local password rules (such as password minimum length, expiration, and age).
• Manage the communication certificate on the HMC to enable HTTPS connections with the HMC.
– System:
• Licensed Function.
This window shows a summary of the activated licensed functions. When you click the Activate option, the Activate Licensed Functions window opens, where you can activate more licenses. For a full description about activating licensed functions, see Chapter 7, “IBM DS8900F features and licensed functions” on page 199.
• Easy Tier.
You can use this function to enable and configure Easy Tier to improve performance by managing or monitoring the volume capacity placement in pools. The Easy Tier Heat Map Transfer Utility (HMTU) can also be enabled.
• zHyperLink.
You can use this function to enable or disable the zHyperLink as I/O Read Enabled and I/O Write.
• Date and Time.
Set the time zone and set the date and time manually for the system or enter the IP address of a Network Time Protocol (NTP) server.
• Advanced.
On the Advanced tab of the System settings window, you can allow service access, enable ESSNet CS, set the IBM i serial number prefix, enable control-unit initiated reconfiguration (CUIR) for IBM Z, and select the power control mode for the storage system. In addition, you can manage service settings and work with other settings for your system.
– Notifications:
• Call Home.
You can enable Call Home on your Management Console (MC) to send an electronic Call Home record to IBM Support when there is a problem within the storage complex.
• Syslog.
You can define, modify, or remove syslog servers. You can also enable extra security with Transport Layer Security (TLS) for the syslog.
– Support:
• IBM Remote Support Center (RSC).
You can configure RSC to allow IBM Support to remotely access this system to quickly resolve any issues that you might be having. You can choose that the RSC connection stays open always, close 2 hours after IBM support is logged off, or closed. For added security, you can require an access code for remote support.
• Assist On-site.
You can configure the Assist On-site (AOS) feature, which allows IBM Support to remotely access the MC and storage system. Choose an option to stop, start, or restart the AOS service.
• Troubleshooting.
You can restart the local or remote HMC to correct communication issues between the storage system and HMC.
You can refresh the GUI cache if the data in the Storage Management GUI is not in sync with data in the DS CLI or IBM Spectrum Control.
You can restart the web servers and communication paths that are used by
IBM Enterprise Storage Server Network Interface (IBM ESSNI).
IBM Enterprise Storage Server Network Interface (IBM ESSNI).
– GUI Preferences:
• Login Message.
You can enter a message that is displayed when users log in to either the DS GUI or an interactive DS CLI session.
• General.
You can set the default logout timeout and chose to show suggested tasks.
•Embedded DS CLI.
Click the Embedded DS CLI icon to open a DS CLI session from within the DS GUI, as shown in Figure 9-12. The version of embedded DS CLI is the most current one that is available for the microcode that is installed on the DS8900F.
The DS CLI commands can be run conveniently from the GUI with the least amount of response time by avoiding network hops when using remote DS CLI.
DS CLI scripts can also be run from the embedded DS CLI on the DS GUI. The script must be text-based and on the workstation running the DS GUI session.

Figure 9-12 Embedded DS CLI
9.3.1 Storage Monitoring and Servicing from the Unified Service GUI
The Unified Service GUI, shown in Figure 9-13 on page 249, provides access to all service functions and tools. Before Release 9.2, all these features were available for use only through the Service Web User Interface (WUI) on the HMC. All these functions help IBM Support representatives perform specific tasks like data collection, event management, miscellaneous equipment specification (MES), model conversions, and microcode and hardware upgrades.
|
Important: This Unified Service GUI should be accessed by IBM Support representatives or under the supervision of IBM support representatives only.
|
Service Dashboard was a recent add-on to the DS8900F GUI after Release 9.2. Service Dashboard is accessible by an IBM service role privilege user only on the DS8900F GUI.
All functions in the service dashboard are added from the WUI. The categorization and functions of each attribute under the service dashboard perform functions like under the WUI, which provides ease of management and more privilege to customers. These functions are still available through WUI and HMC access, but they are added to the DS8900F GUI interface too.
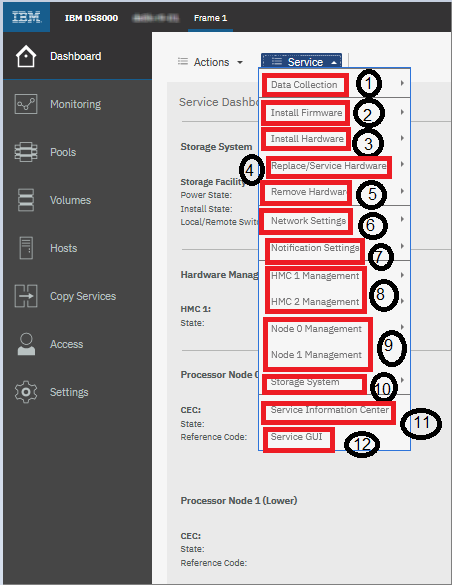
Figure 9-13 Unified Service GUI
1. Data collection:
a. Perform Data collection on Demand: With this option, you can generate and offload the existing complete PE package with different formats.
i. General PE Package: Collects data for any service actions, such as installation or removal, MES, repair, and code load. This package contains the data of reliability, availability, and serviceability (RAS) and functional code components (not including state saves).
ii. Client User Interface (ESSNI, DS GUI, or API) Package: Collects data for problems that originate from using customer user interface applications, such DS GUI. This package contains the data of various software components running on HMC, such as DS GUI, ESSNI, and RESTful APIs. DS CLI traces are not on the HMC.
iii. All data packages for removable media offload only option: Collects both the PE packages and off loads the data to removable media.
b. Offload Data by Area: With this option, you can download an area package of any of the following line items. This option is intended only as a substitute for the “PE Package/ Full Data collection On-Demand” function. Many of the listed items contain duplicate data. If you require more than one or two of these items, then it is a best practice to cancel this function and use the “PE Package /Full Data collection on-demand” function.
i. ESSNI.
ii. DEVICE Object Mismatch.
iii. Panics.
iv. Failed Service Action (Repair).
v. CDA.
vi. Logical configuration Errors.
vii. Machine Down (HMC still up).
viii. FCIC Loop Issues.
ix. MES Power/Cache.
x. MES Storage Enclosure.
c. Individual file offload: With this option, you can off load the selected file from the storage facility image. When prompted by IBM Support personnel, service users off load the required files from the different components of the storage facility image like from HMC or the LPARs.
d. Manage Dumps: With this option, you can generate and manage the individual dumps from the physical server (CPC).
e. Process state saves and OnDemand Data Dump (ODD) dumps:
i. Process LPAR State Saves: With this option, you can generate new state saves for the storage facility image or offload the existing state saves for troubleshooting purposes when prompted to do so by IBM Support personnel.
ii. Process LPAR ODD DUMPS: With this option, you can generate an ODD for the storage facility or off load the existing data dump for troubleshooting purposes when prompted to do so by IBM Support personnel.
iii. Process LPAR Lightweight ODD Dumps: With this option, you can generate lightweight data dumps for the LPARs, or a user can offload the existing lightweight dump for troubleshooting purposes when prompted to do so by IBM Support personnel.
f. Process Device Adapter and POST State Saves: With This option, you can generate state saves for the HA and DA adapter, or a user can offload the existing state saves for troubleshooting purposes when prompted to do so by IBM Support personnel.
g. Process Storage Enclosure State Saves: With this option, you can generate state saves for the selected storage enclosure with offloading the state saves data.
h. Process Drive State Saves: With this option, you can generate state saves for the selected disk drive module (DDM) by offloading the state saves data.
2. Install firmware: This option was available in the WUI console under the updates option. Under the Updates window, you can find the similar functions under the Install Firmware section in the DS8900F GUI service dashboard.
a. Verify Bundle Installed: Validates and lists the Active Firmware version of all components in the storage facility from the selected bundle’s expected firmware.
b. Display Storage Facility Code Levels: Displays the Active Firmware version of all components in the storage facility.
c. Display Preload Status: Lists the status of any preloads.
d. Run CDA Preverify: Performs a full system scan to validate all things are working as expected. Generates the logs.
e. Acquire Code bundle: This function was available while selecting the HMC. With it, you can acquire the new release code that is available through the HMC by using a CD-ROM or an FTP server.
f. Enable/Disable File server: Enables and disables the file server capabilities on the HMC, which allows a Remote File Download Client request.
g. Remote file Download: Activates the file server capabilities on the designated HMC IP address.
h. Update HMC code: Updates the HMC code from downloaded code in the HMC.
i. Update Storage Facility Code: A service user can select the available facility code and either Distribute only, Activate only, or both.
j. Select and Install corrective Services: With this option, you can install code add-ons for certain components.
k. ICS Utilities.
l. Prepare HMC Upgrade: Selects the recovery image for HMC for an upgrade activity. After a restart, the HMC begins the upgrade.
m. Rebuild Peer HMC: Rebuilds the Peer HMC.
n. Advanced Utilities:
i. Advanced configuration, Install Corrective Service, Display Library Contents, Clear Library Contents, Delete Release Bundle and Package, and Delete a Recovery Image.
ii. Display/Update Bootlist image & Reverse eServer Firmware is available in the WUI update section under the HMC in Backlevel utilities, and in the DS8900F GUI under Advanced Utilities.
iii. Display/Reset CDA SFI attributes & Reset Serviceable Event Tracking is available in the WUI update section under HMC in Miscellaneous utilities, and in the DS8900F GUI under Advanced Utilities.
o. CCL Utilities: With concurrent code load, you can perform CCL I/O Enclosure, IBM Power firmware, and storage enclosure updates.
p. Non-concurrent code load (NCCL) Utilities: You can perform NCCL for the following components:
i. NCCL SFI code Activation Single LPAR: No IML, NCCL SFI code Activation Single LPAR – Resume, and NCCL SFI code Activation Single LPAR – Start CPSS.
ii. NCCL eServer firmware update, NCCL eServer firmware Single Node Update, NCCL I/O Enclosure firmware update, and NCCL Power firmware update.
iii. NCCL SFI Code Activation: IML, and NCCL SFI Code Activation – NO IML.
3. Drive Utilities: You can perform Display Drive Code Levels, Display Drive Update Status, Run Drive Pre-verify, CCL Update Drive Code Level, NCCL Update Drive Code Level, and Terminate Drive Update on Drives.
4. Install Hardware: With this option, you can use the hardware component installation assistance wizard:
a. Storage Facility Field Install.
b. Generate Install Report: This section is available under th Storage facility Management section in the WUI interface.
c. View/Certify Drive: View and certify installed drives.
d. You can install the option Open wizard to help with the installation or MES upgrade of the following items:
i. Install I/O Enclosure or Components.
ii. Install Rack Power Components.
iii. Install Storage Enclosure or Drives.
iv. Install Expansion Rack.
e. Storage Facility Conversion: With this option, you can do a model conversion.
5. Replace service Hardware: Replace or service hardware components like I/O enclosures, storage enclosures, CPCs, and racks:
a. Manage Serviceable Events: View details or close open events. Available under the Service management section of the WUI.
b. Exchange CEC Components: A wizard helps to exchange the CPC component.
c. Exchange I/O Enclosures and Components: A wizard helps to exchange the I/O enclosures and components.
d. Exchange Rack Components: A wizard helps to exchange the rack components.
e. Exchange Storage Enclosures and Components: A wizard helps to exchange storage enclosures.
f. Manage field-replaceable units (FRUs).
g. Activate/Deactivate Resources: Power supply and Remote Procedure Call (RPC).
6. Remove Hardware: This feature should be used during an RPQ or next-level support supervision. These wizards help to remove the following listed devices:
a. Remove CPC Enclosure or Components.
b. Remove I/O Enclosure or Components.
c. Remove Storage Enclosure or Drives.
d. Remove Expansion Rack.
7. Network Setting: Manage or perform changes in the HMC IP address:
a. Query/Change IP Address Range.
b. Convert SFI To Static IP
c. Test Network Connectivity.
d. View the Network Topology.
8. Notification setting: Manage notification settings:
a. Test Problem Notification.
b. Transmit Service Information.
c. Manage Serviceable Event Notification.
d. View or Change Heartbeat Configuration.
9. HMC1 & HMC2 Management: Manage and change the HMC:
a. View Management Console Events.
b. Backup Critical Data.
c. HMC Rebuild and Recovery.
d. Save Upgrade Data.
e. Re-harvest HMC Vital Product Data (VPD).
f. Query Activate/HMC Role Selection.
g. Add Managed System.
h. Discover Storage Facility.
i. Format Media.
j. List Files on Removable Media.
10. Node0 & Node1 Management: Manage and change the Node, controller, or servers:
a. Set No-rsStart.
b. Reset No-rsStart.
c. Launch Advanced System Management (ASM).
d. AIX Command Processing.
e. Change/Show LPAR State.
f. CEC Power Control.
g. Display CEC Drive Status.
h. Rebuild CEC Hard Drive.
i. Advance Utilities:
i. Open Terminal Window.
ii. Close Terminal Window.
iii. Backup Partition Profile.
iv. Restore Partition Profile.
v. Rebuild Managed System Information.
vi. Service Processor Status.
vii. Rest or Remove Connections.
viii. Reference code History.
ix. View License.
x. Identify LED.
xi. Test LED.
11. Storage System: Manage and change the storage facility:
a. View Storage Facility State.
b. Reset Service Intent.
c. PCIe Graphic Analysis.
d. Change/Show SFI State.
e. View/Change Processor and Memory Allocation (Variable Image).
f. Secure Data Overwrite.
g. Discontinue Storage Facility.
h. Advanced Utilities:
i. View/Reset Attention Indicators.
ii. View Device RM Harvest Phase.
iii. View Hardware Topology.
iv. View Storage Facility Power Status.
v. View Storage Facility Resources States.
12. Service Information Center: Open the service information center.
13. Service GUI (WUI): Open the WUI/HMC console.
9.3.2 Storage Management help functions
The DS GUI provides access to comprehensive help functions. The help functions help you use the GUI and provide in-depth details about the overall DS8000 Storage System and its functions. To access the help contents, click the Help icon, and then select Help Contents to open a separate window, as illustrated in Figure 9-14.

Figure 9-14 Storage Management Help System: IBM Documentation
In IBM Documentation, you can discover introductory information about the DS8900F architecture, features, and advanced functions. You can also learn about the available management interfaces and tools, and troubleshooting and support.
You can obtain more information about using the DS GUI for common tasks:
•Logically configuring the storage system for open systems and IBM Z attachment
•Managing user access
•Attaching host systems
IBM Documentation also provides links to external links for more information about
IBM storage systems, and other related online documentation.
IBM storage systems, and other related online documentation.
For more information, see IBM DS8900 documentation.
9.4 System configuration overview
After the DS8900F administrator configures the initial system, the administrator can configure extra system functions according to the storage requirements.
9.4.1 Network settings
You can change the customer network settings for the DS8900F on the tabs that are described in the following sections.
Ethernet Network
The network settings for both HMCs are performed by IBM Support personnel during system installation. To modify the HMC network information postinstallation, click Settings → Network → Ethernet Network, as shown in Figure 9-15.

Figure 9-15 Ethernet Network settings
Fibre Channel ports
From the Fibre Channel Ports tab of the Network Settings window, which is shown in Figure 9-16 on page 256, you can configure the protocol that is used by the FC ports or view the properties of those ports:
•Modify Protocol
Set the protocol that is used for connecting to a host or another storage system.
•Modify Endpoint Security
Set a new IBM Fibre Channel Endpoint Security level: Disable, Enable, or Enforced.
•Refresh Security
Port refresh causes the port to be taken offline for a few seconds and put back online.
•Logged in WWPNs
Select this option to view details about connections that are logged in to an FC port.
•Error Rates
View the error rates of an FC port. For more information, see 9.15, “Fibre Channel error rate statistics” on page 336.
•Performance
Use this option to view graphs showing key performance metrics for FC ports, such as IOPS, Latency, and Bandwidth. For more information, see “Creating FC port performance graphs” on page 332.
•Properties
View the properties of an FC port, such as the state and protocol.
•Export Fibre Channel Ports information
Click the Download icon next to the Actions menu to create and download a CSV file that contains all the information for FC ports that are shown in the file, including their worldwide port names (WWPNs).
Figure 9-16 shows the FC ports window with all available options that are listed.

Figure 9-16 Fibre Channel Ports settings
|
Note: Exporting the FC port information does not produce the comprehensive report that is available in the FC connectivity report.
|
9.4.2 Security settings
To protect and safeguard data on the system, the DS8900F offers the following encryption features:
•Data at rest encryption: Disk-based encryption on the flash drives is combined with an enterprise-scale key management infrastructure to encrypt the data at rest in the drives.
•IBM Fibre Channel Endpoint Security: Protects data in flight between an IBM Z host and the DS8900F storage system by controlling access and encrypting data that is transferred over a storage area network (SAN).
•Local password rules to accommodate any specific company imposed rules for password assignments.
•Communications certificate on the HMC to enable HTTPS connections with the storage system.
Use these settings to configure the security settings for your DS8900F system.
Data-at-rest encryption
To enable data-at-rest encryption, select the Settings icon from the DS GUI navigation menu on the left. Click Security to open the Security window, and click the Data at Rest Encryption tab, as shown in Figure 9-17 on page 257.

Figure 9-17 Enabling data-at-rest encryption
You can define a custom certificate for communication between the encryption key servers (typically IBM Security Guardium Key Lifecycle Manager) and the storage system.
A system-generated Gen-2 (National Institute of Standards and Technology (NIST) SP 800-131a compliant) or Gen-3 certificate can be updated to a customer-generated certificate. The custom certificate must meet all the requirements or the update fails.
|
Important: If you plan to activate data-at-rest encryption for the storage system, ensure that the encryption license is activated and the encryption group is configured before you begin any logical configuration on the system. After the pools are created, you cannot disable or enable encryption.
If the DS8900F was ordered with the Local Key Management feature, then the DS8900F manages the key group. Local Key Management can be set up only by using the DS CLI. For more information, see IBM DS8000 Encryption for Data at Rest, Transparent Cloud Tiering, and Endpoint Security (DS8000 Release 9.2), REDP-4500.
|
IBM Fibre Channel Endpoint Security
IBM Fibre Channel Endpoint Security protects data in flight between an IBM Z host and the DS8900F storage system by controlling access and encrypting data that is transferred over a SAN. For more information about IBM Fibre Channel Endpoint Security, see IBM Fibre Channel Endpoint Security for IBM DS8900F and IBM Z, SG24-8455.
To enable IBM Fibre Channel Endpoint Security, select the Settings icon from the DS GUI navigation menu on the left. Click Security to open the Security window, and click the Fibre Channel Endpoint Security tab, as shown in Figure 9-18.

Figure 9-18 Configuring IBM Fibre Channel Endpoint Security
Local password rules
Many companies have their own security policies for passwords, and want to implement the same policies for their DS8900F storage system.
To implement password rules, complete these steps (see Figure 9-19):
1. From the system window, click the Settings icon.
2. Click Security to open the Security window.
3. Click the Local Password Rules tab.

Figure 9-19 Local Password Rules
Communications Certificate
The Communications Certificate tab of the Security Settings window can be used to assign or create an encryption certificate for each HMC with HTTPS connections to the storage system. You can also create certificate signing requests (CSRs), import existing certificates, create self-signed certificates, and view the certificate information for each HMC, as shown in Figure 9-20.

Figure 9-20 Communication Certificates
The Create Certificate Signing Request button is used to generate a CSR that is sent to a certificate authority (CA) for verification. As shown in Figure 9-21 on page 259, the necessary information to include in the CSR are the HMC fully qualified domain name (FQDN), organization details, the length of time that the certificate must be valid, and an email address.

Figure 9-21 Certificate signing request
After the CSR file is created, you can download that file for processing with your trusted CA.
The extra two options that are available here for secure communications to the DS8900F system are to import an already provided CA certificate from your security group within your organization, or to create a self-signed certificate.
9.4.3 System Settings
The next option under Settings is System, which includes system settings for Licensed Functions, Easy Tier, zHyperLink, Date and Time, and Advanced.
Licensed Functions
You can display all the installed licensed functions and activate new function keys from this menu, as shown in Figure 9-22.

Figure 9-22 Licensed Functions settings
Easy Tier settings
To configure Easy Tier controls and advanced settings on your DS8900F system, select the Settings icon from the navigation menu on the left. Click System to open the System window, and click the Easy Tier tab to open the Easy Tier Settings window, as shown in Figure 9-23.

Figure 9-23 Easy Tier Settings
The following settings are available:
•Easy Tier mode: The available options are Enable, Tiered pools only, Disable, Monitor only, or Disable. When this setting is configured to enable, Easy Tier monitors I/O activity for capacity in all pools, and manages capacity placement within them.
•Easy Tier Heat Map Transfer (HMT): Use this setting to maintain application-level performance at the secondary site of a DS8000 by transferring the Easy Tier information to the secondary site.
•Easy Tier Allocation order: Specify the allocation order that is used by Easy Tier to select the drive classes when allocating capacity in a pool.
•Easy Tier Automatic mode acceleration: Use this setting to temporarily accelerate data migration by Easy Tier.
For more information about Easy Tier settings, see IBM DS8000 Easy Tier (Updated for DS8000 R9.0), REDP-4667.
zHyperLink
zHyperLink is a short-distance link technology that complements Fibre Channel connection (IBM FICON) technology to accelerate I/O requests that are typically used for transaction processing. It consists of point-to-point connections for random reads and writes, and provides up to 10 times lower latency than High-Performance FICON for IBM Z (zHPF). You can set it to Enabled, I/O Read Enabled, I/O Write Enabled, or Disabled, as shown in Figure 9-24.

Figure 9-24 zHyperLink settings
|
Note: To take advantage of zHyperLink in DS8000, ensure that CUIR support (under
IBM Z) is enabled. |
For more information, see Getting Started with IBM zHyperLink for z/OS, REDP-5493.
Date and Time
You can enter the date and time manually, or specify an external NTP server to provide the date and time, as shown in Figure 9-25.

Figure 9-25 Date and Time settings
Advanced settings
From the Advanced tab of the System Settings window, you can configure system-wide options, such as power management, CS, IBM Z features, and the DS Open application programming interface (API).
The Advanced settings window is shown in Figure 9-26.

Figure 9-26 Advanced settings
•Power control mode
You can determine how to control the power supply to the storage system. From the System window, click the Settings icon. Click System to open the System window. Click the Advanced tab to open the window to manage Power control mode (as shown in Figure 9-26 on page 262). The following options are available:
– Automatic: Control the power supply to the storage system through the external wall switch.
– Manual: Control the power supply to the storage system by using the Power Off action on the System window.
•Function settings
The Resource Group Control option is available in the Function Settings section. It allows a storage administrator to specify which users can perform certain logical configuration actions, such as create or delete volumes in a pool.
•Service Access
The following options are available in the Service Access section:
– DS Service GUI Access.
Allows authorized IBM SSRs to access the DS Service GUI.
– SSH Service Access.
Allows authorized IBM SSRs to access the Secure Shell (SSH) CLI on the HMC.
•IBM i
The following option is available in the IBM i section:
IBM i serial number suffix: Enter the IBM i serial number suffix to avoid duplicate logical unit number (LUN) IDs for an IBM i (AS/400) host. Restart the storage system to assign the new serial number.
•IBM Z
The following option is available in the IBM Z section:
CUIR Support: Enables control unit initiated reconfiguration. This option allows automation of channel path quiesce and resume actions during certain service actions. It eliminates the requirement for manual actions from the host.
•Other settings
The following options are available in the Other Settings section:
– ESSNet CS.
Enables the ESSNet user interface to manage CS on the storage system.
– ESSNet volume group.
Selects the ESSNet user interface to manage the volume group with CS.
– Host precheck.
Enables FB and CKD volume delete protection.
– Device Threshold.
Sets the threshold level for IBM Z at which the system presents a service information message (SIM) to the operator console for device-related errors. Device threshold levels are the same type and severity as control unit threshold settings:
• 0: Service, Moderate, Serious, and Acute (all)
• 1: Moderate, Serious, and Acute
• 2: Serious and Acute
• 3: Acute
– Full Page Protection.
Enables the ability to ensure that the atomicity of a database page-write is maintained.
– PPRC Path Recovery.
Enables the storage system to monitor PPRC paths for signs of failure. If a path fails, it is placed into a degraded state in which it is used minimally until the problem stops. If this setting is disabled, paths are never put into a degraded state.
– Present SIM data to all hosts.
Enables SIMs to be sent to all or to only the first attached IBM Z logical partition (LPAR), and makes an I/O request to the logical system or logical volume. This setting applies to IBM Z environments only.
– Enhanced Information Unit Pacing.
Enables increased write performance of large writes at long distances and improvement of z/OS Global Mirror (zGM) initial copy performance because the channel can send more read track commands to the primary storage system.
•Automatic code management
Automatically download and preinstall the recommended code level to update the code level. The default setting is Enable.
•Service settings
You can view the service settings but they cannot be changed.
9.4.4 Notifications settings
You can configure and manage Call Home and Syslog settings for the system from the DS GUI by selecting Notifications from the Settings menu, as shown in Figure 9-27.

Figure 9-27 Notifications Settings window
Call Home
The DS8900F uses the Call Home feature to report serviceable events to IBM. To ensure timely action from IBM Support personnel for these events, it is important to enable and properly configure Call Home on the system.
When enabling Call Home for the first time, you must accept the Agreement for Service Program when presented. Enter your Company Information, Administrator Information, and System Information details. Finally, after completing the setup, you can test the Call Home feature by clicking Test, as shown in Figure 9-27 on page 264.
Syslog
The Syslog window displays the syslog servers that are configured to receive logs from the DS8900F system. A user with an administrator role can define, modify, or remove up to eight syslog target servers. Each syslog server must use the same TLS certificate. Events such as user login and logout, commands that are issued by an authorized user by using the DS GUI or DS CLI, and remote access events are forwarded to syslog servers. Additionally, events in the RAS audit log and Product Field Engineer (PFE) actions are also forwarded to the syslog servers. Messages from the DS8900F are sent by using facility code 10 and severity level 6.
To configure one or more syslog servers, complete these steps:
1. Click Settings → Notifications.
2. On the Notifications window, select Add Syslog Server. You receive a warning to enable TLS first before adding any syslog server, as shown in Figure 9-28.

Figure 9-28 Warning to enable TLS
|
Note: A DS8900F server must use TLS for its communications with the syslog server. To configure TLS, the customer must generate their own trusted certificate for the DS8900F syslog process with the CA and import the trusted CA file, signed machine (in this case the HMC and syslog process) syslog server certificate file, and key file, as shown in Figure 9-29.
For more information about the setup of the SYSLOG server with TLS, see Encrypting Syslog Traffic with TLS (Secure Sockets Layer) (SSL).
The process involves external entities such as your trusted CA and potentially the use of the openssl command to retrieve the syslog server generated key if it is not already provided by the CA.
The files that are entered into the fields that are shown in Figure 9-29 are:
•CA Certificate (ca.pem)
•HMC Signed Certificate (cert.pem)
•HMC Key (key.pem)
|

Figure 9-29 Enable TLS window
4. In the Enable TLS window, browse for the following certificate files on your local machine:
– The CA certificate file (Example: ca.pem).
– The syslog communications certificate file, which is signed by the CA. (Example: hmc.pem).
– The extracted Private Key file, which is the private key for the storage system. (Example: key.pem).
5. Click Enable to complete the TLS configuration.
6. To add a syslog server, click Add Syslog Server, as shown in Figure 9-30, and provide the following parameters:
– IP Address: The IP address of the external syslog server.
– Port: The TCP port for the external syslog server (the default is 514).
7. After you review the details, click Add to create the syslog server entry.

Figure 9-30 Syslog settings window
8. After the required syslog servers are created, you can Modify, Test, Activate, Deactivate, and Remove a selected syslog server, as shown in Figure 9-31.
|
Note: To enable TLS, all existing syslog servers must be deleted first. Then, you can enable TLS and create the syslog servers.
|

Figure 9-31 Modify Syslog configuration
9.4.5 Support settings
Use this section to configure various support settings.
IBM Remote Support Center
On the Support settings window, you can configure service access to the HMC to allow RSC to access the HMC for problem determination, as shown in Figure 9-32.

Figure 9-32 IBM Remote Support Center settings
You can configure the RSC access to stay open continuously, close 2 hours after RSC logs off, or keep it closed. You can require IBM service to use an access code for remote support connections with the HMC on your storage system. Click Generate to generate an access code or enter your own access code. The access code is case-sensitive and must be fewer than 16 characters.
To configure the RSC, click Show Full Configuration. You can select the connection type, define your proxy information, and Offload Logfile. Offload Logfile downloads the RSC log file, which lists events and actions for the storage system. Select Enable debug mode to generate detailed RSC log files. IBM Service Systems lists the IP addresses of the RSC servers that you must configure your firewall to allow access to these addresses.
Assist On-site
If AOS is used for an IBM Support connection to the HMC, you can Start, Stop, or Restart the AOS service from the GUI, as shown in Figure 9-33.

Figure 9-33 AOS settings and full configuration
To configure AOS, click Show Full Configuration and enter the required settings, as shown in Figure 9-33.
Troubleshooting
Use the Troubleshooting tab to perform actions that resolve common issues with your storage system:
•Restart HMCs
If there are connectivity issues with the storage management software (DS GUI, DS CLI, IBM Copy Services Manager, or IBM Spectrum Control), click Restart HMC. You can also use this feature to restart an HMC after you modify the settings of the HMC.
•Refresh GUI Cache
If there are inconsistencies between what is displayed in the DS GUI and the DS CLI or IBM Spectrum Control, click Refresh GUI Cache.
•Reset Communications Path
To restart the web servers and communication paths that are used by IBM ESSNI, click Reset Communications Path.
Figure 9-34 shows the Troubleshooting tab.

Figure 9-34 Troubleshooting tab
GUI Preferences
Use the GUI Preferences tab that is shown in Figure 9-35 to set the following options for the DS GUI:
•Login Message
With an administrator role, you can enter a message that is displayed when users log in to either the DS GUI or the DS CLI.
•General GUI settings
On the General tab of the GUI Preferences window, you can set the default logout time for the DS GUI.

Figure 9-35 Login message
9.5 Logical configuration overview
The logical configuration of the DS8900F storage system begins with managed arrays and the creation of storage pools.
When the storage pools are created, arrays are first assigned to the pools, and then volumes are created in the pools. FB volumes are connected through host ports to an open system host. CKD volumes require LSSs to be created so that they can be accessed by an IBM Z host.
Pools must be created in pairs to balance the storage workload. Each pool in the pool pair is controlled by a processor node (either Node 0 or Node 1). Balancing the workload helps to prevent one node from performing most of the work and results in more efficient I/O processing, which can improve overall system performance. Both pools in the pair must be formatted for the same storage type, either FB or CKD storage. Multiple pools can be created to isolate workloads.
When you create a pool pair, all available arrays can be assigned to the pools, or the choice can be made to manually assign them later. If the arrays are assigned automatically, the system balances them across both pools so that the workload is distributed evenly across both nodes. Automatic assignment also ensures that spares and device adapter (DA) pairs are distributed equally between the pools.
If the storage connects to an IBM Z host, you must create the LSSs before you create the CKD volumes.
It is possible to create a set of volumes that share characteristics, such as capacity and storage type, in a pool pair. The system automatically balances the capacity in the volume sets across both pools. If the pools are managed by Easy Tier, the capacity in the volumes is automatically distributed among the arrays. If the pools are not managed by Easy Tier, it is possible to choose to use the rotate capacity allocation method, which stripes capacity across the arrays.
When you plan your configuration with the DS8900F, all volumes, including standard provisioned volumes, use metadata capacity when they are created, which causes the usable capacity to be reduced. The 1 (gibibyte) GiB extents that are allocated for metadata are subdivided into 16 mebibyte (MiB) subextents. The metadata capacity of each volume that is created affects the configuration planning.
If the volumes must connect to an IBM Z host, the next steps of the configuration process are completed on the host. For more information about logically configuring storage for IBM Z, see 9.7, “Logical configuration for Count Key Data volumes” on page 292.
If the volumes connect to an open system host, map the volumes to the host, and then add host ports to the host and map them to FC ports on the storage system.
FB volumes can accept I/O only from the host ports of hosts that are mapped to the volumes. Host ports are zoned to communicate only with certain FC ports on the storage system. Zoning is configured either within the storage system by using FC port masking, or on the SAN. Zoning ensures that the workload is spread correctly over FC ports and that certain workloads are isolated from one another.
Host configuration is simplified by the DS8900F microcode. Host ports are now automatically updated and host mappings can be performed during the volume creation step of the logical configuration. In addition, host port topology can be safely changed by using the DS GUI and DS CLI. New host commands are available for DS CLI to make, change, delete, list, and show a host connection. For more information, see Chapter 10, “IBM DS8900F Storage Management Command-line Interface” on page 339.
|
Note: Deleting a pool with volumes is available in the GUI. A warning is displayed, and the user must enter a code that is presented by the DS8900F to confirm the delete. A “force deletion” option is also available. For more information, see Figure 9-88 on page 306.
|
9.6 Logical configuration for open systems volumes
This section describes the logical configuration for Fixed-Block (FB) volumes for open systems hosts. It covers the following topics:
•Simple open systems (FB) logical configuration flow
•FB pool creation
•Quick FB volume creation
•Advanced FB volume creation
•Creation and connection of FB volumes to the open systems hosts
9.6.1 Configuration flow
The following steps provide an overview of the steps that are needed for logical configuration of FB volumes:
1. Create an FB pool pair for open systems hosts.
2. Create the FB volumes.
3. Map to the open system hosts.
9.6.2 Creating FB pools for open systems hosts
For best performance and a balanced workload, create two pools. The DS GUI helps the system administrator to create a balanced configuration by creating pools as a pair. The pools are configured so that one pool of the pair is managed by system node 0 and the other pool of the pair is managed by node 1.
|
Note: If the requirement is to create a single pool, see “Creating a single pool” on page 277.
|
To create an FB pool pair, complete these steps:
1. Click the Pools icon and select the Arrays by Pool option to open the Array by Pool window, as shown in Figure 9-36.

Figure 9-36 Arrays by Pool

Figure 9-37 Create Pool Pair window
|
Note: You can automatically assign arrays when creating a pool pair. The arrays are created with the default redundant array of independent disks (RAID) type, RAID 6. To configure other supported raid types, select the Custom option under the Create Pool Pair dialog, or assign arrays manually to an existing storage pool from the Unassigned Arrays. RAID 5 needs a Request for Price Quotation (RPQ), but it is not recommended. For more information, see “Creating Fixed-Block pools: Custom” on page 274.
|
3. Specify the pool pair parameters, as shown in Figure 9-38 on page 273:
– Storage type: Ensure that Open Systems (FB) is selected.
– Name prefix: Add the pool pair name prefix. A suffix ID sequence number is added during the creation process.

Figure 9-38 Creating an FB pool pair and assigning arrays
4. Select from the listed drive types and select the number of arrays for each drive type that you want to assign to the pool pair.
|
Important: The number of specified arrays must be even. Trying to specify an odd number results in a message that states “Arrays must be spread evenly across the pool pair”. The GUI increases the number of arrays by one to achieve an even number.
|
5. When pool pair parameters are correctly specified, click Create to proceed. Figure 9-39 shows a pool pair that is created and assigned arrays.

Figure 9-39 Pool pair that is created with assigned arrays
Creating Fixed-Block pools: Custom
To specify the extent size or RAID level for the arrays at pool creation time, select the Custom option from the Create Pool Pair dialog.
Available options for extent size are 1 GiB (large), or 16 mebibytes (MiB) (small). Small extent size is the preferred option because it provides better capacity utilization. For large systems that use Easy Tier, it might be preferable to use large extents. For an in-depth description about large and small extents, see Chapter 4, “Virtualization concepts” on page 107.
To create a custom FB pool pair, complete these steps:
1. Click the Pools icon and select the Arrays by Pool option to open the Array by Pool window, as shown in Figure 9-36 on page 272.
2. Click the Create Pool Pair tab. The Create Pool Pair window opens.
3. Select the Custom option.
4. Specify the pool pair parameters, as shown in Figure 9-40 on page 275:
– Storage type: Ensure that Fixed block (FB) is selected.
– Name prefix: Add the pool pair name prefix. A suffix ID sequence number is added during the creation process.
– Extent size: Select 1 GiB for large extents, or 16 MiB for small extents.
5. Select from the listed drive types and select the number of arrays for each drive type that you want to assign to the pool pair.
6. Choose the RAID level for the selected arrays. RAID 6 is the recommended and default RAID type for all drives over 1 TB.
|
Note: RAID 5 is supported only for drives less than 1 TB and requires an RPQ. If selected, you must acknowledge your understanding of the risks that are associated with RAID 5 before continuing. For more information about the supported drive types and available RAID levels, see Chapter 2, “IBM DS8900F hardware components and architecture” on page 25.
|
7. When the pool pair parameters are correctly specified, click Create to proceed, as shown in Figure 9-40 on page 275.

Figure 9-40 Create FB pools (Custom)
Manually assigning arrays to existing pools
The storage administrator can manually unassign or reassign arrays from or to existing pools when the current configuration must be modified, such as when the administrator adds storage capacity. To manually assign arrays, complete these steps:
1. Select an array and click Assign or Reassign, as shown in Figure 9-41. This action opens the Assign Array window.

Figure 9-41 Manually assigning an array to an existing pool
2. Select the target pool from the drop-down list, and the RAID level that you want.
3. Select the Redistribute checkbox to redistribute all existing volumes across the pool, including the new array.
4. Click Assign.
|
Note: In a pool that is managed by Easy Tier, redistributing volumes across the pool is automatic. This redistribution is called Dynamic Pool Reconfiguration. For more information, see IBM DS8000 Easy Tier (Updated for DS8000 R9.0), REDP-4667.
|
Creating a single pool
Occasionally, you are required to create a single pool, as opposed to creating a pool pair for balancing a workload. To create a single storage pool, complete these steps:
1. Create a pool pair, as shown in Figure 9-42. However, do not assign any arrays to the new pool pair.
Figure 9-42 Creating an empty pool pair with no assigned arrays
2. Click Create. Two pools are created as usual.
3. Choose one of the pools from the recently created pool pair to delete, as shown in Figure 9-43.

Figure 9-43 Deleting one pool of the pool pair
4. Assign one or more arrays to the single pool, as shown in Figure 9-44.

Figure 9-44 Assigning an array to a single pool
9.6.3 Creating FB volumes for open systems hosts
There are multiple paths to take when creating FB volumes. The most straightforward way is by using the Create Volumes tab on either the Volumes window or the Volumes by Pool window. You can also access this tab by clicking the Actions menu under Host or LSS. The maximum capacity for an FB volume is 16 TiB. The Storage Management GUI automatically distributes capacity across the two pools.
To create these FB volumes, complete the following steps:
1. From the system window, select the Volumes icon. Four options are provided, as shown in Figure 9-45 on page 279:
– Volumes (All volumes are visible in single view.)
– Volumes by Pool (Volumes are grouped by pool.)
– Volumes by Host (Volumes are grouped by host.)
– Volumes by LSS (Volumes are grouped by LSS.)

Figure 9-45 Views for Volumes
2. Selecting one of the first two options opens a view listing all the volumes or pools on the system. Figure 9-46 shows the Volumes by Pool view.

Figure 9-46 Volumes by Pool

Figure 9-47 Create Volumes dialog
The DS GUI provides three presets or templates to create volumes:
– Create Volumes for IBM Z
Use this option to create CKD volumes for IBM Z host storage capacity provisioning.
– Create Volumes for IBM i
Use this option to create FB volumes for IBM i host storage capacity provisioning.
– Create Volumes for Open System
Use this option to create FB volumes for open system host storage capacity provisioning.
Creating FB volumes: Open systems
To create FB volumes for open systems hosts by using the open systems preset, complete these steps:
1. From the Create Volumes drop-down menu (Figure 9-47 on page 279), click Create Volumes for Open Systems.
2. The Create Volumes for Open Systems configuration dialog for open systems hosts opens (Figure 9-48). By default, the DS GUI tries to balance the volumes across the pool pair so that the workload is balanced across both nodes or central processor complexes (CPCs). So, by default it selects both CPC pools. An Administrator or Physical Operator user can select the pool that they want in the drop-down option at pool selection.

Figure 9-48 Creating open systems (FB) volumes
3. Enter the following user-specified values:
– Name prefix: User-defined name for volumes (a suffix ID sequence number is added during the creation process).
– Quantity: Number of volumes to be created in selected pools.
– Capacity: The capacity of the volumes to be created. Volumes can be configured in the following increments:
• MiB, GiB, or TiB
• Blocks
– (Optional) Host: Optionally, map the volumes to a target host or host cluster.
– Provisioning: Select type of Storage allocation:
• Standard: Fully provisioned Volume
• Thin provisioning: Thin provisioning defines logical volume sizes that are larger than the usable capacity installed on the system. The volume allocates capacity on an as-needed basis as a result of host-write actions. The thin provisioning feature enables the creation of extent space-efficient (ESE) logical volumes.
The administrator or user, while creating the new volumes, can assign the address range to the volume in the Advanced section, as shown in Figure 9-49. It is possible to specify the volumes by using the T10 Data Integrity Field (DiF)/Protection Information. After you specify the volume set that you want to create, click Save. Then, you either create another one by selecting ⊕ New Volume Set, or, once all the volume sets are specified, click Create to create them in a row all at once.

Figure 9-49 Using the Advanced section when creating volumes
|
Tips:
•By providing a target host or host cluster, you can create volumes and map them to the host in one step.
•Selecting the suitable range of addresses for the new volume set is important from the copy service planning point of view and the CPC preferred path affinity. After you create a volume, you cannot change its address.
•When FlashCopy is used on FB volumes, the source and the target volumes must have the same protection type, that is, they both must use T10-DIF or standard.
|
Creating volumes: IBM i
To create FB volumes for IBM i hosts by using the IBM i preset, complete the following steps:
1. Click the Create Volumes for IBM i option. The window that is shown in Figure 9-50 on page 282 opens.

Figure 9-50 Creating IBM i volumes
2. Choose an FB pool from the available ones in each node.
3. Enter a Name prefix to identify the volumes.
4. Enter the Quantity of volumes to create.
5. Select the volume Type from a list of fixed capacities.
6. If variable type 050 (unprotected) or 099 (variable, protected) is selected, then the Capacity of the volumes (GiB or TiB) also must be specified.
7. In case you want volumes for Thin Provisioning (ESE), change the Provisioning field to Thin Provisioning (ESE).
8. As an option, you may specify 4-digit volume serial numbers for the volumes in the Advanced section. Use hexadecimal values (00-FE) for the LSSs.
|
Note: Release 9 and later supports Dynamic Volume Expansion (DVE) of IBM i 050 and 099 volume types in increments of 1 - 2000 GB. The minimum software level of the IBM i hosts must be IBM i 7.3 TR6 or IBM i 7.4 and later.
|
Optionally, you can map the volumes to a defined IBM i host in this step too.
Further volume sets can be prepared and saved before you create what is defined in a row.
9.6.4 Creating FB host attachments
To map FB volumes to open system hosts, complete the following steps:
1. Set the FC port topology.
2. Create open systems clusters (optional).
3. Create open systems hosts.
4. Assign host ports to hosts.
5. Assign FB volumes to open systems hosts.
Setting the Fibre Channel port topology
For an open system host to access FB volumes that are configured on the DS8900F, the host must be connected to the DS8900F through a FICON. The Fibre Channel Protocol (FCP) must be configured on the FC port so that the host can communicate with the volume on the DS8900F.
DS8900F has two kinds of host adapters: 4-port 16-gigabit Fibre Channel (GFC) and 4-port 32 GFC (referred to in the DS GUI as 16 Gbps or 32 Gbps). Each port can be independently configured to one of the following FC topologies:
•FCP: Also known as FC-switched fabric (which is also called switched point-to-point) for open system host attachment, and for Metro Mirror (MM), Global Copy (GC), Global Mirror (GM), and Metro/Global Mirror (MGM) connectivity
•FICON: To connect to IBM Z hosts, and for zGM connectivity
|
Note: With DS8900F, Fibre Channel Arbitrated Loop (FC-AL) is no longer supported.
|
To set the FC port topology for open system hosts, complete the following steps:
1. From the DS GUI left navigation menu, click Settings → Network and select Fibre Channel Ports to open the Fibre Channel Ports window (Figure 9-51).

Figure 9-51 Fibre Channel Ports window
2. Select the port to modify. Multiple ports can be selected by using the Shift or Ctrl key.
3. From the Actions tab, click Modify Protocol to open the Modify Protocol window, as shown in Figure 9-52.

Figure 9-52 Modify Protocol window
4. Choose from the available protocols to modify the selected host adapter port or ports. For open system hosts attachment, select SCSI FCP (Small Computer System Interface (SCSI) FCP).
5. Click Modify to perform the action.
Creating open system clusters and hosts
To simplify and enable better management of volume-mapping operations to hosts, the DS8900F can group hosts of the same type into a host cluster. Hosts in a host cluster can have both shared and private volume mappings. This section describes how to configure host clusters and hosts by using the DS GUI.
For reference, a host port is the FC port of the host bus adapter (HBA) FC adapter that is installed on the host system. It connects to the FC port of the host adapter that is installed on the DS8900F.
To configure an open system cluster, complete the following steps:
1. Create a cluster: Configure a cluster object to access the storage system.
2. Create a host: Configure a host object to access the storage system.
3. Assign hosts: Assign hosts to a cluster object.
4. Assign a host port: Assign a host port to a host object by identifying one of the WWPNs of the HBA that is installed on the host system.
5. Modify the FC port mask: Modify the FC port mask (on the DS8900F) to allow or disallow host communication to and from one or more ports on the system.
To configure an open system host, complete the following steps:
1. Create a host: Configure a host object to access the storage system.
2. Assign a host port: Assign a host port to a host object by identifying one of the WWPNs of the HBA that is installed on the host system.
3. Modify the FC port mask: Modify the FC port mask (on the DS8900F) to allow or disallow host communication to and from one or more ports on the system.
Creating clusters
To configure a cluster object, complete these steps:
1. Click the Hosts icon from the DS GUI navigation pane on the left.

Figure 9-53 Hosts menu in the navigation
4. The Create Cluster window opens, as shown in Figure 9-54. Specify the name of the cluster, and click Create.

Figure 9-54 Hosts view: Create Cluster window
Creating hosts
To configure a host object, complete these steps:
1. Click the Hosts icon from the DS GUI navigation pane on the left.
3. If any unassigned host ports are detected by the system, a suggested task window opens with two options, as shown in Figure 9-55.

Figure 9-55 Hosts Suggested Tasks
|
Note: This window always appears when host port definitions are made by using the DS CLI (mkhostport) and are not yet fully reflected in the GUI. So, the GUI offers to move the CLI definitions fully into the GUI.
If canceled or closed, the Suggested Tasks window can be reopened by clicking the attention message that is shown in Figure 9-56.
|

Figure 9-56 Updating host assignment attention
4. Click Automatically Create Hosts. A list of detected hosts and unassigned host ports is displayed, as shown in Figure 9-57. Verify the list and click Create to complete the assignment task automatically.

Figure 9-57 Update Unassigned Host Ports
5. Select Manually Create Hosts to manually assign host ports to the existing hosts or click Create Host to create hosts to assign the ports.

Figure 9-58 Create Host
7. The Add Hosts window opens (Figure 9-59). Specify the following items:
– Name: The user-defined name for the host to add.
– Type: The operating system (OS) of the host to add.
– Host port (WWPN): Optionally, provide the WWPN of the host port. If the host port logged in to the system, it can be selected from the Host Port (WWPN), list as shown in Figure 9-58.

Figure 9-59 Add Host window that shows options for the host type
Assigning hosts to a cluster
If required, after a host is created, it can be assigned to a defined host cluster. To do so, complete these steps:
1. From the Hosts window, select the host to be assigned to a cluster.

Figure 9-60 Assigning a host to a cluster
3. The Assign Host window opens. From the drop-down list, select the cluster to which to add the host.
4. Click Assign to complete the action.
5. Repeat the previous actions to add all hosts that are required in the cluster. After you complete all the hosts, assigned hosts are listed under the cluster in the Hosts window, as shown in Figure 9-61.

Figure 9-61 Hosts window showing the created cluster
Assigning host ports
After the host is added, host ports must be assigned to the defined host. To do so, complete these steps:
1. From the Hosts window, select the host to which to assign the host port. Either right-click, or from the Actions tab, select Assign Host Port, as shown in Figure 9-62.
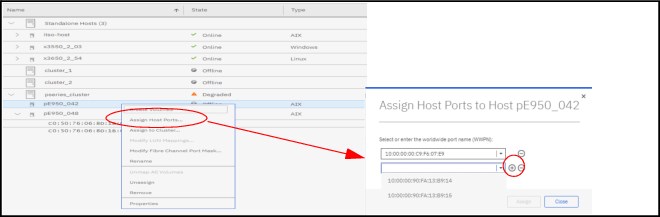
Figure 9-62 Assign Host Ports to Host
2. This action opens the Assign Host Ports to Host window.
If the host ports already logged in to the DS8900F (the host ports are zoned so that they are visible to the DS8900F), the available WWPNs are listed in the drop-down. If the host ports are not visible to the DS8900F, the WWPN of the host HBA must be added manually.
Select one of the WWPNs that are shown in the drop-down list, or manually enter the WWPN of the HBA of the host that you are adding. You can select multiple WWPNs by clicking +, as shown in Figure 9-62. Click Assign to complete.
Typically, most open system hosts have multiple FC connections to the DS8900F for redundancy and performance. Ensure that all additional host WWPNs that are connected for this host are defined to the host object by using the same procedure.
|
Note: When there are multiple FC connections to the DS8900F from a host, you should use native multipathing software that is provided by the host OS to manage these paths.
|
Modifying the Fibre Channel port mask
When the host is configured, by default it has access to all FC ports on the DS8900F system. To view them, select a host from the Hosts window, right-click, and then select Properties, as shown in Figure 9-63.

Figure 9-63 Host properties showing the Fibre Channel port mask
If the system administrator wants to restrict the FC ports that can communicate with the host, FC port masking must be defined. Modify the FC port mask to allow or disallow host communication to and from one or more ports on the system.
To define FC port masking, complete the following steps:
1. From the Hosts window, select the host to modify the FC port mask. Right-click and, or from the Actions tab, select Modify Fibre Channel Port Mask. A list of the DS8900F FC ports is displayed.
2. Select one or more ports to disallow. You can use the Ctrl or Shift key for multiple selections. Click Save, as shown in Figure 9-64.

Figure 9-64 Modifying the Fibre Channel Port Mask
The properties of the selected host now reflect the number of FC ports that have access, as shown in Figure 9-65.

Figure 9-65 Host properties with FC port masking
9.6.5 Assigning FB volumes
FB volumes can accept I/O only from the host ports of hosts that are mapped to FB volumes. To map a volume to a host or a cluster, complete these steps:
1. From the DS GUI system window, select either the Volumes icon or Hosts icon, and then select Volumes by Host.
2. The Volumes by Hosts menu opens. Select the volumes to map from the Unmapped Volumes list, as shown in Figure 9-66. From the Actions tab, or by right-clicking, select Map to Host or Cluster.

Figure 9-66 Mapping unmapped volumes to a host or cluster
3. The Map Volume to Host or Cluster window opens. Select the host or cluster from the list of configured stand-alone hosts and clusters, as shown in Figure 9-66 on page 291, and then click Map.
|
Note: When mapping volumes to a cluster, volumes that are mapped to the cluster are public volumes that are seen by all hosts in the cluster. Volumes that are mapped to a single host in a cluster are private volumes.
It is the responsibility of the system administrator to ensure that the correct clustering software is implemented to ensure data integrity when a volume is mapped to more than one host.
|
Figure 9-67 shows a mixture of public and private volumes that are mapped to a cluster.

Figure 9-67 Mapping volumes to a cluster
9.7 Logical configuration for Count Key Data volumes
This section describes the logical configuration for CKD volumes for IBM Z.
9.7.1 Configuration flow
As with the FB configuration, logical configuration for CKD volumes is simplified and can now be accomplished with a few steps:
1. Create a CKD pool pair and assign arrays to the pools.
2. Create the CKD LSSs.
3. Create the CKD volumes.
4. Configure the alias volumes (parallel access volumes (PAVs)).
5. Configure the FC ports for FICON.
9.7.2 Creating CKD storage pools
For the best performance and a balanced workload, two pools must be created. The DS GUI helps the system administrator to create a balanced configuration by creating pools as a pair. The pools are configured so that one pool of the pair is managed by node 0, and the other pool of the pair is managed by node 1.
To create a CKD pool pair, complete these steps:
1. From the DS GUI window, select the Pools icon.
2. Click Arrays by Pool to open the Arrays by Pool window.
3. Click the Create Pool Pair tab.
4. In the Create Pool Pair window that is shown in Figure 9-68, select the number of arrays to assign to the pool pair.

Figure 9-68 Creating the CKD pool pair and assigning arrays to the pool pair
5. If multiple drive classes are installed on the storage system, decide how many arrays of each drive class are required in each pool.
6. Ensure that storage type CKD is selected.
7. Assign a name to the pool pair. This name is used as the prefix for the pool pair ID.
8. Click Create.
|
Important: The CKD LSSs cannot be created in an address group that already contains FB LSSs. The address groups are identified by the first digit in the two-digit LSS ID.
|
9. After the pool pair creation is complete, the arrays are assigned to the pool pair, as shown in Figure 9-69. The DS GUI configures the selected arrays for CKD storage and distributes them evenly between the two pools.
|
Note: You can automatically assign arrays when creating a pool pair. The arrays are created with the default RAID type RAID 6. To configure other supported RAID types, you must use the advanced configuration for pool creation, or assign the arrays manually to an existing storage pool from the unassigned arrays. For more information, see “Creating CKD Pools: Advanced configuration” on page 294.
|

Figure 9-69 CKD pool pair that is created and arrays that are assigned to the pool pair
Creating CKD Pools: Advanced configuration
When creating CKD storage pools, you can also specify the extent size and RAID level. You can specify large 1,113 cylinder or small 21 cylinder extents for a storage pool or pool pair. The RAID level for the arrays can also be specified at creation time by using the Advanced (Custom) configuration option.
To create a custom CKD pool pair, complete these steps:
1. From the System window, click the Pools icon.
2. Click Arrays by Pool to open the Array by Pool window.
3. Click the Create Pool Pair tab. The Create Pool Pair window opens.
4. Select the Custom option.
5. Specify the pool pair parameters:
– Storage type: Ensure that Count Key Data (CKD) is selected.
– Name prefix: Add the pool pair name prefix. A suffix ID sequence number is added during the creation process.
– Extent size: Select 1,113 cylinders for large extents or 21 cylinders for small extents.
6. Select from the listed drive types and select the number of arrays for each drive type that you want to assign to the pool pair.
7. Choose the RAID level for the selected arrays.
8. When pool pair parameters are correctly specified, click Create to proceed.
Figure 9-70 shows the custom configuration options for this procedure.

Figure 9-70 Configuring CKD storage pools with advanced options
|
Note: RAID 6 is the recommended and default RAID type for all drives.
|
RAID 5 is allowed for drives less than 1 TB with an accepted RPQ. When configuring RAID 5 for the supported drives, you must accept the disclaimer acknowledging that you understand the risks that are associated with RAID 5, as shown in Figure 9-71. A timestamped record with user information is created for audit purposes.

Figure 9-71 RAID 5 disclaimer for drives less than 1 TB
For more information about the supported drive types and available RAID levels for DS8900F models, see Chapter 2, “IBM DS8900F hardware components and architecture” on page 25.
Manually assigning arrays to existing pools
The system administrator can manually assign arrays, or unassign or reassign assigned arrays to existing pools when the current configuration must be modified, such as when the system administrator adds storage capacity. To do so, complete these steps:
1. From the Arrays by Pool window, select the array that you want to assign, then either right-click the array or select Actions, and then select Assign.
2. When you manually assign arrays, choose from an existing storage pool and define the RAID type.
3. Click Assign.
Figure 9-72 shows the Arrays by Pool window, which shows how to assign the arrays.
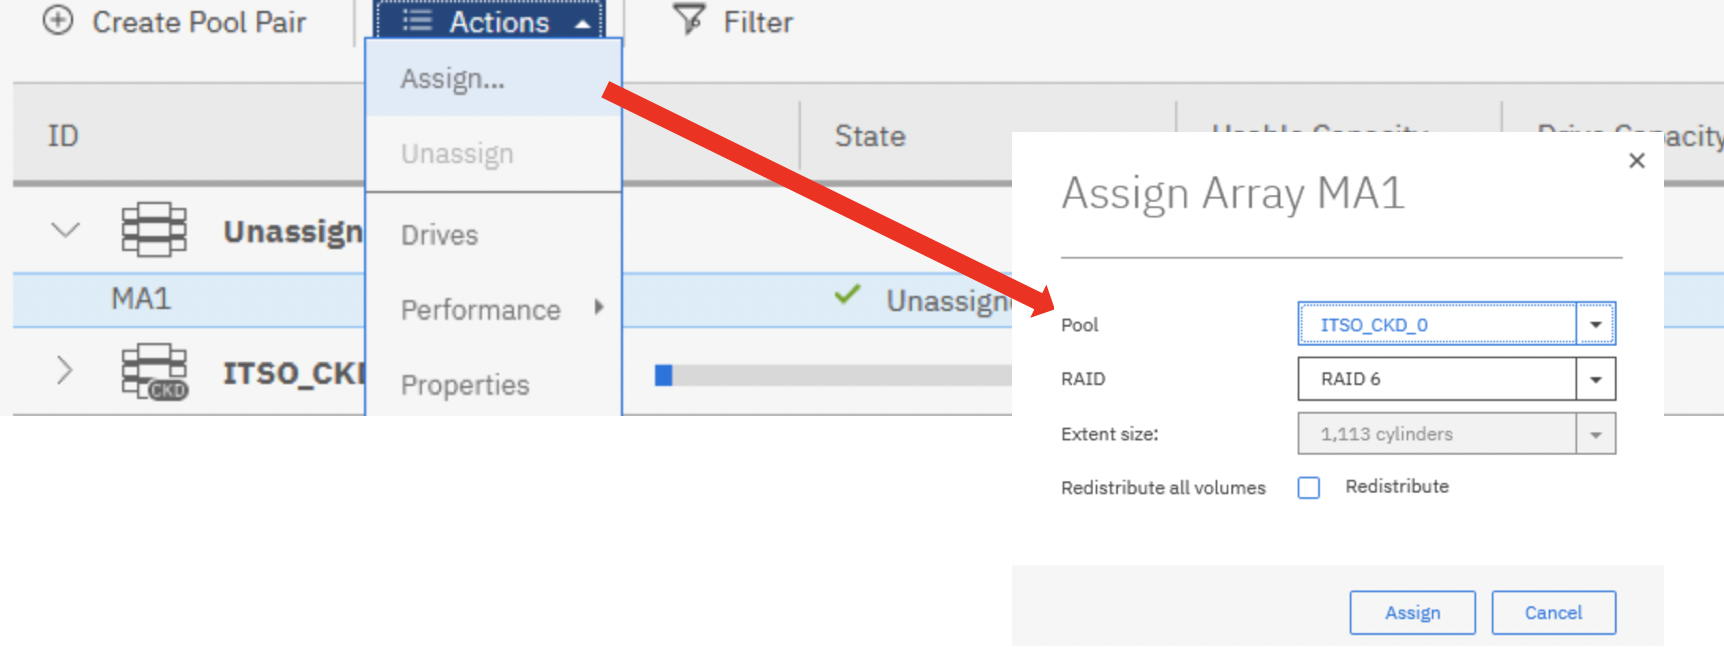
Figure 9-72 Manually assigning arrays to an existing pool
Creating a single pool
Occasionally, you are required to create only a single pool as opposed to creating a pool pair for balancing the workload. To create a single storage pool, see “Creating a single pool” on page 277.
9.7.3 Creating CKD logical subsystems
|
Note: You can create LSS ranges, exact volume address ranges, and aliases in one step. For an example, see 9.7.4, “Creating CKD volumes” on page 299.
|
The DS8000 LSS emulates a CKD storage control unit image (LCU). A CKD LSS must be created before CKD volumes can be associated to the LSS.
To create CKD LSSs, complete these steps:
1. Click the Volumes icon in the system window.
2. Select Volumes by LSS from the menu.

Figure 9-73 Creating CKD volumes by LSSs
4. The Create CKD LSSs window opens, as shown in Figure 9-74. Enter the required information. After you enter the values for the LSS range, subsystem identifier (SSID) prefix, and LSS type, click Create. The Need Help icon shows information about how the unique SSID for each LSS is determined based on the SSID prefix that is provided.

Figure 9-74 Defining CKD LSSs
|
Note: The CKD LSSs cannot be created in an address group that already contains FB LSSs. The address groups are identified by the first digit in the two-digit LSS ID.
|
Figure 9-75 shows the 16 LSSs that are created.

Figure 9-75 CKD LSSs that are created
5. The unique SSID for each LSS is automatically determined by combining the SSID prefix with the ID of the LSS. The SSID can be modified if needed, as shown in Figure 9-76.
|
Important: This situation is important in an IBM Z environment where the SSIDs were previously defined in input/output definition files (IODFs) and might differ from the SSIDs that are automatically generated by the Storage Management GUI. Be careful when changing SSIDs because they must be unique in an IBM Z environment, and they are used in Copy Services definitions. A change must not be done unless you first removed all related copy services relationships (including PPRC paths).
|

Figure 9-76 Modifying the CKD LSS SSID
|
Note: Occasionally, the DS8900F GUI view does not immediately update after modifications are made. After you modify the SSID, if the view is not updated, refresh the GUI cache to reflect the change by clicking Settings → Support → Troubleshooting → Refresh GUI cache. For more information, see “Troubleshooting” on page 268.
|
9.7.4 Creating CKD volumes
To create CKD volumes, complete these steps:
1. Select the Volumes icon from the system window, and then select Volumes or Volumes by Pool from the menu.
2. Select the pools in which you want to create volumes.
3. Select the Create Volumes for IBM Z option under Create Volumes. The Create Volumes for IBM Z window opens, as shown in Figure 9-77.

Figure 9-77 Creating multiple groups of CKD volumes
|
Note: The storage administrator can create configurations that specify new LSS ranges, exact volume address ranges, and aliases in one step.
|
4. Determine the LSS range for the volumes that you want to create.
5. Determine the name prefix and the quantity of volumes to create for each LSS.
Enter a prefix name and capacity for each group. The capacity can be specified in three ways:
– Device: Select one of these choices from the list: 3380-2, 3380-3, 3390-1, 3390-3, 3390-9, 3390-27, 3390-54, or 3390-A (extended address volume (EAV)). These device types have a fixed capacity that is based on the number of cylinders of each model. A 3390 disk volume contains 56,664 bytes for each track, 15 tracks for each cylinder, and 849,960 bytes for each cylinder. The most common 3390 model capacities are shown:
• 3390-1 = 1113 cylinders
• 3390-3 = 3339 cylinders
• 3390-9 = 10017 cylinders
• 3390-27 = 30051 cylinders
• 3390-54 = 60102 cylinders
– Mod1: Emulates a 3390 Model 1. However, the number of cylinders is variable from 1 to the maximum available capacity in the pool.
– Cylinders: Enter the number of cylinders for capacity based on a 3390 cylinder @ 849,960 bytes per cylinder.
6. Under Provisioning, select either Standard (thick volumes), or Thin Provisioned (ESE).
7. After completing the details, either define another volume set directly by using the ⊕ symbol, or click Save and validate the complete volume preset information. If you like to create another volume, click ⊕ New Volume Set. Otherwise, click Create to create all the volume definitions together in a row.
9.7.5 Creating CKD parallel access volumes
The DS8000 storage system supports the configuration and usage of PAVs. PAV is the concept of using multiple devices or aliases to address a single disk device. PAVs allow the definition of more unit control blocks (UCBs) to the same logical device, each using an extra alias address. For example, a direct access storage device at base address 1000 can have alias addresses of 1001, 1002, and 1003. Each of these alias addresses has its own UCB. Because there are four UCBs for a single device, four concurrent I/Os are possible. Writes to the same extent (an area of the disk that is assigned to one contiguous area of a file) are still serialized, but other reads and writes can occur simultaneously.
In the first version of PAV, the disk controller assigns a PAV to a UCB (static PAV). The second version of PAV processing, Workload Manager (WLM), reassigns a PAV to new UCBs from time to time (dynamic PAV).
The restriction for configuring PAVs is that the total number of base and alias addresses for each LSS cannot exceed 256 (00 - FF). These addresses must be defined in the IODF so that they match the correct type, base, or alias.
Typically, when you configure PAVs in the IODF, the base addresses start at 00 and increment toward FF. Alias addresses typically are configured to start at FF and decrement (decrease) toward 00. A system administrator might configure only 16 or 32 aliases for each LSS. However, no restrictions exist other than the total of 256 addresses that are available to the LSS (bases and aliases).
The DS GUI configures aliases in this manner, starting at FF and descending. The storage administrator can either configure many aliases against the LSS, in which case those aliases are assigned to the lowest address in the LSS. Alternatively, the system administrator can define any number of aliases to any specific base address. For more information about PAVs, see IBM DS8900F and IBM Z Synergy DS8900F: Release 9.3 and z/OS 2.5, REDP-5186.
Configuring parallel access volumes: Aliases
To configure aliases (PAVs), complete these steps:
1. Select the Volumes icon from the System window and then click Volumes by LSS.
2. Select the LSS for which to create aliases and right-click the LSS, as shown in Figure 9-78 on page 301.

Figure 9-78 Creating aliases for the LSS
3. Select Manage Aliases to open the Aliases for LSS xx (where xx = 00 - FE) dialog box. Click Create Aliases to open the dialog box that is shown in Figure 9-79. Enter the number of aliases to create. The example in Figure 9-79 shows 32 aliases being created for LSS 80.

Figure 9-79 Creating 32 aliases for LSS 80

Figure 9-80 Thirty-two aliases are created for LSS 80
5. Click the arrow (>) icon to the left of the LSS to expand the LSS and display the base volumes that are assigned to the LSS.
Figure 9-81 shows the list of alias volumes for LSS 80.
The aliases are automatically created against the lowest base volume address in the LSS first. For example, in Figure 9-81, the 32 aliases are created against the lowest base volume address 8000 (ITSO_CKD_8000).

Figure 9-81 Thirty-two aliases against the lowest base volume address
6. To display the aliases, select the base volume with those aliases that are assigned to it and then click Action → Manage Aliases.
A list with the addresses of all aliases that are assigned to the base volume is displayed, as show in Figure 9-82.

Figure 9-82 List of aliases with their alias IDs starting at FF and in descending order
|
Note: The alias IDs start at FF and they are in descending order, as shown in Figure 9-83 on page 303.
|
7. Aliases can also be created for a single base volume by selecting the base volume, right-clicking, and selecting Action → Manage Aliases. Then, select Create Aliases. Enter the number of aliases that you want for the base volume, as shown in Figure 9-83.

Figure 9-83 Configuring aliases for a single base volume
The five aliases for a single base volume address (ITSO_CKD_8006) are created with a starting address of DF and end with DB in descending order, as shown in Figure 9-84. (Alias E0-FF was created before).

Figure 9-84 List of five aliases that are created for a single base address
9.7.6 Setting the FC port protocols for IBM Z attachment
For an IBM Z host to access assigned CKD volumes, the host must connect to the DS8900F host adapter over FC. The protocol of the host adapter port must be set to FICON.
To set the FC port protocols of the FC ports that the host uses to communicate with the DS8900F, complete these steps:
1. Select Settings → System → Fibre Channel Ports, and then select Actions → Modify Fibre Channel port protocols.
2. Select one or multiple ports to modify and select Actions → Modify.
3. The Modify Protocol for the selected Ports window opens. Select the FICON protocol.

Figure 9-85 Modifying the FC port protocols
9.8 Expanding volumes
The DS8900F can dynamically expand a volume, which means that you can increase the capacity of a volume without taking the volume offline or without removing the existing data on the volume. This action is supported for both FB and CKD volumes. Additionally, this action is also supported for the IBM i variable size volume types 050 (unprotected) and 099 (protected).
The following example shows the steps that are required to expand an IBM i volume of type 099 (see Figure 9-86 on page 305):
1. Go to any Volumes view, such as Volumes → Volumes by Pool.
2. Select the volume and select Actions → Expand. You can also open the Actions menu by selecting the volume and right-clicking it.
3. The Expand Volume dialog opens. Enter the new capacity for the volume and click Expand.
4. A warning appears that informs you that certain OSs do not support this action, and it asks for confirmation to continue the action. Verify that the OS of the host to which the volume is mapped supports the operation, and click Yes.
A task window opens and is updated with progress on the task until it is completed.

Figure 9-86 Expanding a volume
The storage administrator can also expand the Safeguarded capacity, as shown in Figure 9-87. For more information, see IBM DS8000 Safeguarded Copy (Updated for DS8000 R9.2), REDP-5506.

Figure 9-87 Expanding Safeguarded capacity
9.9 Deleting a pool
You can use the GUI to delete a pool that is no longer needed. If the pool contains volumes, you no longer need to first delete the volumes. If the volumes are not in use, it is now possible to delete a pool with volumes by entering the confirmation code that is presented by the GUI, as shown in Figure 9-88.

Figure 9-88 Deleting a pool with volumes
9.10 Deleting volumes
You can use the GUI to delete volumes that are no longer needed. By default, the GUI enforces safe deletion of volumes that are in use.
In the case of FB volumes, a volume is considered to be in use if it is in a CS relationship or if the volume received an I/O operation in the last 5 minutes. A CKD volume is considered in use if it participates in a CS relationship or if the IBM Z path mask indicates that the volume is in a grouped state or online to any host system.
You can instruct the GUI to force the deletion of volumes that are in use by selecting the optional checkbox in the Delete Volumes dialog box, as shown by #1 in Figure 9-89 on page 307. This setting does not apply to volumes that are in a Safeguarded Copy relationship.
The following example shows the steps that are needed to delete an FB volume that is in use:
1. Go to the hosts-centric Volumes view by selecting Volumes → Volumes by Host.
2. Select the volume to be deleted, and then select Actions → Delete, as shown by #2 in Figure 9-89 on page 307.

Figure 9-89 Deleting volumes
3. The Delete Volume window opens.
4. Confirm the action by entering the unique code that is displayed by the GUI into the window.
5. Because the selected volume is mapped to the host itso-host (#5), select the checkbox as shown by number 1 in the window and click OK.
A task window opens, and is updated with your progress on the task until it completes.
9.11 Reinitializing a thin-provisioned volume
Reinitializing a thin-provisioned volume frees storage, but also results in data loss. To prevent against accidental data loss, reinitialization of volumes requires more confirmation. To continue with the operation, confirm the action by entering the code that you receive. Additionally, for online volumes, select the Force reinitialization checkbox if you choose to bypass checking whether the selected volumes are mapped to a host or assigned to a path group, as shown in Figure 9-90.

Figure 9-90 Reinitializing an online ESE volume
9.12 Easy Tier support
You can assign the volume to an Easy Tier drive class, or specify a tier that the volume should not use.
Assigning a volume to a drive class
Select a volume, and then click Assign to Drive Class, as shown in Figure 9-91 on page 309. A window with options that are based on the drive classes that are in the pool opens. If you select a drive class that is different from the drive class that is in use by the volume, Easy Tier moves the volume to the new drive class. The following options are available, depending on the drive classes that are in the pool:
•Flash Tier 0: Assign the volume to flash Tier 0.
•Flash Tier 1: Assign the volume to flash Tier 1.
•Flash Tier 2: Assign the volume to flash Tier 2.

Figure 9-91 Assigning a volume to a drive class
Unassigning a volume from a drive class
By selecting the Unassign from Drive Class option, you can unassign a volume from an Easy Tier drive class tier and allow Easy Tier to manage the volume automatically again.
For more information about the settings that are available to configure Easy Tier, see “Easy Tier settings” on page 260.
For more information about Easy Tier, see IBM DS8000 Easy Tier (Updated for DS8000 R9.0), REDP-4667.
9.13 Monitoring system health
The DS8900F uses advanced predictive analysis to predict error conditions. The DS GUI provides tools to help monitor the health of the storage system in real time. If a system failure occurs, the system automatically provides notification. The Dashboard window in the DS GUI provides a visual representation of the DS8900F storage system. It displays system hardware states, and also provides access to actions that can be performed on the hardware components.
Figure 9-92 shows an example of the overall status of a system as displayed by the home dashboard.
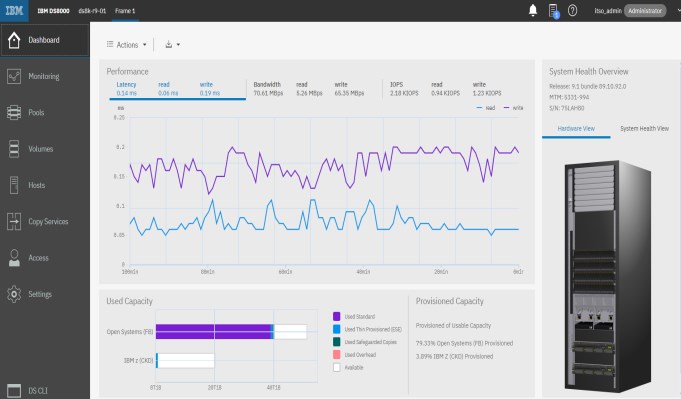
Figure 9-92 System Monitoring dashboard
The Dashboard window of the DS GUI includes the following elements:
•Performance
The performance of the system is displayed in real time, and it shows latency, bandwidth, and IOPS by default. Additionally, caching performance can be seen from the Performance tab at the top of the dashboard under Actions/Performance.
•Hardware resource alerts
The state of each hardware component of the storage system is displayed on the system window. Hardware components that need attention are highlighted.
•Used and Provisioned Capacity
Changes that affect the capacity of the storage system are displayed in the status area at the bottom of the Dashboard window.
•System Health Overview
This view lists the key hardware components of the system and their overall health. There are two views that are presented here:
a. System health view
Changes that affect data accessibility and hardware states are displayed in the system health view on the right side of the Dashboard window. If a hardware error is displayed, you can also observe the hardware component that needs attention.
b. Hardware view
A visual representation of the DS8900F system, which includes key hardware components. You can point to different system components for detailed information about that component. Click the component to see a more detailed view and show details and the state of that component. To restore the view of a component to its original position in the frame, click outside the frame.
•Alerting events
Error and warning alerts are displayed as badges on the Alerts (Bell) icon in the banner of the DS GUI (shown in Figure 9-93). Click the Alerts icon to see the alerts. Click the specific alert to view the corresponding event in the Events window.

Figure 9-93 Dashboard Events
9.13.1 Hardware components: Status and attributes
The DS GUI can identify the different hardware components of the storage system through a Hardware view, and it offers a detailed System Health overview of the system. Five of these hardware components are listed as an example:
•Processor nodes
•HMCs for management
•Storage enclosures with drives
•I/O enclosures with host adapters and DAs
•FC ports
This section provides more information about these hardware components, including how to see more information about them from the system window.
|
Note: For the DS8910F Rack-Mounted model 993, the status of the various hardware components is available from the System Health Overview. You can click each component to see more details about it. There is no hardware view for this model.
|
Processor nodes
Two processor nodes exist that are named ID 0 and ID 1. Each node consists of a CPC and the Licensed Internal Code (LIC) that runs on it. You also can display the system health overview by clicking the System Health View icon, as shown in Figure 9-94.

Figure 9-94 System Health Overview
For more information about the processor nodes, click Processor Nodes.

Figure 9-95 Processor Nodes detailed view
Here are the node attributes that are shown in Figure 9-95:
•ID: The node identifier, which is node 0 or node 1.
•State: The current state of the node is shown:
– Online: The node is operating.
– Initializing: The node is starting or not yet operational.
– Service required: The node is online, but it requires service. A call home was initiated to IBM Hardware Support.
– Service in progress: The node is being serviced.
– Drive service required: One or more drives that are online require service. A call home was initiated.
– Offline: The node is offline and non-operational. A call home was initiated.
•Release: The version of the Licensed Machine Code (LMC) or hardware bundle that is on the node.
•Processor: The type and configuration of the processor that is on the node.
•Memory: The amount of raw system memory that is installed in the node.
•Location Code: Logical location of the processor node.
Hardware Management Console
The DS8900F has two HMCs. The HMC provides a standard interface on a dedicated console to control managed systems. Point to the HMC component (Figure 9-94 on page 311) and click HMCs to display the detailed attributes for both HMCs, as shown in Figure 9-96.

Figure 9-96 HMCs detailed view
Here are the attributes that are displayed for the HMC component in Figure 9-96 on page 312:
•Name: The name of the HMC as defined by the user.
•State: The status of the HMC is shown:
– Online: The HMC is operating normally.
– Code updating: The HMC software is being updated.
– Service required: The HMC is online, but it requires service. A call home was initiated to IBM Hardware Support.
– Offline with redundancy: The HMC redundancy is compromised. A call home was initiated to IBM Hardware Support.
– Offline: The HMC is offline and non-operational.
•Release: The version of the LMC that is installed on the HMC.
•Host address: The IP address for the host system of the HMC.
•Role: The primary or secondary HMC.
•Location Code: The logical location code for the HMC. If the HMC is external, the location is identified as off-system.
Storage enclosures
A storage enclosure is a specialized chassis that houses and powers the flash drives in the DS8900F storage system. The storage enclosure also provides the mechanism to allow the drives to communicate with one or more host systems. All enclosures in the DS8900F are High-Performance Flash Enclosures (HPFEs). These enclosures contain flash drives, which are Peripheral Component Interconnect Express (PCIe)-connected to the I/O enclosures.
To view detailed information about the enclosures that are installed in the system, select Storage Enclosures, as shown in Figure 9-94 on page 311. The attributes of the storage enclosure are shown in Figure 9-97.

Figure 9-97 Storage Enclosures detailed view
•ID: The storage enclosure number.
•State: The current state of the storage enclosure is shown:
– Online: The storage enclosure is operating normally.
– Service requested: A service request to IBM was generated for one or more drives within the storage enclosure.
– Service required: The storage enclosure is online, but it requires service.
– Service in progress: The storage enclosure is being repaired.
– Offline: The storage enclosure requires service.
•Drive capacity: The raw capacity of the flash drives that are installed in the storage enclosure.
•Drive class: The drive class (tier) of the drives in the storage enclosure. Examples include Flash Tier 0, Flash Tier 1, and Flash Tier 2 drives.
•Installed: The time and date when the enclosure was installed.
•Location Code: The logical location code, which includes the serial number of the storage enclosure.
A drive is a data storage device. From the GUI perspective, a drive can be either a Flash Tier 0, Flash Tier 1, or Flash Tier 2 drive. To see the data storage devices and their attributes from the Hardware view, click a storage enclosure when the magnifying glass pointer appears (Figure 9-92 on page 310). This action shows the storage enclosure and installed storage devices in more detail (Figure 9-98). You can also select Drives from the System Health Overview to display information for all installed drives.

Figure 9-98 Drive detail view in a storage enclosure
The attributes for the drives in Figure 9-98 are described:
•ID: The drive, storage enclosure, and frame ID
•State: The current state of the drives is described:
– Normal: Operational.
– Initializing: The drive is being prepared for operation.
– Service: The drive is being serviced.
– Offline: The drive requires service.
•Capacity: The raw capacity of the drive
•Class: The drive class
I/O enclosures
The I/O enclosure contains the I/O adapters. To see the I/O adapters and their attributes from the Hardware view, click an I/O enclosure (Figure 9-92 on page 310) when the magnifying glass pointer appears.
This action displays the I/O enclosure adapter view (rear of the enclosure).
To see the attributes for all installed DAs or host adapters in the System Health overview, select Device Adapters or Host Adapters from System Health Overview (Figure 9-94 on page 311) to open the dialog that is shown in Figure 9-99.
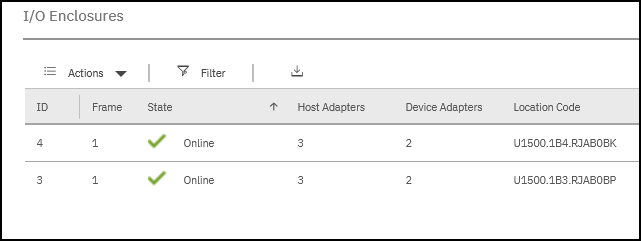
Figure 9-99 I/O Enclosures
The attributes for the I/O enclosure are described in the following list:
•ID: The enclosure ID.
•State: The current state of the I/O enclosure is one of the following states:
– Online: Operational and normal.
– Offline: Service is required. A service request to IBM was generated.
– Service: The enclosure is being serviced.
•Location Code: Logical location code of the I/O enclosure.
•DA: Number of DAs that are installed.
•Host adapter: Number of host adapters that are installed.
The FC ports are ports on a host adapter that connect the DS8900F to hosts, switches, or another storage system either directly or through a switch.
In the Hardware view, point to a port in the enclosure, and detailed information about the port appears. The port topology can be modified by selecting the port, right-clicking, and selecting Modify Fibre Channel Port Protocol, as shown in Figure 9-100.

Figure 9-100 I/O enclosure showing host adapter and FC ports
Here are the attributes for the FC ports:
•ID: The identification number of the FC port.
•State: The current state of the FC port is one of the following states:
– Communication Established: The FC port is operating normally.
– No Light Detected: There is no light that is detected on the port, so the port cannot process I/O.
– Unconfigured: The FC port protocol is not configured.
– Offline: The FC port requires service.
– Protocol: Use one of these FCPs:
• SCSI FCP: A method for transferring SCSI commands with FCP.
• FICON: FICON is a high-speed I/O interface for IBM Z host connections.
– WWPN: The unique 16-digit hex number that represents the WWPN of the FC port.
9.13.2 Viewing components health and state from the system views
The Hardware view and System Health overview are useful tools in the DS GUI to visualize the state and health of hardware components in the system. Two sample scenarios are illustrated here:
•Failed drives: Figure 9-101 shows two failed drives in one of the storage enclosures of the system. Clicking this enclosure from the Hardware view provides a detailed view of the enclosure with all the drives, including the failed drives. Hovering your cursor over the failed drives provide more information about them.

Figure 9-101 Hardware view with failed drives
The same information can be obtained by clicking the Show System Health Overview icon, as shown in Figure 9-101.
The System Health Overview opens and shows the failed state of the drives, as shown in Figure 9-102.

Figure 9-102 System Health Overview with failed drives
•Failed processor node: Figure 9-103 shows the Hardware view with a failed processor node. Hovering your cursor over the node provides more information about this component.

Figure 9-103 Hardware view with a failed processor node
The same information can be obtained from the System Health Overview, as shown in Figure 9-104.

Figure 9-104 System Health Overview with a failed processor node
9.13.3 Monitoring system events
The Events window displays all events that occurred within the storage system, whether they are initiated by a user or by the system.
The Events table updates continuously so that you can monitor events in real time and track events historically.
Events are categorized by five levels of severity:
•Error
•Warning
•Inactive error
•Inactive warning
•Information
To access the Events window, click Monitoring → Events. The Events window can also be displayed by clicking the Event Status icon, as shown in Figure 9-105.

Figure 9-105 System Events window
The events can be exported as a CSV file by selecting Export Table on the Events window. The Export Table action creates a CSV file of the events that are displayed in the Events table with detailed descriptions.
9.13.4 Exporting system-wide information
As shown in Figure 9-106, you can export detailed reports from the dashboard with the following system-wide information into a CSV file.

Figure 9-106 Export Performance Summary
•System Summary
This data includes CSV offload of the system summary (full hardware and logical configuration) by exporting individual tables (Volumes, I/O Ports, Users, and Volumes by LSS).
•Performance Summary
The performance data that is gathered at 1-minute intervals for up to one week can be exported for IBM Support analysis.
•Easy Tier Summary
You can directly offload the three CSV files and the Excel tool from both the DS GUI, as shown in Figure 9-111 on page 325, and the DS CLI (see 10.4.6, “IBM Easy Tier” on page 390). This download enables you to view the detailed data for Easy Tier planning, monitoring, and debugging.
Here are the offloaded CSV files:
– Workload categorization report: This report provides a method of classifying data activity that Easy Tier manages. This categorization includes a comparison of heat data across storage tiers.
– Workload skew curve report: This report provides a summary of workload distribution across tiers within a pool.
– Data movement report: This report provides details about Easy Tier data movement among the drive tiers on your storage system. Use the report to validate changes in tiers and the migration of warm and cool data.
For more information about Easy Tier, see IBM DS8000 Easy Tier (Updated for DS8000 R9.0), REDP-4667.
•Export Fibre Channel Connectivity Report
This report shows one row for every connected path between the DS8000 and a host system, a switch, or another DS8000. It also shows the status of these paths and their security settings. The report can be offloaded as a compressed file that contains a CSV file.
The CSV file name is IBM.2107-<serial>_fcconnectivity_<date>.csv, for example, IBM.2107-75DMC12_fcconnectivity_20210717.csv.
Example 9-1 shows a sample of the CSV file content, which can be imported and formatted in a spreadsheet tool such as Microsoft Excel.
Example 9-1 CSV content example
Local Port ID,LocalPort FC_ID,LocalPort WWPN,LocalPort WWNN,LocalPort Security Capability,LocalPort Security Config,LocalPort Logins,LocalPort Security Capable Logins,LocalPort Authentication Only Logins,LocalPort Encrypted Logins,AttachedPort WWPN,AttachedPort WWNN,AttachedPort Interface ID,AttachedPort Type,AttachedPort Model,AttachedPort Manufacturer,AttachedPort SN,RemotePort WWPN,RemotePort WWNN,RemotePort FC_ID,RemotePort PRLI Complete,RemotePort Login Type,RemotePort Security State,RemotePort Security Config,RemotePort Interface ID,RemotePort Type,RemotePort Model,RemotePort SN,RemotePort SystemName
I0000,0x012E00,0x5005076306001339,0x5005076306FFD339,Auth Capable Only,Disabled,1,0,0,0,0x202E8894715EC810,0x10008894715EC810,0x002E,008960,F64,IBM,0000010550HA,0x5005076306041339,0x5005076306FFD339,0x010600,Yes,Mirroring secondary, Notcapable,Disabled,0x0040,002107,996,0000000DMC01,Unknown
I0001,0x000002,0x5005076306005339,0x5005076306FFD339,Auth Capable Only,Disabled,1,0,0,0,0x5005076306009339,0x5005076306FFD339,0x0002,002107,996,IBM,0000000DMC01,0x5005076306009339,0x5005076306FFD339,0x000001,Yes,Mirroring primary and secondary,Notcapable,Disabled,0x0002,002107,996,0000000DMC01,Unknown
I0002,0x000001,0x5005076306009339,0x5005076306FFD339,Auth Capable Only,Disabled,1,0,0,0,0x5005076306005339,0x5005076306FFD339,0x0001,002107,996,IBM,0000000DMC01,0x5005076306005339,0x5005076306FFD339,0x000002,Yes,Mirroring primary and secondary,Notcapable,Disabled,0x0001,002107,996,0000000DMC01,Unknown
I0003,0x000001,0x500507630600D339,0x5005076306FFD339,Auth Capable Only,Disabled,1,0,0,0,0x10000000C9CED91B,0x20000000C9CED91B,0x0000,.....
Figure 9-107 illustrates the formatting that occurs when you import the data in XLS format. Data is presented as one or more lines per port, depending on number of logins. This data illustrates four ports on one adapter, which are split into three captures for presentation.

Figure 9-107 Example XLS format
9.13.5 Audit logs
Audit logs provide a record for auditing purposes to determine when changes were made to a storage system and by which user.
The audit log is an unalterable record of all actions and commands that were initiated by users on the system through the DS GUI, DS CLI, DS Network Interface (DSNI), or
IBM Spectrum Control. The audit log does not include commands that were received from host systems or actions that were completed automatically by the storage system. The audit log is downloaded as a compressed text file.
IBM Spectrum Control. The audit log does not include commands that were received from host systems or actions that were completed automatically by the storage system. The audit log is downloaded as a compressed text file.
An audit log for the DS8900F can also be exported by selecting Export Audit Log on the Events window, as shown in Figure 9-108.

Figure 9-108 Export Audit Log
9.14 Performance monitoring
Performance data is presented directly on the initial dashboard view, or you can view it by clicking the Monitoring tab of the menu. To monitor the performance, complete the following steps:
1. From the System window, select the Monitoring icon.
2. Click Performance to display graphs that track performance indicators. The performance indicators include IOPS, latency, bandwidth, cache read hits, and write delays.
3. The Performance window includes four preset graphs, which are listed in the Favorites menu. These preconfigured graphs can be seen by clicking the Favorites menu icon, as shown in Figure 9-109. You also can set any of these graphs as the default.

Figure 9-109 Performance Monitoring window
You can create your own performance graphs for the storage system, pools, volumes, and FC ports. You can use predefined graphs and compare performance statistics for multiple pools, up to six volumes at a time, or FC ports.
Figure 9-110 shows a comprehensive view of the available performance functions.

Figure 9-110 Performance monitoring graph comprehensive view
To learn how to obtain statistics from the DS CLI, see 10.5, “Metrics with DS CLI” on page 391.
9.14.1 Performance statistics
|
Important: All the listed performance statistics are averaged over 1 minute. The performance graphs cover data that is collected for the last 7 days. For long-term performance statistics, use IBM Spectrum Control.
|
Users can monitor the following resources and performance metrics:
•System performance metrics:
– IOPS: Total number of processed requests in thousand I/O operations per second (KIOPS) for the selected I/O operations.
– Latency: Response time in milliseconds (ms) for the selected I/O operations.
– Transfer Size: Number of kilobytes per I/O operation (KB/operation) for the selected I/O operations.
– Bandwidth: Number of megabytes per second (MBps) for the selected bandwidth type.
– Cache: Percentage of read hits (read I/O operations that were fulfilled from the system cache or memory) and write delays (I/O operations that were delayed because of write cache space constraints or other conditions) during 1 minute.
– Capacity: Total capacity and provisioned capacity of the storage system in GiB.
– Power: Power usage of the storage system in watts.
– Temperature: Average temperature of the storage system in degrees Celsius.
•Array performance metrics:
– Back-end IOPS: Number of requests that were processed on the selected arrays in KIOPS for the selected I/O operation type.
– Back-end Latency: Response time in ms for the selected I/O operations that were processed on the chosen arrays.
– Transfer Size: Number of KB/operation for the selected I/O operations (read, write, or average of both) that were processed on the selected arrays.
– Back-end Bandwidth: Number of MBps for the selected bandwidth type (read, write, or combined total) that was processed on the selected arrays.
– Utilization: Array utilization in %.
•Pool performance metrics:
– Back-end IOPS: Number of requests that were processed on the arrays in the pool in KIOPS for the selected I/O operation type.
– Back-end Latency: Response time in ms for the selected I/O operations that were processed on the arrays in the pool.
– Transfer Size: Number of KB/operation for the selected I/O operations (read, write, or average of both) that were processed on the arrays in the pool.
– Back-end Bandwidth: Number of MBps for the selected bandwidth type that was processed on the arrays in the selected pools.
– Usable Capacity: Used, provisioned, and usable capacity, in GiB, in the pool.
– Over-provisioned ratio: Over-provisioned capacity of the pool as a ratio of defined capacity over total capacity.
– Data activity (Easy Tier): Capacity distribution of tiers in the pool showing capacity that is active, inactive, or in-between. You can click the bar graphs to zoom in and see a history of values.
– Data movement (Easy Tier): Historical information showing the amount of data that is moved by Easy Tier within the pool.
– Data policy (Easy Tier): The capacity of a pool’s tiers that is pinned (assigned) to each tier.
•Volume performance metrics:
– I/O: Measure the I/O in IOPS or Latency.
– Bandwidth.
– Data activity (Easy Tier): Capacity distribution of tiers in the volume showing capacity that is active, inactive, or in-between. You can click the bar graphs to zoom in and see a history of values.
– Data policy (Easy Tier): The capacity of a volume’s tiers that is pinned (assigned) to each tier.
•LSS performance metrics:
– IOPS: Number of requests that are processed on the LSS in KIOPS for the default I/O operations (read, write, and total).
– Latency: Response time in milliseconds (ms) for the default I/O operations (read, write, and average) that are processed on the LSS.
– Bandwidth: Number of MBps for the selected bandwidth type (read, write, and total) that is processed on the LSS.
•HOST performance metrics:
– IOPS: Number of requests that are processed on the host, in KIOPS for the default I/O operations (read, write, and total).
– Latency: Response time in ms for the default I/O operations (read, write, and average) that is processed on the host.
– Bandwidth: Number of MBps for the selected bandwidth type (read, write, and total) that is processed on the host.
•FC port performance metrics:
– IOPS: Number of processed requests in KIOPS for the selected I/O operations (read, write, and total) on the FC port.
– Latency: Response time in ms for the selected I/O operations on the FC port.
– Transfer Size: Number of KB per operation for the selected I/O operations on the FC port.
– Bandwidth: Number of MBps for the selected bandwidth type on the FC port.
You can use these performance metrics to define your own graphs. To add the custom graph to the Favorites menu, click the star icon, as shown in Figure 9-109 on page 322. You may also export the sample date that is used to create the performance graphs into a CSV file by clicking the Save icon, as shown in Figure 9-111.

Figure 9-111 StorageSystem_PerformanceSample export CSV file
9.14.2 Working with customized performance graphs
The DS GUI offers four predefined performance graphs, which are available in the Favorites menu, as shown in Figure 9-112.

Figure 9-112 Predefined graphs
For detailed performance analysis, you can define more detailed statistics and graphs, which can help identify and isolate problems. You can perform the following actions:
•Define your own performance graphs on demand.
•Add defined graphs to the Favorites menu.
•Pin defined graphs to the toolbar.
•Set defined graphs as a default in the Performance window.
•Rename or delete your graphs. You cannot delete predefined graphs.
•Change the time range of displayed graphs.
Creating array performance graphs
To create a graph from the System window, click the Monitoring icon. Click Performance to open the Performance Graphs window. Hover your cursor over the left bar and click to create a chart, as shown in Figure 9-113.

Figure 9-113 Creating a chart
Figure 9-114 demonstrates how to complete the following steps (each step number is referenced in the figure):
1. Select Array from the resources to monitor.
2. Select the arrays to monitor.
3. Select the metrics that you want (I/O, Bandwidth, or Utilization).

Figure 9-114 Array graph definition window
4. Draw the graph, which is shown in Figure 9-115.

Figure 9-115 Array performance graph: Total Utilization
|
Note: Array Utilization is the respective addition to Array performance metrics. When selected, it monitors the total utilization of the array.
|
To create a graph of a pool’s performance, see Figure 9-113 on page 326, which shows how to create a chart, and then complete the following steps:
1. Select Pool from the resources to monitor.
2. Select the pool name to monitor.
3. Select the metrics that you want.
Figure 9-116 shows the metric options that are available for the selected pool.

Figure 9-116 Pool graph definition window
4. Draw the graph, which is shown in Figure 9-117.

Figure 9-117 Pool performance graph
You can monitor Easy Tier directly in the DS GUI by using the workload categorization report and migration report. Figure 9-118 shows the Easy Tier pool level workload settings for creating total data movement report that is shown in Figure 9-119.

Figure 9-118 Example of Easy Tier settings for total Data Movement
Figure 9-119 shows an example of the Total Data Movement report.

Figure 9-119 Easy Tier pool level workload reports (Total Data Movement)
You can create an Easy Tier Data Activity Report for Pools and Volumes to monitor performance and to verify that data is placed in the right place. Select a pool to monitor, and then in the Easy Tier section select All Tiers for Data Activity, as shown in Figure 9-120.
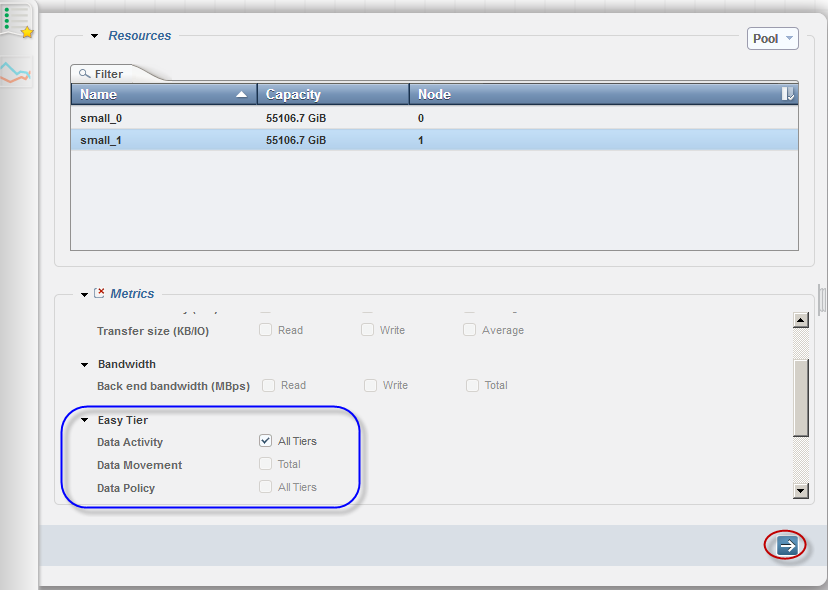
Figure 9-120 Example of Easy Tier Data Activity Report setup
An example report of Easy Tier Data Activity for a pool is shown in Figure 9-121.

Figure 9-121 Example of Easy Tier Data Activity Report
Creating system performance graphs
Figure 9-113 on page 326 shows the steps to start a chart. To create the graph of the system’s performance as shown in Figure 9-122, complete the following steps:
1. Select System from the resources to monitor.
2. Select the system to monitor.
3. Select the metrics that you want.

Figure 9-122 System graph definition window
4. Draw the graph, which is shown in Figure 9-123.

Figure 9-123 System performance graph
Creating FC port performance graphs
Start a chart as shown in Figure 9-113 on page 326. To complete the sequence that is indicated by the numbers in Figure 9-124 to create an FC port performance graph, complete the following steps:
1. Select Fibre Channel Port from the resources to monitor.
2. Select the system to monitor.
3. Select the metrics that you want.

Figure 9-124 Fibre Channel Port graph definition window
4. Draw the graph. Figure 9-125 shows the completed graph.

Figure 9-125 Fibre Channel Port performance graph
Creating volume performance graphs
Start a chart as shown in Figure 9-113 on page 326. To create the Easy Tier performance graphs for the volume, as shown in Figure 9-126, complete the following steps:
1. Select Volume from the resources to monitor.
2. Select the volumes to monitor (you can select up to six volumes at a time for a graph).
3. Select the metrics that you want for I/O: Bandwidth or Easy Tier.

Figure 9-126 Volume Performance graph definition window
4. Draw the graph. Figure 9-127 shows the bandwidth graph for a set of five volumes.

Figure 9-127 Volume performance graph
|
Note: The Performance action on the Volume, Host, and LSS resources is also available in all pages where they are shown. For any Volume, Host, or LSS, select Performance from the Action menu and then click the metric that you want to monitor. The performance window for the selected resource and metric opens. Figure 9-128 shows the performance actions and metrics that are available for a volume on the Volume by LSS page.
|

Figure 9-128 Performance action for a volume
Adding a graph to the Favorites menu
You can add a graph to the Favorites menu by completing the sequence that is indicated by the numbers that are shown in Figure 9-129 on page 335:
1. Click the icon Add to Favorites.
2. Enter a name for it.
3. Search and display your favorite graphs from the list.

Figure 9-129 Adding a graph to the Favorites menu
Pinning a graph to the toolbar
Graphs that are added to the Favorites menu can be pinned to the toolbar to enable faster access by completing the sequence that is indicated by the numbers that are shown in Figure 9-130.

Figure 9-130 Pinning a graph to the toolbar
9.15 Fibre Channel error rate statistics
Errors that occurred during data transmission through FC ports over the past 24 hours can be displayed in the Error Rates for Fibre Channel Port window in the Network window, as shown in Figure 9-131. This feature is useful for a proactive check of SAN-related issues from a DS8900F perspective.

Figure 9-131 Fibre Channel Port error rate statistics
The following list shows all of the statistics that are available for port error checking:
•Total errors. The total number of errors that were detected on the FC port.
•Error frame: An FC frame was received that was not consistent with the FCP.
•Link failure: FC connectivity with the port was broken. This type of error can occur when the system that is connected to the port is restarted, replaced, or serviced, and the FC cable that is connected to the port is temporarily disconnected. It can also indicate a faulty connector or cable. Link failures result in degraded performance of the FC port until the failure is fixed.
•Loss of sync: A synchronization loss error was detected on the FC link. This type of error can occur when the system that is connected to the port is restarted, replaced, or serviced, and the FC cable that is connected to the port is temporarily disconnected. It also can indicate a faulty connector or cable. If a synchronization loss error persists, it can result in a link failure error.
•Loss of signal: A loss of signal was detected on the FC link. This type of error can occur when the system that is connected to the port is replaced or serviced, and the FC cable that is connected to the port is temporarily disconnected. It also can indicate a faulty connector or cable. If a loss of signal error persists, it can result in a link failure error.
•Cyclic redundancy check (CRC) error: An FC frame was received with CRC errors. This type of error is often fixed when the frame is retransmitted. This type of error is often recoverable and it does not degrade system performance unless the error persists and the data cannot be relayed after retransmission.
•Primitive sequence protocol error: A primitive sequence protocol error was detected. A primitive sequence is an ordered set that is transmitted and repeated continuously to indicate specific conditions within the port. The set also might indicate conditions that are encountered by the receiver logic of the port. This type of error occurs when an unexpected primitive sequence is received.
•Transmission word count: A bit error was detected. A transmission word is the smallest transmission unit that is defined in FC. This unit consists of four transmission characters,
4 x 10, or 40 bits. This type of error can include code violations, invalid special code alignment, and disparity errors.
4 x 10, or 40 bits. This type of error can include code violations, invalid special code alignment, and disparity errors.
•Link reset transmitted: The state of the FC port changed from active (AC) to link recovery (LR1).
•Link reset received: The state of the FC port changed from active (AC) to link recovery (LR2) state.
•Out of order data: A missing frame was detected. The frame was either missing from a data sequence or it was received beyond the FC port’s sequence reassembly threshold.
•Out of order acknowledgment (ACK): An out of order ACK frame was detected. ACK frames signify that the transmission was received. The frame was either missing from a data sequence or it was received beyond the FC port’s sequence reassembly threshold.
•Duplicate frame: A frame that was detected as previously processed was received.
•Invalid relative offset: A frame with an invalid relative offset parameter in the frame header was received.
•Sequence timeout: The FC port detected a timeout condition when a sequence initiator was received.
•Uncorrectable bad blocks: A data block with errors was unable to be fixed by Forward Error Correction (FEC).
•Correctable bad blocks: A data block with errors was fixed by FEC.
•Transport mode write retries: A transport mode write operation retry was requested. The buffer was not large enough to receive unsolicited data.
9.16 Providing feedback
Thirty days after the first login, a feedback request appears on the upper right under “Suggested tasks”, as shown in Figure 9-132. Click Run Task and a window opens that leads you through a survey. The task appears for all users in the system. After the feedback is complete, the system does not ask the particular user for further online feedback. After downloading the new bundle updates, it is not necessary to complete the survey again. If you click Not now, the feedback request can be snoozed for 90 days.

Figure 9-132 Suggested Tasks window
..................Content has been hidden....................
You can't read the all page of ebook, please click here login for view all page.