

GDPS Enterprise Portal
In most cases, GDPS clients deploy more than one GDPS environment.
Multiple GDPS environments are deployed for various reasons, including the following examples:
•In most cases, clients have at least one production environment, one development or test environment, and one sandbox (or sandpit) environment.
When a client has multiple production environments, they might have corresponding development or test and sand box environments for each development environment.
•Clients sometimes have a separate production environment for each line of business.
•Global clients often have separate production environments for each geographical location in which they do business.
This need for many environments can add up to a significant number of GDPS environments and as the number of GDPS environments increases, the difficulty of managing all of the environments also increases. Even something as simple as determining whether any environments are experiencing any issues requires a user (or multiple users) to log on to at least one GDPS controlling system per environment, either by using NetView or the GDPS GUI.
Fortunately for clients with multiple GDPS environments, GDPS provides a function that is known as the GDPS Enterprise Portal (also referred to as the GDPS Portal or the Portal). The GDPS Portal provides a single point of control for monitoring and managing all of your GDPS environments.
In this chapter, we provide an overview of the GDPS Portal, which is a feature that includes with a GDPS license, along with the GDPS GUI.
This chapter includes the following topics:
12.1 Viewing your GDPS environments
The GDPS Portal provides a logical view and a physical view of your GDPS environments. These views are described next.
12.1.1 Logical view
The logical view provides a representation of the logical entities in each of your GDPS environments. Logical entities include systems (production and GDPS controlling systems), coupling facilities, replication, sites, and mirroring relationships.
Figure 12-1 shows an example of the logical view.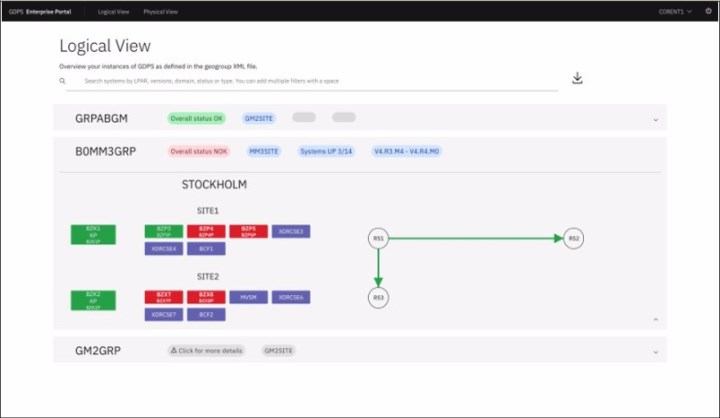
Figure 12-1 Logical view of GDPS Portal
As shown in Figure 12-1, three different GDPS environments are presented:
•The first section represents the environment GRPABGM in our example. The section for GRPABGM is not expanded, but from the summary information that is provided, we can see that GRPABGM is a 2-Site GDPS Global - GM environment with an overall status of OK. That is, all of the systems are active and mirroring (Global Mirror) is running normally.
•The second section represents the environment B0MM3GRP in our example. From the summary information that is provided for this environment, we can see that it is a 3-site GDPS Metro environment (also known as a GDPS Metro Dual Leg environment).
We can also see from the summary information that the overall status for the environment is Not OK (NOK), meaning that at least one unexpected condition exists in the environment.
The section representing B0MM3GRP is expanded to provide the following information about the systems in the environment:
– The region in which the environment exists is called STOCKHOLM.
– Two systems in SITE1 and one system in SITE2 are green, which indicates that they are active.
– Two systems in SITE1 and two systems in SITE2 are red, which indicates that they are down.
– Three systems in SITE1 and four systems in SITE2 are purple, which indicates that they are manual systems; therefore, the status of these systems is unknown.
Clicking a system in the expanded section provides more information about that system. In Figure 12-2, the user clicked the z/OS production system that is named BZP3.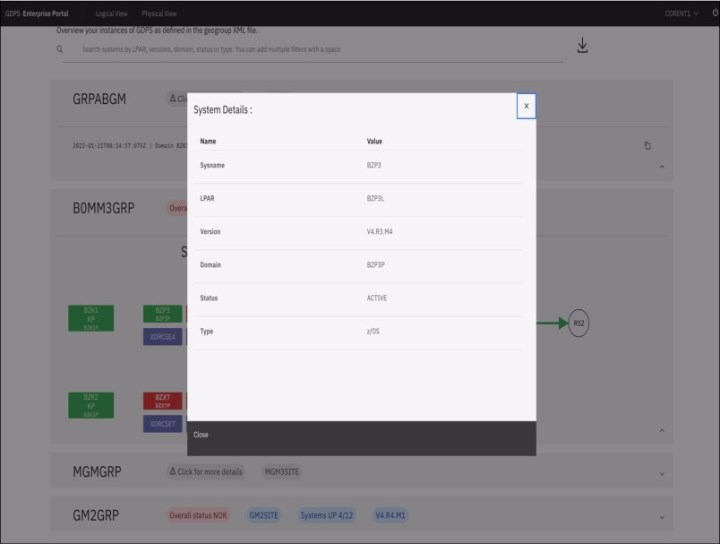
Figure 12-2 More system information
As shown in Figure 12-2, the information box that is presented for system BZ3P provides the following information:
– LPAR in which the system is running
– Level of GDPS that is running on the system
– Name of the NetView domain in which the system runs
– System’s status
– System type
Also in the expanded section for B0MM3GRP (see Figure 12-1 on page 346), three replication sites (RS1, RS2, and RS3) and the arrows between RS1 and RS2 and between RS1 and RS3 represent mirroring (Metro Mirror) for the two replication legs. The fact that the arrows are green indicates that mirroring is running normally.
Hovering over one of the arrows that represents the replication legs provides more information about the replication leg. As shown in Figure 12-3, the user hovered over the replication leg between RS1 and RS2.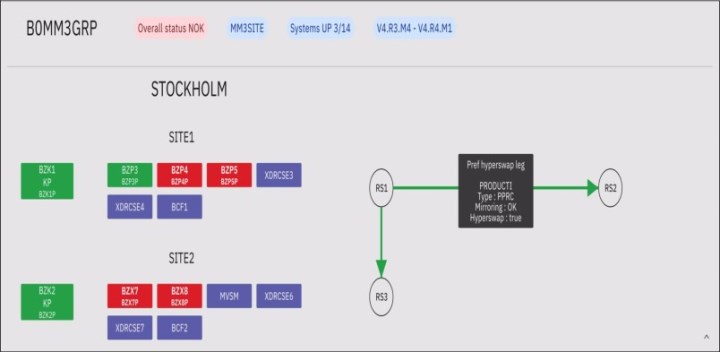
Figure 12-3 More replication leg information
The informational box that is shown provides the following information:
– Leg is the preferred HyperSwap leg
– Consistency group that is associated with the leg is called PRODUCTI
– Mirroring status is OK
– HyperSwap is enabled on the leg
•The third section that is shown in Figure 12-1 on page 346 represents the environment that is called GM2GRP in our example.
In the summary information for GM2GRP, we can see that it is another 2-site GDPS Global - GM; however, the status button is gray and includes the text: Click for more details. Clicking this button displays more information about the status. In this case, the GDPS Portal cannot connect to the GDPS controlling systems in the GM2GRP environment.
12.1.2 Physical view
The physical view provides a representation of the physical entities in each of your GDPS environments. Physical entities include host servers (CPCs), disk storage systems, and mirroring links.
Figure 12-4 shows an example of the physical view.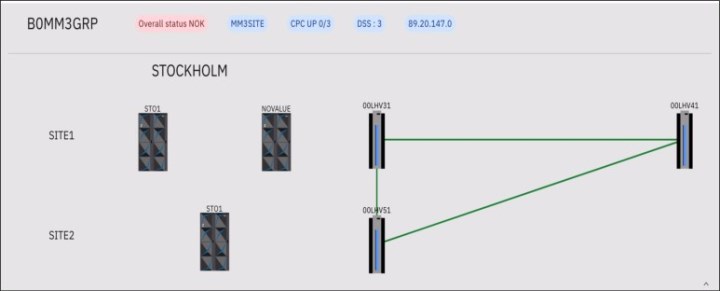
Figure 12-4 GDPS Portal - physical view
As shown in Figure 12-4, we again see a representation of the environment that is named B0MM3GRP, which is the same environment that was represented in the expanded section of the window that is shown in Figure 12-1 on page 346.
We see the same summary information for B0MM3GRP that we saw before, however; this time, we see CPCs instead of systems. Also, we see disk storage systems instead of replication sites.
We also now see that the systems in SITE1 are running on two CPCs and the systems in SITE2 are running on a single CPC. We also see that two disk storage systems exist in SITE1 and one disk storage system in SITE2. The two disk storage systems in SITE1 correspond to the two logical replication sites in SITE1, as shown in Figure 12-1 on page 346.
Clicking one of the CPC’s displays more information, as shown in Figure 12-5.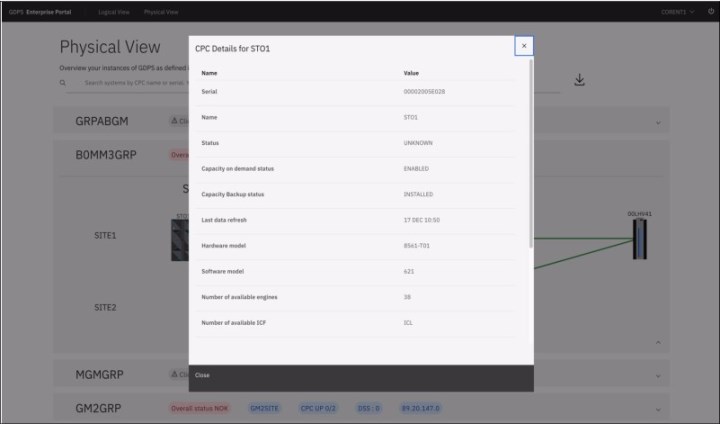
Figure 12-5 More CPC information
In this case, the user clicked the CPC in SITE1 named STO1. The extra information that is shown in the box that is shown includes the CPC serial number and status, status of capacity on demand (OOCoD) and capacity backup (CBU), the hardware and software model numbers, the number of available engines, and more.
The green lines between the disk storage systems represent the PPRC links over which Metro Mirror is flowing. In this case, the fact that the lines are green indicates that the PPRC links are all active. Hovering over the lines provides more information, such as how many links exist between the primary and secondary disk storage systems and the status of each link.
12.2 Managing your GDPS environments
The GDPS Portal provides a single point of control for monitoring and managing your GDPS environments. When you need to view a specific environment at a more detailed level or you need to change a specific environment, you can “drill down” to the GDPS graphical user interface (GUI) for that environment where you can then perform these tasks.
To use the GUI, click one of the GDPS controlling systems from the logical view, as shown in Figure 12-6.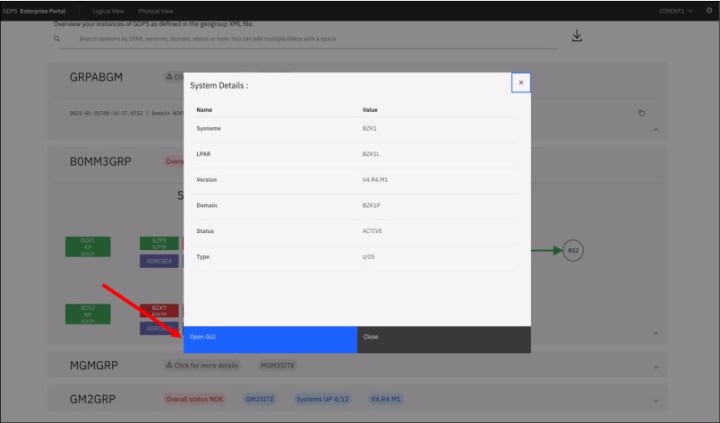
Figure 12-6 Drilling down to a specific GDPS environment
As shown in Figure 12-6, the user clicked the system in SITE1 that is named BZK1, which is one of the GDPS Metro controlling systems in the B0MM3GRP environment. The information box that is shown includes a button that is labeled Open GUI,” which is highlighted by a red arrow in Figure 12-6.
Clicking this button takes you to the dashboard of the GDPS Metro GUI for the B0MM3GRP environment.
..................Content has been hidden....................
You can't read the all page of ebook, please click here login for view all page.