Chapter 9. Clinical Case Studies
Sections
Cardiac Medication Administration at Virtua Health
Reducing Surgical Site Infections at Charleston Area Medical Center
Reducing CVC-Related Bloodstream Infections at Florida Hospital
Preventing Infections at Decatur Memorial Hospital
Reducing Nosocomial Pressure Ulcers at Thibodaux Regional Medical Center
Glucose Control in the Adult ICU at Valley Baptist Health System
Six Sigma and related methodologies have proven valuable in removing barriers and bringing greater consistency to the healthcare environment. Although many healthcare executives will readily admit they have been able to achieve some measure of cost savings or revenue enhancement through the use of Six Sigma, they often cite other reasons for pursuing this strategy. In some cases, the organization is seeking to equip their workforce with new skills and a stronger set of problem-solving tools. One of the most prevalent reasons for Six Sigma adoption in healthcare, however, is to provide a rigorous, evidence-based structure for improving services and supporting the goal of delivering safe, high-quality clinical care. From medication administration to the prevention of hospital-acquired infections, healthcare providers are finding numerous opportunities to apply methods such as Six Sigma and Lean.
Partly because of its origination in the manufacturing environment, there is a broader track record of operationally focused projects such as supply chain management, billing cycle time, variability in product quality, and so on. The uniquely human aspects of healthcare have required a special adaptation of Six Sigma and ongoing collaboration with clinicians so that the benefits are not lost in translation. Because of the scientific nature of Six Sigma, physicians in particular tend to respond favorably after they have seen how the process actually works and the impact it can make on their ability to care for patients.
The following case studies demonstrate the versatility and widespread relevance of this approach within the clinical environment.
Cardiac Medication Administration at Virtua Health
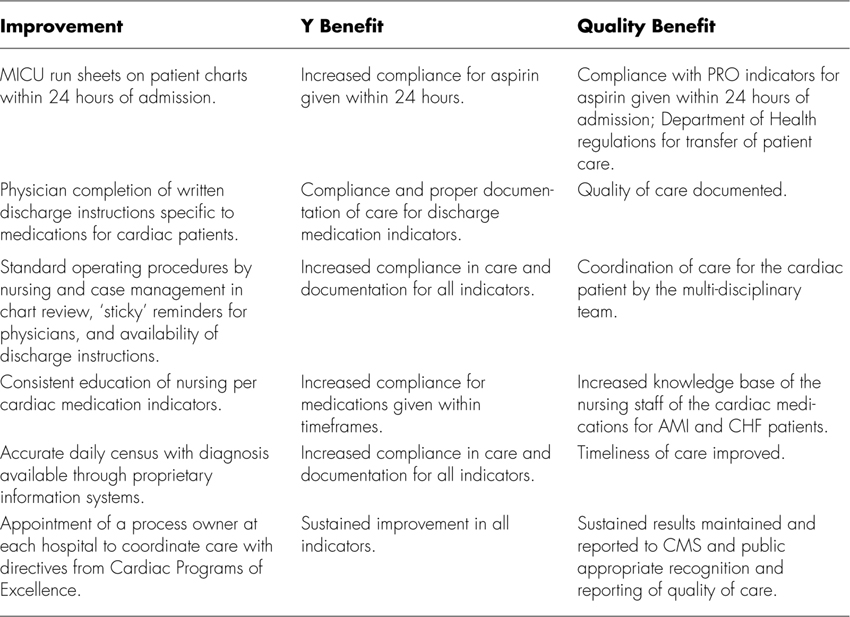
To support a “Cardiac Program of Excellence” launched in 2002, Virtua Health began a Six Sigma project that would focus on key aspects of the initiative. During the Define phase, the team developed the following project description: “Increase quality of patient care by use/non-use and appropriate documentation of aspirin, beta-blockers, and ACE inhibitors in congestive heart failure (CHF) or acute myocardial infarction (AMI) patients to achieve or exceed Virtua benchmark goals.”
The project would include Virtua’s four acute care facilities, within all medical disciplines, to meet guidelines set by the Joint Commission on Accreditation of Healthcare Organizations (JCAHO). The team anticipated the project would yield better outcomes for patients with AMI/CHF diagnoses by adhering to evidence-based practice, compliance with regulatory standards, and enhanced quality of care.
During the Measure phase, data analysis indicated variation between reports from the quality review analysts (QRAs) and Virtua’s review. Gage R&R was used to examine the existing process, reconcile the differences, and develop an accurate measurement system that would meet CMS standards (Centers for Medicare and Medicaid Services, http://www.cms.hhs.gov/).
Inconsistencies with data measurement were addressed during a working session with the QRAs and case management directors to examine process flow and establish standard operating procedures (SOPs) for chart review. The team also developed a plan to communicate the new SOPs to the nursing and medical staffs.
The levels of defects per million opportunities (DPMO) were identified for each indicator for AMI and CHF. With a goal of zero defects, the team found significant room for improvement since baseline data indicated a 4 percent defect rate for AMI patients and a 10.2 percent defect rate for CHF patients (see Figure 9.1).
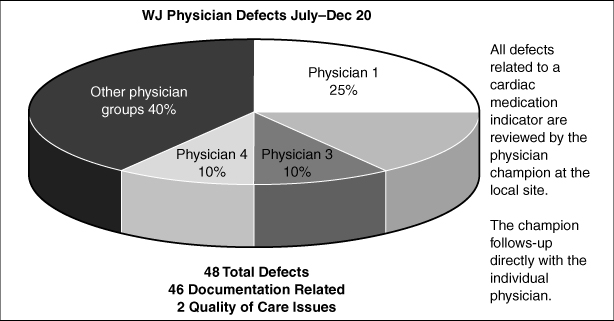
Figure 9.1. West Jersey physician defects
The team initially focused on administering a beta-blocker within 24 hours of admission and prescription of an ACE inhibitor when discharging AMI patients. They instituted 100 percent chart review and involved nursing staff, case management, quality teams, and physician’s staff in education and review.
During the Measure phase, a Gage R&R revealed variation on assessment between the QRA review of charts. A Work-Out was held with the QRAs and case management directors to develop SOPs in reviewing CHF and AMI patients for core indicators.
Analyze and Improve
As the project entered the Analyze phase, the team held bi-weekly meetings and focused on data analysis to ensure the data collection process had improved. They created detailed process maps and identified drivers of variation.
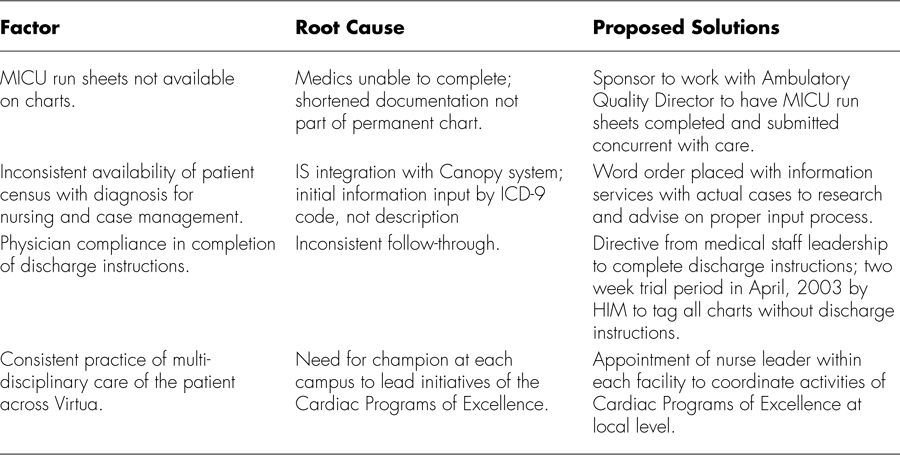
Based on data from the chart review, they found that 46 out of 48 defects involving physicians were due to documentation issues. The team held another Work-Out, piloted best practices, and coordinated medical leadership with nursing and case management to standardize practice and eliminate some variables. They also developed a root cause analysis (see Table 9.1).
Table 9.1. Root Cause Analysis
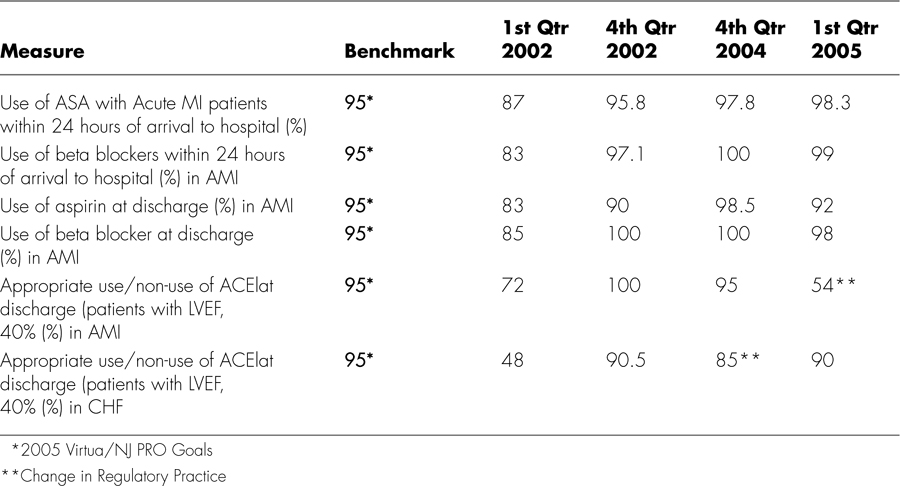
The team established standard processes for regular physician-to-physician correspondence, and created a flow chart and monthly reports for tracking purposes. Another key step was the use of Failure Mode and Effects Analysis (FMEA) prior to closing the project and the development of a standardized data collection form. As shown in Table 9.2, Virtua has consistently achieved overall improvement in CMS cardiac standards as a result of the project and implemented changes.
Table 9.2. Virtua Health Performance of CMS Cardiac Medications Standards
Six Sigma helped identify root causes for process failure in appropriately administering and documenting cardiac medication. Solutions included physician and staff education, stocking aspirin on each hospital floor and shortening the form paramedics must complete. The project surpassed benchmarks, and the results have been maintained (see Table 9.3).
Table 9.3. Realized Results of Implemented Solutions
Reducing Surgical Site Infections at Charleston Area Medical Center
The Centers for Disease Control estimates that 500,000 surgical site infections occur each year in the U.S., out of approximately 30 million surgical procedures performed. A single infection may require an additional hospital stay of seven days, an extra $3,000 in charges, and a 60 percent greater chance of being placed in an intensive care unit. The patient is also five times more likely to be readmitted to the hospital, with twice the incidence of mortality. In 2002, a Surgical Infection Prevention Project (SIPP) led to the issuance of new guidelines by the Centers for Medicare and Medicaid Services and the Centers for Disease Control and Prevention, seeking to reduce surgical site infection (SSI) rates by improving the selection and timing of prophylactic antibiotic administration.
As part of an ongoing improvement program, Charleston Area Medical Center (CAMC) in West Virginia brought together a multidisciplinary Six Sigma team to address SSIs, including two surgeons, an anesthesiologist, an epidemiologist, safety personnel, the chief of CRNAs, a Six Sigma Black Belt, and a Six Sigma Green Belt.
The team scoped the project to include the immediate pre-operative phase and up to 30 days post discharge for colon and vascular surgery patient populations only. Because the focus was on prophylaxis, patients already on antibiotics for any reason prior to surgery would not be considered in scope.
The following indicators for antibiotic administration would be measured:
• Recommended antibiotic appropriate for specific surgery.
• Dose administered at the right time (0–60 minutes prior to incision, with the exception of vancomycin which is in the 0–120 range). (Antibiotic must be completely infused prior to tourniquet inflation.)
• Administration of right dose based on weight. Medication and antibiotics are not “one size fits all.”
• Appropriate intraoperative re-dose if the surgery is longer than 240 minutes.
• Discontinuing the prophylactic antibiotic within 24 hours of surgery to reduce the risk for development of antibiotic-resistant organisms.
Define and Measure
The project began with data collection and building a business case for action. With initial process measurements at 0 sigma and 660,828 DPMO, there was obviously room for improvement. The team looked at the percentage of surgical patients acquiring an infection during their hospital stay, and considered factors such as mortality and morbidity rates and length of stay. Baseline data indicated that many patients arrived in the pre-operative holding area of the OR without a written antibiotic order, and that antibiotics may be administered too early or too late. Consistently assuring weight-based dosage was also an issue. Finally, patients undergoing procedures longer than 240 minutes (360 minutes for vancomycin administration) did not routinely receive an appropriate re-dose of antibiotic.
Figure 9.2 illustrates the ideal process designed to ensure that the antibiotics are administered correctly and at the right time.
Source: Charleston Area Medical Center
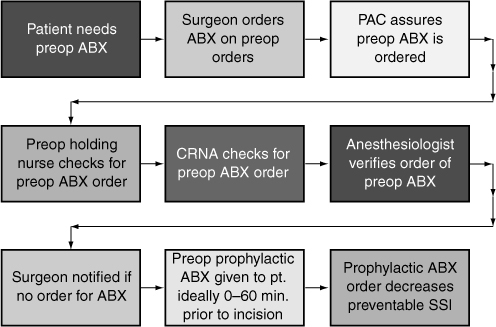
Source: Charleston Area Medical Center
Figure 9.2. Ideal prophylactic antibiotic process
Tools such as FMEA and fishbone diagrams were used during the Analyze and Improve phases to identify critical factors impacting infection rates. The data pointed to variability among surgeons and anesthesiologists, and processes were examined to find and share best practices.
Even with an early order for antibiotics from the surgeon, OR delays could prevent timely administration. A stakeholder analysis helped to support the statistical findings and create a shared need. Gaining acceptance from the staff, the team began to introduce new procedures and solutions, including a database for indicator monitoring reporting, revision of the pre-operative order set, development of a physician report card, and education of physician office staff, CRNAs, anesthesiologists, surgeons, residents, and OR staff.
Additional changes included having RN staff and anesthetists prompt the physician for an antibiotic order if the patient arrives in the pre-operative holding area without one or with one that is not recommended. They began posting appropriate antibiotics and doses for colon and vascular surgeries beside each patient and nurse’s station, in the medication preparation area, and in key locations within the surgical area. Error-proofing techniques were used to revise the pre-operative physician order form to include recommended antibiotics with proper doses and re-dose times.
A “Who-What-When” (WWW) plan was created to track more than 200 tasks, and the team gave staff a new post-op order set to quickly check the right boxes instead of writing everything out. Posters, signs, and a puzzle displaying indicators were developed, while visual reminders in the OR prompted the staff regarding timely re-dose of the antibiotic.
Ongoing education is helping to maintain results, and as new residents enter the hospital they learn the processes that have been established to reduce infection rates. Following the close of the project, the rate at which surgical patients receive the right dose of antibiotic at the right time improved 91 percent from 0 sigma to 2.86, and progress is continuing. In addition to improving patient safety, the business case demonstrated annual savings in excess of $1 million. When CMS began monitoring the SSI indicators, CAMC was already one year and nine months into the project, and was able to demonstrate measurable improvement.
Several measures were put in place to control results:
• Prophylactic antibiotics added to the pre-induction and pre-incision time-out.
• Pre-operative and intra-operative indicators to be monitored by the Surgical Quality Improvement Council, with individual results sent to surgeons, anesthesiologists, and CRNAs.
• A Six Sigma team completed a project for the discontinuation of post-operative antibiotics in 24 hours.
• A Six Sigma team completed a project for the glucose control for cardiac patients and is working on one for all surgical patients.
• A Six Sigma team completed a project for inadvertent hypothermia prevention.
• A Six Sigma team is currently addressing VTE prophylaxis.
• A project binder documenting the entire project was prepared for the administrators and physician champion.
• The results and project process were shared with the Peripheral Vascular Services Collaborative Practice and Surgical Quality Improvement Council.
CAMC continues to monitor these completed projects, and they are still in control with consistent results of 98-100% compliance.
According to Deborah Young, RN at CAMC, this project translated to benefits for the patient, but it also helped to raise staff satisfaction and save valuable resources and time that can be spent in other care areas. By avoiding the longer length of stay, the hospital can improve capacity and access to care for other patients. “Multiple Six Sigma projects have positioned Charleston Area Medical Center as a leader in the nation regarding the CMS indicators. We won a Premier Award for Quality for our Hip and Knee Surgery in July 2006 and were number one in the country for open heart surgery. The awards are wonderful recognition, but the greatest reward is that we know we are providing the highest quality of care for our patients.”
An article on this project was first published in the July/September 2004 issue of Patient Safety and Quality Healthcare, written by Carolyn Pexton and Deborah Young (http://www.psqh.com/julsep04/pextonyoung.html).
Reducing CVC-Related Bloodstream Infections at Florida Hospital
In addition to surgical site infections, another issue hospitals are confronting involves infections acquired through central venous catheters (CVC). The catheters provide critically ill patients with necessary fluids, medication, nutrition, and monitoring. The use of CVCs, however, presents a risk of bloodstream infection (BSI), with associated treatment costs ranging from $34,508 to $56,000.
At Florida Hospital, a 1,800 bed healthcare system with seven campuses in central Florida, a Six Sigma project led by Lois Yingling, RN, MSN, CPHQ, helped to target this critical issue. The hospital closely monitors BSI rates, and the internal benchmark is the aggregate top quartile for critical care set by the National Nosocomial Infections Surveillance (NNIS) System.
The overall BSI rate is calculated by dividing the number of central line associated BSIs by patient days multiplied by 1,000. Patient days are used for overall BSI calculation, as device days are not tracked for all units. Internal benchmarks are adjusted downward on an annual basis, per control charts and trends.
For this project, baseline metrics were the overall BSI rate and BSI cases secondary to CVCs in 2003. During the year, efforts to reduce BSI included a policy banning artificial nails for direct care providers, conversion to 2 percent chlorhexadine skin prep on supply carts, and BSI staff education. As a result, the overall BSI rate decreased by more than 40 percent in 2004.
Applying Six Sigma was seen as furthering the effort to prevent bloodstream infections. It was also viewed as a learning opportunity for the cross-functional project team led by a Black Belt and mentored by a Master Black Belt, with participation from an infectious disease physician, infection control practitioners, a nurse manager, nursing educators, front-line nursing staff, an intravenous access nurse, a laboratory technician, and a nurse from materials management.
Define and Measure
The scope for the project included inpatients older than 17 year of age with a positive blood culture within 48 hours of admission or re-admission within two weeks with a confirmed CVC-related BSI based on the CDC definition. Considered out of scope would be patients with BSI secondary to tunneled lines, port line, dialysis lines, peripherally inserted central catheter (PICC) lines, or peripheral lines. Historical data indicated 43 percent of BSI infections were in scope.
The team set a target for 2005 to achieve a 20 percent reduction from the baseline average of 6.33 CVC-related BSI cases per month, or 16 or less annually. Baseline measurement of variable cost and average length of stay was determined by comparing diagnosis-related groups (DRGs) for patients with confirmed central line-related BSI with a patient population of identical DRGs without a bloodstream infection. Based on this metric, variable cost was $16,699 more for patients with BSI, and length of stay was 20.6 days longer than the non-BSI population.
Analyze Phase
Statistical analysis found normal distribution of data for the overall BSI baseline rate with a p value of 0.308. The process was in control with no special cause variation and a sigma of 0. A SIPOC chart was developed to illustrate process flow, while a fishbone diagram helped to pinpoint the most important drivers or critical Xs, which included hand hygiene, maximal barrier precautions, skin prep, and an antimicrobial catheter. Figure 9.3 shows the SIPOC process.
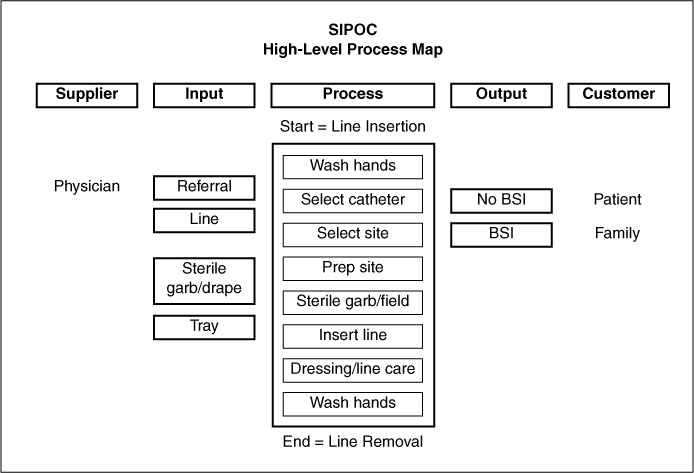
Figure 9.3. SIPOC process
Successfully implementing such a large-scale change effort requires a focus on gaining acceptance from others in the organization. The team used a stakeholder analysis to verify support from administration, the hospital’s infection control committee, infectious disease specialists, critical care intensivists, advanced registered nurse practitioners, and clinical nurse specialists.
Results from a Gage R&R assessment demonstrated 100 percent accuracy for repeatability and 90 percent accuracy for reproducibility for infection control surveillance by infection control practitioners. The audit accuracy is now incorporated for new employees and annually for all employees.
Measuring and Maintaining Results
To further improve processes and reduce the risk of BSIs, the team introduced a hand hygiene campaign, and completed a conversion to custom trays for CVC lines in November 2005. An employee poster contest increased acceptance and awareness. New SOPs for tray distribution were put in place and distributed to each campus, and additional error-proofing was accomplished by placing sterile barriers in all custom trays.
By June 2005, the team had achieved its goal to reduce the number of CVC-related BSI cases by 20 percent or 16 deaths annually, translating to the prevention of 2 deaths based on a baseline 13 percent mortality rate. Savings have been estimated at $318,029 for the first two quarters, using a per diem room cost. Internal analysis demonstrated an average of $16,699 additional variable costs per case, equating to a savings of $271,984. The Sigma score went from 0 to 1.8, and the overall BSI rate is well below the initial target and continues to improve. Monthly infection rates continue to be measured. Estimated savings are calculated monthly and year-to-date by the finance department, and reported to process owners.
This project was the subject of a poster at the Institute for Healthcare Improvement’s (IHI) National Forum in December 2005, and an article by Lois Yingling was published in the May/June 2006 issue of Patient Safety and Quality Healthcare (www.psqh.com). http://www.psqh.com/mayjun06/sixsigma.html
Preventing Infections at Decatur Memorial Hospital
Eliminating hospital-acquired infections is one of the top goals for the Six Sigma team at Decatur Memorial Hospital in Illinois, and the team has completed several projects focused on this critical quality issue. One such project targeted three key operational areas: intensive care, intermediate care, and the cardiovascular unit.
The project was successfully completed, and the hospital has been able to sustain improvements over time. Another successful project focused on the reduction of surgical site infections, specifically looking at all total joint replacements for hips or knees. Again, by analyzing the data and following the DMAIC (Define, Measure, Analyze, Improve, Control) process, they were able to make and maintain changes that have measurably improved patient care.
The hospital also launched a project to look at the administration of antibiotics. The CDC (Centers for Disease Control) recommends that for certain cases, antibiotics should be delivered prophylactically to the patient in order to reduce or eliminate the risk of infection. The focus is on the length of time between complete delivery of the antibiotic and the surgery or “cut time” on the patient. The CDC recommends this should be less than an hour, and early analysis by the Six Sigma team found that although averages were close, there were variability issues in consistently meeting the recommended guidelines.
Figure 9.4 illustrates the before-and-after results for a separate project that focused on improving the timeliness of antibiotic administration to pneumonia patients.
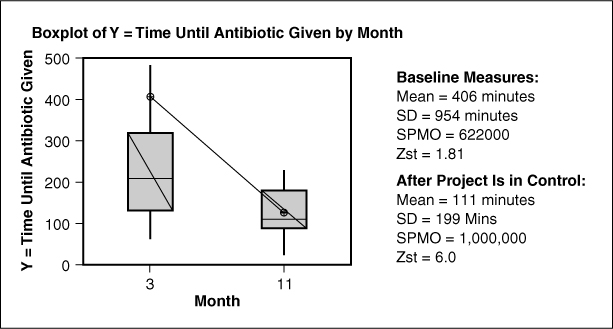
Figure 9.4. Antibiotic administration
Reducing the Incidence of Post-Operative Infections in Bowel Cases at Commonwealth Health Corporation
In August 2001, Commonwealth Health Corporation (CHC) began a Six Sigma project to assess the number of post-operative infections that occur in surgical bowel cases, seeking to identify key variables and ultimately reduce the rate of infections. CHC had noticed a higher than expected number of post-op infections in bowel cases, which negatively impacts patient days, cost, and morbidity.
The team set a goal to reduce the number of post-operative infections and related wound problems. The beginning Z score was 1.90, and a defect was defined as any post-operative infection or wound integrity problem occurring within 30 days of surgery. The Brown Belt who headed this project was an infection control practitioner. The hospital epidemiologist was the sponsor, and the project team also included an operating room (OR) scheduler, OR nurse, PACU nurse, outpatient nurse, and surgery clinical manager.
Statistical data analysis using Chi Square revealed three significant variables in such cases: use of Betadine on the post-operative wound, oxygen concentration administered post-operatively, and Hibiclens bath pre-operatively.
Based on the need to address the issues, specific recommendations were presented to general surgeons and anesthesiology:
• Hibiclens shower within 48 hours pre-op
• Dry sterile dressing or only Bactroban or Bacitracin ointment
• More than 40 percent oxygen in the OR
• More than 40 percent oxygen during the immediate two-hour post-operative period
The surgeons were essentially receptive to the recommendations, and anesthesiology was very willing to implement the suggested oxygen delivery.
With new procedures in place, the project team noted a statistically significant reduction in the number of post-op infections. By December 2002, the Z score had risen to 2.70, and the project had documented a 64 percent process improvement. The team also developed a control chart for monthly updating as part of ongoing infection control efforts.
Because bowel cases are part of ongoing infection control surveillance, the hospital will be alerted to any significant deviations over time. A control chart monitors this process and determines whether the improvements are maintained (see Figure 9.5). Immediate action will be taken if the process shows signs of going out of control.
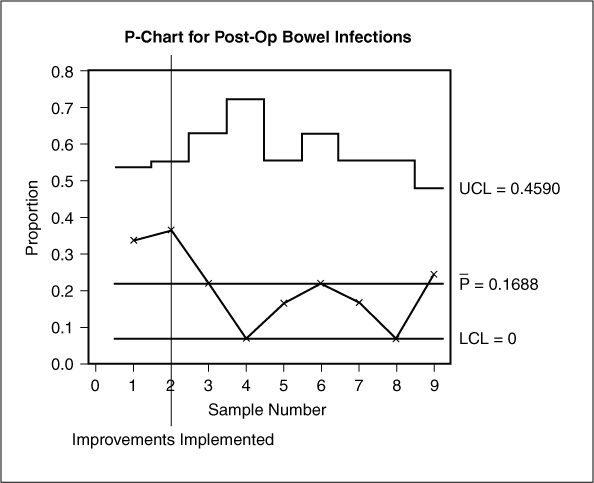
Figure 9.5. Post-op bowel infections
The cost analysis for this project involved research by the finance department into cost, charges, reimbursement, and insurance group for this set of patients. The spreadsheet analysis was broken out by patients who had developed an infection and those who did not. By calculating average cost, average charges, average reimbursement, and average profit for each set of patients, the financial impact per defect was set at $263.87 (20 defects for 6 months). Annualized project savings approved by the finance department are estimated at $6,755. Because all the infections identified during the study period were superficial, the financial impact was not significant. However, through time more serious and costly infections will be prevented. The increase in patient satisfaction is difficult to quantify, but there is significant benefit associated with satisfied customers.
The project continues to be monitored by the process owner. Any warning signs are reported to the infection control team for appropriate action as indicated. The process continues to improve at CHC, and in 2005 the bowel surgery infection rate was at its lowest point in five years.
Reducing Nosocomial Pressure Ulcers at Thibodaux Regional Medical Center
Since 2001, Thibodaux Regional Medical Center (TRMC) in Louisiana has applied Six Sigma and change management methods to a range of clinical and operational issues. One project that clearly aligned with the hospital’s strategic plan was an initiative to reduce nosocomial or hospital-acquired pressure ulcers, because this is one of the key performance metrics indicating quality of care. Although the pressure ulcer rate at TRMC was much better than the industry average, the Continuous Quality Improvement (CQI) data detected an increase between the last quarter of 2003 and the second quarter of 2004.
In October 2004, a Six Sigma project to address this issue was approved by the hospital’s senior executives. A team began to clarify the problem statement. Their vision was to be the “Skin Savers” by resolving issues leading to the development of nosocomial pressure ulcers. The project team included a Black Belt, enterostomal nurse, medical surgical RN, ICU RN, rehab RN, and RN educator.
Through the scoping process, the team determined that inpatients with a length of stay longer than 72 hours would be included, while pediatric patients would be excluded from the scope. The project Y was defined as the nosocomial rate of Stage 2, 3, and 4 pressure ulcers calculated per 1,000 patient days. Targets were established to eliminate nosocomial Stage 3 and Stage 4 pressure ulcers and reduce Stage 2 pressure ulcers from 4.0 to <1.6 skin breaks/1,000 patient days by the end of the second quarter of 2005.
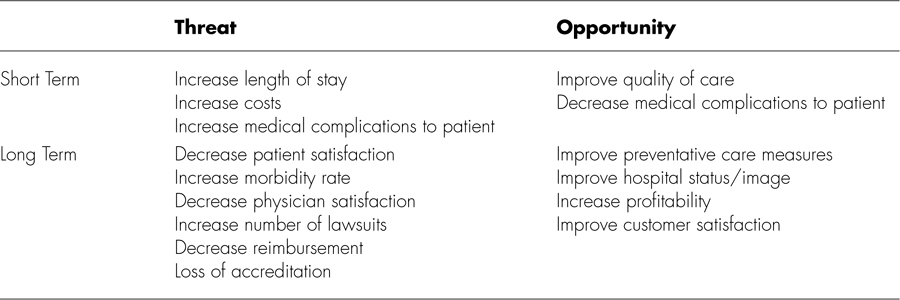
The team developed a Threat/Opportunity Matrix to help validate the need for change (see Table 9.4). They encountered some initial resistance from staff, but were able to build acceptance as the project began to unfold.
Table 9.4. Threat/Opportunity Matrix
During the Measure phase, the team detailed the current process, including inputs and outputs. Using cause and effect tools, process steps having the greatest impact on the customer were identified as opportunities for improvement. The team also reviewed historical data and determined that overall process capability was acceptable, but that the sub-processes had a great deal of room for improvement. Improving these sub-processes would positively impact the overall process and further improve quality of care.
Measurement system analysis on the interpretation of the Braden Scale was performed to verify that results obtained by staff RNs were consistent with the results obtained by the enterostomal therapy registered nurse (ETRN), because this is the tool used to identify patients at risk of developing a pressure ulcer. This analysis indicated that the current process of individual interpretation was unreliable and would need to be standardized and re-evaluated during the course of the project.
A cause and effect matrix was constructed to rate the outputs of the process based on customer priorities and to rate the effect of the inputs on each output (see Figure 9.6). The matrix identified areas in the process which have the most effect on the overall outcome, and consequently the areas which need to be focused on for improvement (see Table 9.5).
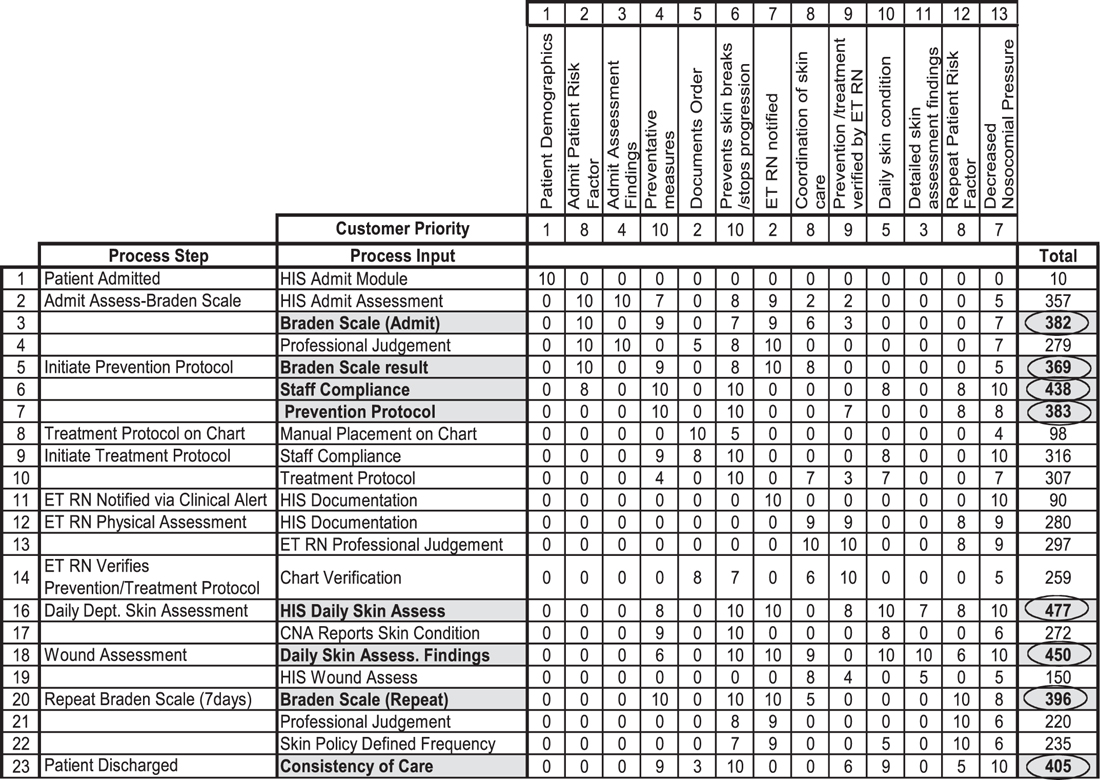
Figure 9.6. Cause and effect matrix
The team identified several critical Xs affecting the process:
• Frequency of Braden Scale. Braden Scale is an assessment tool used to identify patients at risk of developing pressure ulcers. Policy dictates how frequently this assessment is performed.
• Heel protectors in use. Heel protectors are one of the basic preventative treatment measures taken to prevent pressure ulcers.
• Incontinence protocol followed. Protocol must be followed to prevent against constant moisture on the patient’s skin that can lead to a pressure ulcer.
• Proper bed. Special beds to relieve pressure on various parts of the body are used for high-risk patients as a preventative measure.
• Q2H turning. Rotating the patient’s body position every two hours is done to prevent development of pressure ulcers.
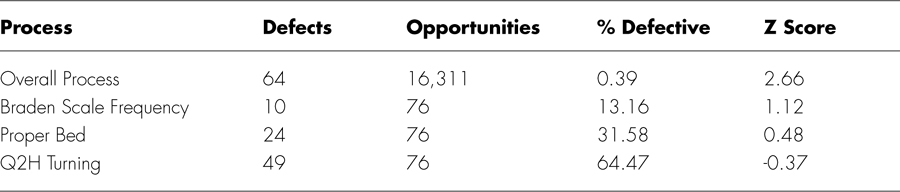
Data analysis revealed that the bed type was not a critical factor in our process, but the use of heel protectors, incontinence protocol compliance, and Q2H turning were critical to the process of preventing nosocomial pressure ulcers. The impact of the Braden Scale frequency of performance was not identified until further analysis was performed (see Figure 9.7).
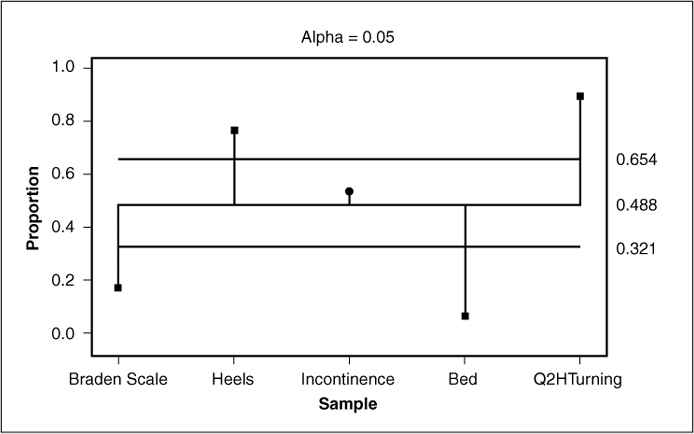
Figure 9.7. One-way analysis of means for sub-process defects
Evaluating data specific to at-risk patients, the team separated populations who developed nosocomial pressure ulcers from those who did not have skin breakdowns. The Braden Scale result at the time of inpatient admission from each population was analyzed to see the affect on development of a nosocomial pressure ulcer. One unexpected finding was that the admit Braden Scale result was higher for patients who develop nosocomial pressure ulcers than for those who do not develop them, showing that patients at risk are not being identified in a timely manner, thus delaying the initiation of necessary preventative measures.
The team then looked at defects for Braden Scale frequency of performance for each population of patients using Chi Square. They found the frequency of Braden Scale performance did have an effect on the development of nosocomial pressure ulcers. This was confirmed with Binary Logistic Regression (see Table 9.6).
Table 9.6. Binary Logistic Regression
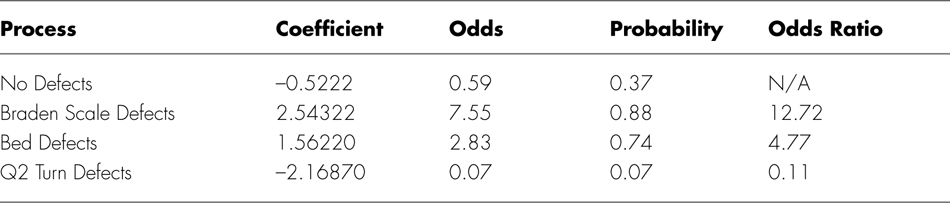
The most significant “X” is the Braden Scale frequency of performance. This analysis confirmed the need to increase the frequency of Braden Scale performance to identify at-risk patients.
During the Improve phase, recommended changes were identified for each cause of failure on the FMEA with a RPN score of greater than 200. Some of them include the following:
• Increase frequency of Braden Scale performance to every five days
• Braden Scale assessment in hospital information system (HIS) to include descriptions for each response
• Global competency test on interpretation of Braden Scale to be repeated annually
• Add “prompts” in HIS to initiate prevention/treatment protocols
• ET Accountability Tracking Tool issued for non-compliance with prevention and treatment protocols as needed
The Braden Scale R&R was repeated after improvements were made on the interpretation of results. The data revealed an exact match between RNs and the ETRN 40 percent of the time and RNs were within the acceptable limits (+/–2) 80 percent of the time. Standard deviation was 1.9, placing the results within the specification limits. The data indicated that the RNs tend to interpret results slightly lower than the ET RN, which is a better side to err on because lower Braden Scale results identify patients at risk of developing pressure ulcers.
Another round of data collection began during the Control phase to demonstrate the impact of the improvements that had been implemented. A formal control plan was developed to ensure that improvements would be sustained over time, and the project was turned over to the process owner with follow-up issues documented in the Project Transition Action Plan.
The team implemented multiple improvements, including compilation of a document concerning “Expectations for Skin Assessment” with input from nursing and staff. They also gave a global competency test on interpretation of Braden Scale which will be repeated annually. The Braden Scale frequency was increased to five days, and they corrected the HIS calculation to trigger clinical alerts for repeat Braden Scale. Prompts were added for initiating Braden Scale, and monthly chart audits were developed for documentation of Q2H turning. A turning schedule was posted in patient rooms to identify need and document results of Q2 turning of patient. Additional solutions included the following
• ET RN attends RN orientation to discuss skin issues
• Revise treatment protocol to be more detailed
• Re-organize wound care products on units
• Unit educators to address skin issues during annual competency testing
• CNA and RN report at shift change to identify patients with skin issues
• Task list for CNAs
• ET Accountability Tracking Tool issued for non-compliance with prevention and treatment protocols as needed
Results and Recognition
Since this was a quality-focused project, the benefits are measured in cost avoidance and an overall improved quality of care. A 60 percent reduction in the overall nosocomial pressure ulcer rate resulted in an annual cost avoidance of approximately $300,000.
To make sure their initiatives are producing a positive impact on the patient care environment, the hospital continuously measures patient and employee satisfaction through Press Ganey. Inpatient satisfaction is consistently ranked in the 99th percentile and employee satisfaction in the 97th percentile. TRMC has also received recognition in the industry for their achievements, including the Louisiana Performance Excellence Award for Quality Leadership (Baldrige criteria: http://www.quality.nist.gov/) Studer Firestarter Award, and Press Ganey Excellence Award.
“This project is a perfect example of the need to verify underlying causes using valid data, rather than trusting your instincts alone,” says Sheri Eschete, Black Belt and leader of the pressure ulcer project at TRMC. “Six Sigma provided us with the tools to get to the real problem so that we could make the right improvements. There had been a perception that not turning the patients often enough was the issue, but the data revealed that it was really the frequency of the Braden Scale. Leveraging the data helped us to convince others and implement appropriate changes.”
The nosocomial pressure ulcer rate is monitored monthly as one of the patient-focused outcome indicators of quality care. The results are maintained on the performance improvement dashboard (see Figures 9.8 and 9.9).
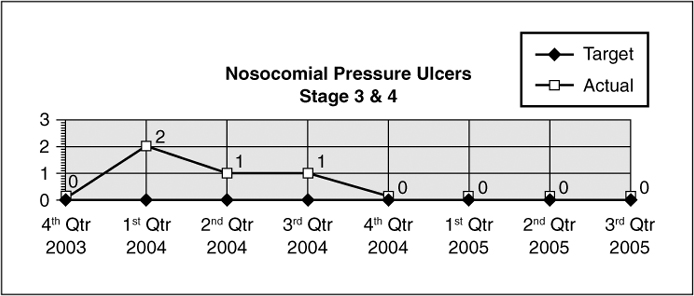
Figure 9.8. Stage 3 and 4 nosocomial ulcers
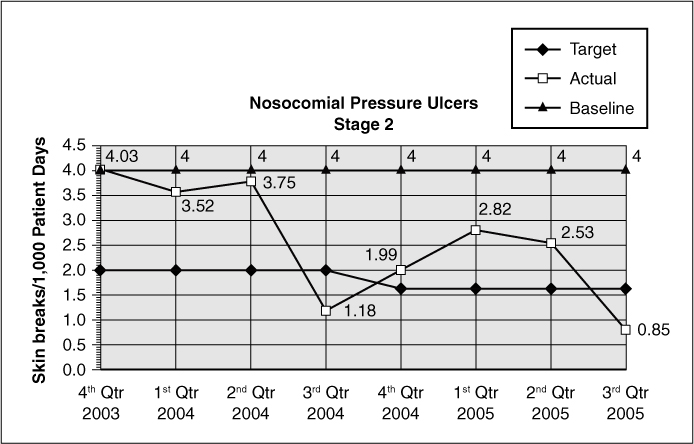
Figure 9.9. Stage 2 nosocomial ulcer
Glucose Control in the Adult ICU at Valley Baptist Health System
Ensuring effective glucose control for patients within an intensive care unit (ICU) has been shown to decrease morbidity and mortality rates. Studies supporting the role of glycemic control have used continuous infusion of insulin and glucose. With this protocol, glucose should be monitored frequently after initiation of the protocol (every 30 to 60 minutes) and on a regular basis (every 4 hours) once the blood glucose concentration has stabilized. At Valley Baptist Health System in Texas, a Six Sigma project completed in 2006 focused on controlling blood glucose levels in all critically ill patients, regardless of diagnosis, within 85mg/dl and 125mg/dl.
At the outset, data indicated the adult ICUs lacked a standardized process to manage glucose levels, with 31 percent of patients admitted to ICUs from June to August 2005 not receiving a glucose level measurement (see Figure 9.10). Of those measured, 70 percent were outside the recommended parameters of evidence-based medicine (85mg/dl to 125mg/dl).
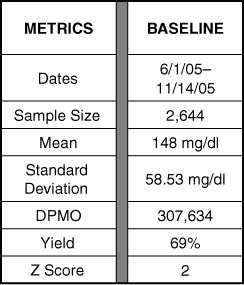
Figure 9.10. ICU glucose levels
The hospital felt that the potential benefits of this initiative would include improving patient care and outcomes, decreasing ICU length of stay, increasing ICU bed availability, reducing ICU cost, and increasing ICU revenue. To obtain Voice of the Customer (VOC), the team relied upon a combination of sources, including evidence-based medicine indicating appropriate guidelines, 32 surveys completed by physicians, and 41 surveys completed by the nurses.
The team determined that the Y for this project would be glucose levels of all adult patients admitted to MICU and NICU, glucose levels at the time of admission, glucose levels after 24 hours of admission if initial glucose is greater than 175mg/dl or after 24 hours if glucose level becomes clinically elevated at more than 175mg/dl.
Project specifications included the following:
• Target: 85mg/dl to 125mg/dl
• USL: 175mg/dl
• LSL: 80mg/dl
• Defect: Any glucose reading more than 175mg/dl or less than 80mg/dl
Based on the data analysis, the team decided to pursue several changes, including limiting the protocol selection to one, providing physician education, obtaining key stakeholder support, conducting one-on-one education for nurses, and obtaining additional glucometers and docking stations for NICU and MICU. They also relied upon evidence-based medicine research to develop and standardize glucose management protocol that would include
• Admission glucose and potassium levels
• 1,800-calorie ADA diet
• Endocrinologist consult
• Standardized glucose targets
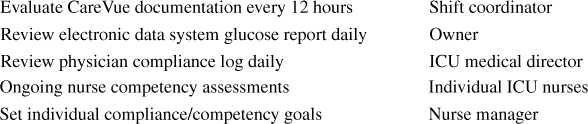
Going forward, here are some of the roles and responsibilities that have been assigned to ensure project results will be maintained:
From Baseline to Pilot, the process showed a statistically significant improvement (see Figure 9.11). Using Mood’s Median, the team determined that the factors that were significant in terms of driving process variation were glucose IV, diet, and protocol.
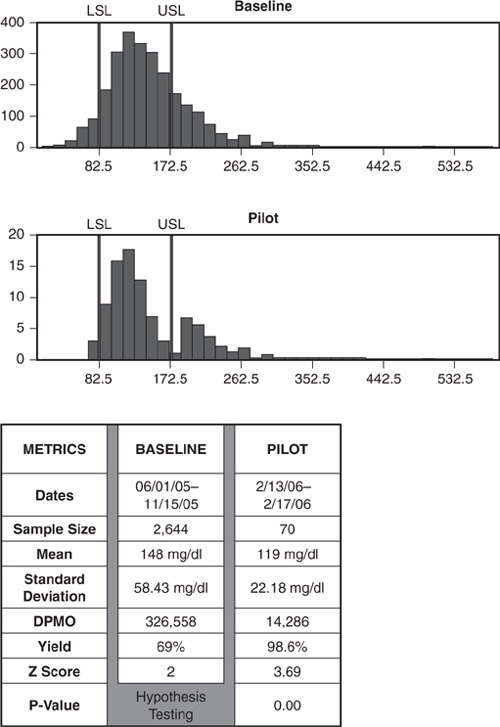
Figure 9.11. ICU glucose baseline to pilot
A variety of control mechanisms were put in place and accountability assigned to ensure that the results of the project could be maintained over time. These included regular physician meetings, posting flyers in ICU for physicians and nursing staff, adding Glucometers and docking stations, creating a data order set and report for protocol implementation, reviewing reports on a daily basis to ensure compliance, and reviewing glucose levels every 12 hours.
Figures 9.12 and 9.13 illustrate the project measurements and percent improvement as of the Control phase.
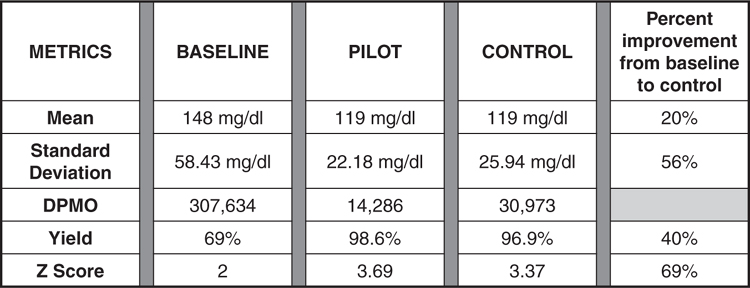
Figure 9.12. ICU glucose baseline to pilot controlled
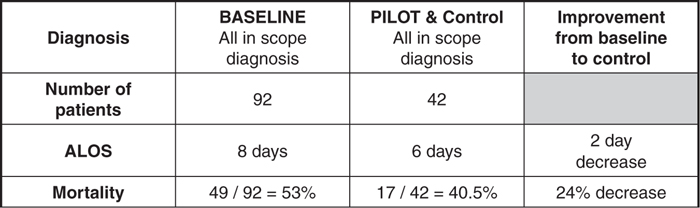
Figure 9.13. ICU glucose baseline to control results