Chapter 12. Lean Six Sigma in Healthcare
Six Sigma in healthcare is becoming a prerequisite for improving quality. Inattention to efficiency in healthcare, however, has led to built-in procedural wastes in the system that must also be addressed. Lean principles have been used successfully in manufacturing, services, and even healthcare facilities successfully. While Six Sigma helps healthcare organizations pay attention to errors and reduce risks associated with patient safety, a combination of Lean with Six Sigma helps organizations to streamline operations and achieve better patient satisfaction.
One of the simplest and most common examples to illustrate the benefits of Lean in a private practice or a healthcare facility is patient waiting time. Many times patients feel they get sicker while waiting for their time with the physician. Here the issue may be to streamline and synchronize processes rather than reduce the error rate. In case of emergency or intensive care facilities, streamlining operations will allow health professionals to attend to more patients and—depending on underlying issues—may not require the rigor of Six Sigma to reduce errors. Thus, using the appropriate approach to improve either effectiveness or efficiency will provide maximum improvement in achieving overall healthcare excellence.
Lean thinking was being practiced in manufacturing in the 1980s in the U.S. and Japan. Lean principles were first deployed by Ford while standardizing parts production and assembly operations. In the U.S., Lean used to be called JIT, or Just-In-Time (JIT) manufacturing, which was implemented successfully in parts distribution by delivering customer-ordered parts when needed and where needed. However, implementing Lean in manufacturing operations impacts the entire supply chain, which makes it difficult to achieve “‘ideal” results. When implementing JIT principles, the focus shifted from producing to a forecast to producing to the customer order. This thinking was also called Pull system (build to order) versus the Push system (forecast). One can see that in healthcare operations (because of the nature of the business), the Pull system makes more sense, rather than planning to “push” a certain number of patients through the healthcare system. The old system focuses on its internal strategy and objectives before looking at the customer versus the new system that focuses on the customer in order to achieve its strategy and objectives.
One of the challenges people in the healthcare industry face is to adapt the same techniques that have been successful in the manufacturing industry. Of course, the same argument can be made for Six Sigma implementation as well. Instead of being a challenge, it must be viewed as an opportunity to expand use of the known and mastered tools to a new industry. Yes, there are differences at the surface between healthcare and other industries at both the input and the output level. As an activity, however, there may be many similarities; but at the process framework level there are a few differences. The 4-P model of process management illustrated in Figure 12.1 shows that each process includes some things to do to “prepare,” which include getting supplies, tools, patients, and skilled employees. The “perform” level includes activities at surgery or physical examination stations. For either of these processes, there is an expected outcome. In other words, the eventual outcome is a “healthy” patient. If the patient is not healthy, the physician prescribes remedies to help. Similar analysis can be performed in clinical, administrative, and executive processes. Interestingly, healthcare operations today are managed like a business, where there is a CEO and CFO similar to any manufacturing business. Thus, we must see any function in a healthcare facility as a process, which helps us appreciate the value of various known Lean or Six Sigma tools.
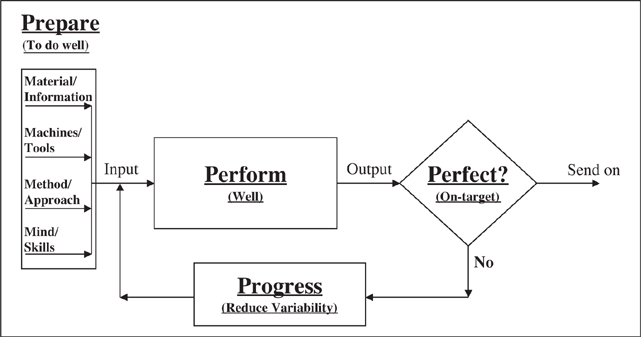
Figure 12.1. 4-Ps of process management (Gupta. Quality Progress, July 2007)
The Lean Process
Quality improvement begins with housekeeping, given the house is there and rooms are habitable. Similarly, Lean begins with a concept of identifying activities necessary to add value to the intended outcome, be it patient safety or the patient examination. Then one makes sure that these value-added activities are performed efficiently and effectively. To ensure efficiency of an activity, the concept of Lean thinking looks into establishing controls at the input level to minimize waste. Once the waste is removed, the flow is built in to the activity so the rhythm is synchronized with the expected outcome to minimize excessive activities. Establishing the rhythm requires balancing demand and supply. To manage demand, customer needs are understood better, and to manage supply, JIT deliveries are expected. Typically, demand is difficult to control, and supply can be mandated at some extra cost. However, benefits outweigh the cost. Thus, supply and demand are balanced to some practical level, and sustained. Various tools are used to map, streamline, improve, balance, and sustain the Lean principle in order to have a shortest, straightest, and simplest flow of information, material, or patients.
Lean Six Sigma
Having leaned the process, performance may still be unacceptable due to poor design and execution, which leads to inconsistencies. Lean can cause waste with an erroneous process design; however, poor product design or execution can cost lives. Thus, Six Sigma typically is used to reduce the error rate and process variability, and Lean is used to reduce the waste or nonvalue-added activities. The two goals are interrelated, however—excessive waste can lead to a high error rate, and a high error rate can lead to excessive waste. Thus, applying Lean and Six Sigma principles concurrently may assist in addressing both the error rate and waste in the system.
Lean principles have helped organizations improve in terms of cycle time (~50%), work in process inventory (~50%), productivity, lead time (~50%), throughput, and space requirements (~30%). Regardless of the size of an organization, significant and unprecedented gains and improvements are typical to any successful Lean initiative. According to the report “Going Lean in Healthcare” published by the Institute of Healthcare Improvement, 175 Lean projects at Virginia Mason Medical Center have resulted in the following significant improvements:1
• 53% reduced inventory
• 36% improved productivity rate
• 41% reduced floor space
• 65% reduced lead time
• 44% reduced people effort
• 72% reduced distance traveled by product
• 82% decrease in set-up time
One can see that applying Lean helped the healthcare organization reduce waste. Two key Lean tools that result in immediate savings and improvement are Value Stream Mapping and 5S’s. Value Stream Mapping helps identify waste in the system. The 5S’s stand for the following:
• Sort to keep the unnecessary out
• Simplify to organize the necessary with clearly marked visuals
• Sweep to clean the area or remove the clutter
• Standardize best practices
• Sustain by continually redefining the new status quo
The 5S’s are directed at value-generating processes to achieve the desired performance. According to a project completed at the Nebraska Medical Center,2 by applying Value Stream Mapping and the 5S’s they were able to reduce 20 minutes inpatient “time to bed after bed assignment” and realized a savings of more than $300,000.
Principles of Lean Thinking
The currently known “Lean” principles have been attributed significantly to the Toyota Production System (TPS), which is a system to do “right” things in the “right” way to minimize waste. Employees play a critical role in implementing Lean principles, which gives peace of mind to workers in knowing that the outcome of Lean does not mean automatic layoffs. Instead, it means redeployment of excess capacity to support growth, improvement, and housekeeping. This implies that any Lean initiative must be supported by concurrent sales activities. Lean is meant to be implemented in growing times rather than in times of cost-cutting. Lean is an improvement tool, not a cost-cutting tool. One of the troubling issues with current implementations is that in some instances Lean’s success is measured in terms of headcount reduction, or right-sizing. As a result, expected job loss leads to change resistance, and thus marginal performance of Lean initiatives.
Lean is intended to be a waste-free operation irrespective of being a manufacturing or service operation. Waste-free production means producing what is needed, when it is needed, and at a specific rate of production in response to the customer demand, rather than using maximum capacity to build to a hypothetical forecast. Thus, one of the objectives of Lean implementation is to design a system that can be in rhythm with the customer demand or patient traffic. Rhythm implies minimal wait time in medical facilities through design of operations considering available resources and known constraints. Lean minimizes changes, abnormalities, or fluctuations in the flow of material or patients; it also minimizes the use of wrong tools or equipment, ensures visibility of operations and deviations, immediately remedies unacceptable activities or outcomes, and emphasizes planned and leveled workload.
Lean, when combined with Six Sigma, overcomes disruptions during implementation and speeds up the Six Sigma implementation. An ideal and sustainable implementation of Lean on its own is impossible, similar to achieving the ideal Six Sigma level performance for a healthcare facility. The practical combination of Lean and Six Sigma leads to significant reduction in material waste, streamlines process, and reduces errors to virtual perfection.
Table 12.1 highlights differences between Lean and Six Sigma in order to exploit their combination. For example, Lean normally starts in an area headed by the area manager, whereas Six Sigma is normally launched with an organization-wise commitment. While implementing Lean Six Sigma, one could decide to involve the organization by committing to Lean Six Sigma throughout for minimizing resistance and practicing Lean Six Sigma locally for ease of control. At a personal level, Lean requires a commitment to challenge the current system, while Six Sigma requires commitment to strive toward perfection.
Table 12.1. Lean and Six Sigma Differences
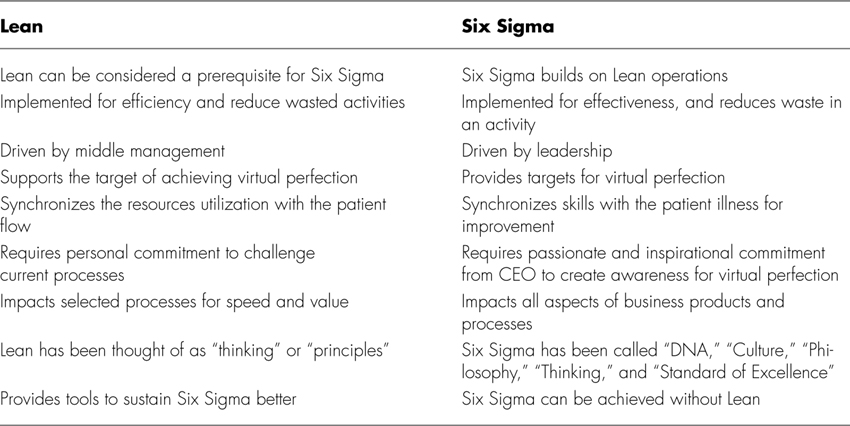
Table 12.2 lists several aspects of thinking for Lean and Six Sigma. For example, the management thinking for Lean implies speed and flow, while for Six Sigma it’s quality and time. If we combine Lean and Six Sigma, one can think in terms of quality and flow, which will minimize time and speed up the process. In the case of a patient visiting a medical facility, it becomes important that the patient receives due attention at the earliest possibility in a predetermined flow. Due to flow, if there is a known waiting time, the patient can plan for the waiting time and not be disturbed. If one were implementing Lean alone, the solution could lead to very fast process in a flow, but a dissatisfied patient due to lack of attention from a physician. If one were implementing Six Sigma alone, the patient will have a great visit, but the medical facility may not be able to keep up with a required number of patients in order to be a financially viable organization.
Table 12.2. Six Sigma and Lean Organization Thinking
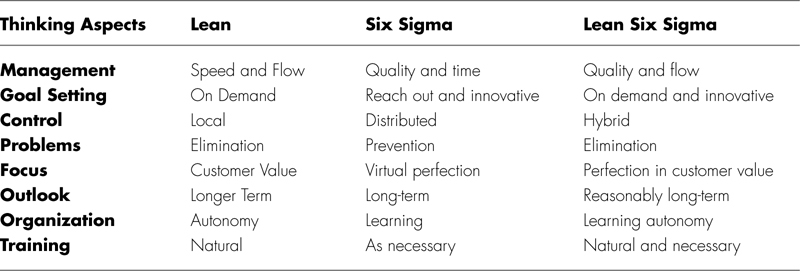
Similarly, Table 12.2 looks into goal-setting, control, problems, focus, outlook, organization, and training aspects of Lean and Six Sigma. The Lean Six Sigma combines strengths of both Lean and Six Sigma to maximize value of the improvement effort.
Lean Tools
Similar to Six Sigma, Lean uses several tools, but not as many as Six Sigma methodology. The list of Lean tools include
• Value Stream Mapping (VSM)
• Cycle Muda (waste)
• TAKT (time allowed per unit by demand) time
• 5S (sort, simplify, sweep, standardize, sustain)
• Kaizen
• Visual Manufacturing
• Kanban
• TPM
VSM is a process of mapping operations in an area, and evaluating each operation for its value contribution to the end product and impact on quality. If the process does not add value, it is considered a total waste and a good candidate for elimination. If a process step adds value, it is evaluated for waste elimination. Once non-value-added steps are identified and addressed, the new future state process map is designed to create maximum value with minimum waste. The objective with VSM is to come up with the shortest, streamlined, and shallowest (without any bureaucratic practices to accumulate outcomes) process flow. Figure 12.2 outlines steps to perform VSM. While evaluating VSM, a total cycle time is determined based on its components. There are five components of cycle time: Wait Time, Move Time, Queue Time, Run Time, and Inspection Time. Normally, if a process is performed well, only the runtime is considered to be value-added, and it is about 5 to 10 percent of the total cycle time. In other words, about 90 percent of the cycle time is wasted. If a patient only spends five minutes with the physician, and it takes him about three hours for the visit, there is a significant waste of the customer’s valuable time. The three hours starts from the time patient arrives in the medical facility and ends at the time the patient leaves the facility. (Some may include the time the patient leaves his home to the time the patient returns.)
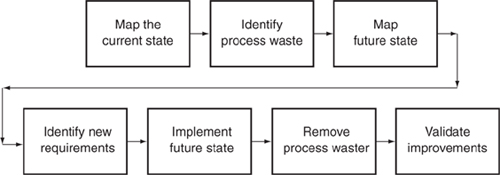
Figure 12.2. Value Stream Map
Muda is a term of waste in operations. There are seven wastes:
• Overproduction. Having excess capacity or extra services to take care of patients
• Inventory. Having too many supplies in the facility
• Extra processing steps. Scheduling too many tests
• Motion. Actual patient move time, and how many yards patient has to walk around to get to the physician
• Defects. Errors, mistakes, wrong prescriptions, overlooked tests, or a scissors left inside the patient after completing the surgery
• Waiting. The time patient waits for receiving services
• Transportation. How long it takes the patient to get to and from the facility
One can identify right away his or her own experience with a variety of these wastes while using or perhaps providing healthcare services.
TAKT is the time available for each patient. For example, if a physician normally examines 60 patients in a day in an eight-hour shift, the physician has about eight minutes per patient (8 hours × 60 minutes / 60 patients = 8 minutes). In other words, the objective ideally becomes to synchronize various processes and activities such that physician can see a patient well within 8 minutes. In this case, the physician has been considered the most critical resource, or the bottleneck operation. In the case of a surgeon, TAKT time will be equal to the time available for each surgery to meet the customer demand.
When the operation is streamlined, waste is eliminated, TAKT is determined, and the 5S and visual factory concepts are applied. In the case of 5S, the goal is to declutter and organize the area, and make it user-friendly to minimize opportunities for error by not wasting time looking for things. The visual factory concepts address the issue of making your tools and information visible and easily available to ensure realization of intended results in a planned time—in other words, making the right tool at the right place at the right time available for use.
Having streamlined the operations and minimized the waste, it is time to create the necessary rhythm. In order to create the rhythm, the first thing is to ensure that supplies are maintained at the required level. TAKT time allows the planning to schedule such that a certain level of inventory is maintained. Interestingly, healthcare facilities already have a “batch” size of one, thus managing inventory to deal with one patient at a time should lead to minimal inventory of supplies. The system to maintain desired inventory of supplies is called Kanban. A stocking method can standardize quantities with a card attached to each item. The card identifies the necessary quantity to maintain, and initiates a trigger for replenishing the supply once consumed to a predetermined level. Kanban simply implies a “card” system consisting of visual and physical inventory management rather than a complex computer-based inventory management system that accumulates excessive inventory, thus causing waste. TPM brings maintenance into focus as a necessary and vitally important part of the business.
One can see that while implementing Lean across an organization, collaboration may be required from the entire supply chain. This requirement leads many organizations to benefit from its local and limited implementation, which normally is confined to using the VSM and 5S methods to organize the workplace.
Table 12.3 shows how various Lean tools can be accommodated in the DMAIC methodology to maximize benefits of the combined approach.
Table 12.3. Integrating Six Sigma and Lean
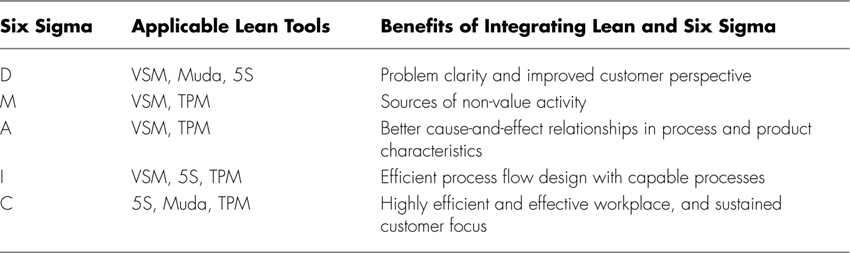
Gupta. Six Sigma Performance Handbook, 2004.
The following sections are case studies that demonstrate the use of various Lean and Six Sigma tools concurrently, or in an integrated approach.
Case Study 1: Combining Lean and Six Sigma to Improve Throughput in the Emergency Department at St. John Health
Located in southeast Michigan, St. John Health (SJH) provides extensive services through a system comprised of 9 hospitals and more than 125 medical facilities. Its vision is to “provide the highest quality patient care experience each time, every time (www.stjohn.org).
Initiatives such as Six Sigma and Lean help to support this vision by providing a structured approach to performance improvement. Initially, 14 people were trained as Six Sigma Black Belts, and 12 are currently serving in this role. St. John Health has completed 43 DMAIC projects, increasingly incorporating elements of Lean for rapid improvement. More than 35 Kaizens have been completed across SJH since December 2005. The process and measurement skills acquired through Six Sigma at St. John Health have been instrumental in effectively adapting Lean techniques.
Some of the Lean Six Sigma successes at St. John Health include
• SJHMC reduced time it takes to deliver CT/radiology results to ED clinicians by an average of 50 percent.
• Daily rounds are improving service to patients in progressive care at SJHMC—the average LOS has decreased by 30 percent.
• Moving patients efficiently to the right bed the first time creates better patient experiences and better work environment for staff. Turnaround times have improved by 88 percent.
• St. John-Providence ED patients are spending less time waiting for an inpatient bed—wait time has decreased by 50 percent.
• Visual cues are helping to better manage patients in observation status at St. John-Providence—the average LOS has decreased by 31 percent.
• Hours from St. John-Providence ED arrival to inpatient bed maintained the same from 1st Qtr FY’06 to 1st Qtr FY’07, while ED visits have increased by 1.4 percent.
• While Press Ganey patient satisfaction scores increased from a top box of 52.5 percent to 58.9 percent, hours from triage to discharge decreased 9.7 percent.
“The use of Six Sigma and Lean tools is becoming the way we work across St. John Health,” says Todd Sperl. “With a disciplined approach, we are also beginning to see the long-term, sustained improvements that will help us to consistently provide the highest quality patient care experience in all we do.”
Six Sigma Organization at St. John Health
Six Sigma and Lean are part of St. John’s Operational Excellence initiative launched in the Fall of 2003, which represents a systematic approach to process and quality improvement (see Figure 12.3) There is an innovative and steadily improving infrastructure in place to provide leadership, ensure accountability, prioritize projects, manage the selection and training of participants, and measure and monitor results. For 2006, the initiative had a positive financial impact of $8.5 million on the fiscal year budget.
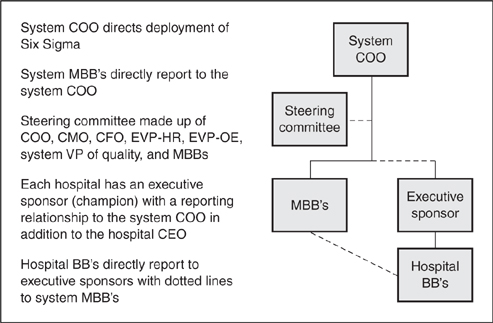
Figure 12.3. Six Sigma organization at St. John’s
“As we have gained experience using Six Sigma, Lean, and change management, the team has become more comfortable picking up the right tool at the right time,” says Todd Sperl, Master Black Belt with St. John Health. “I absolutely see the value to having a full toolkit. Some hospitals are only using Lean, but we think that’s a dangerous route. Without a built-in control phase, the success rates can suffer. St. John has a 100 percent success rate because Black Belts are able to ensure the project is on track and determine statistical considerations, such as the existence of special cause variation and so on.”
According to Sperl, St. John’s goals are to link to the organization’s strategic initiatives, identify value streams and waste, and then structure and rank opportunities for rapid improvement. One of the initiatives successfully completed by the team at St. John Health-Providence Hospital was a project to improve patient throughput in the emergency department, which required the use of Lean to support the Six Sigma process.
As the project began, the wait time for a patient to see a physician in the hospital’s emergency department could range from 11 minutes to 4 hours. With more than 60,000 patients visiting the Providence ED on an annual basis, the variability and delays represented a significant opportunity for improvement.
Gathering the voice of the customer (VOC) led the hospital’s Lean Six Sigma team to set the Upper Specification Limit at 60 minutes for patients to be seen in the ED. The hospital also had a goal to reduce the LWBS rate (patients leaving without being seen) from 2.4 percent to below 1 percent. The existing process averaged 64 minutes, but with a 39-minute standard deviation, and only 67 percent of the patients were actually seen within the 60-minute specification limit. The team initially set a goal to increase the number of patients seen within 60 minutes to 80 percent.
Findings from the Analyze Phase
Analysis indicated that issues such as bed availability, higher census, and the need for x-rays all contributed to longer waiting times for patients. Furthermore, lower acuity patients treated in express care also waited longer to see a physician—making the term “express” somewhat of a misnomer. Using historical Design of Experiments (DOE), the team verified that 94 percent of the variation in waiting to see a physician was driven by bed availability, radiology, and express care (see Figure 12.4).
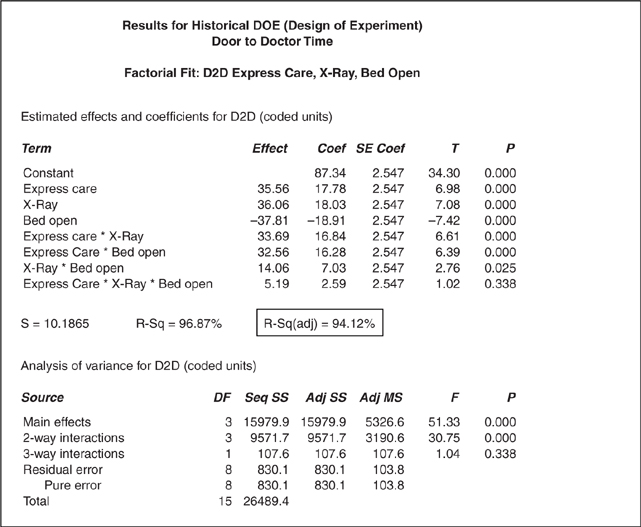
Figure 12.4. Results for historical DOE door-to-doctor time factorial fit: D2D express care, x-ray, bed open
Solutions Emerge
With participation from key stakeholders, the team held a Work-Out to address radiology turnaround time for emergency patients. Through this process, they quickly developed and implemented staffing adjustments and other solutions.
Use of the Priority/Payoff Matrix demonstrated that focusing on express care presented the greatest potential for change with the least amount of difficulty. Because it was under the control of the ED leadership, the lion’s share of improvement for this initial project would come from this area. Data analysis showed that it took nearly twice as long to see a physician in express care as it did in the balance of the department.
Lean became the method of choice in this area. Data collection had already helped to identify problems with flow during the Six Sigma project, so the team met for four hours in a mini-Kaizen (instead of the typical weeklong event) to work through the issues.
According to Sperl, combining methods and learning when and where to use various tools has been very beneficial for the team. “We discovered that the appropriate use of Lean and Six Sigma helps us to achieve greater efficiency within a shorter amount of time,” he says.
The VSM shown in Figure 12.5 illustrates various “flows” or traffic patterns within the ED. Various bottlenecks have been flagged to help the team analyze the current situation and identify any potential opportunities to streamline the department using Lean techniques.
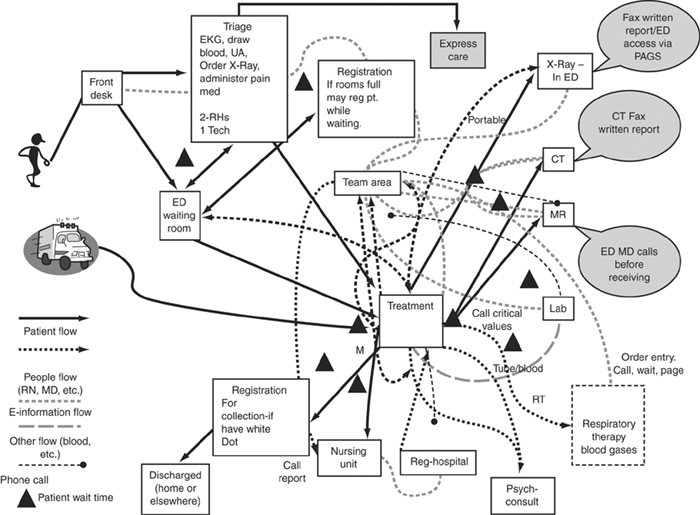
Figure 12.5. Emergency department spaghetti diagram
One of the Lean techniques used was 5S Red Tag (Sort, Standardize, Simplify, Sweep, Sustain) to identify and eliminate waste throughout the express care area of the ED. The team physically walked the process of moving from quick registration to express care, and rapidly moved supplies and workstations (where possible) to facilitate the flow of the patient. Red tags were used for those changes that could not be immediately addressed, and the changes were accomplished within 24 hours.
Uncovering the use of antiquated fax machines in express care helped to identify a barrier in communication. As so often happens in healthcare, the hospital staff had been unaware that a problem existed because they had developed workarounds to the issue.
Ben Miles, St. John Health Black Belt on this project, noted the benefit of using Lean to quickly uncover and address factors that might be involved. “The mini-Kaizen helped our staff to recognize the delays and customer satisfaction challenges caused by these everyday problems and empower them to make changes,” he says.
By leveraging both Six Sigma and Lean methods within the ED, the team was able to realize the following accomplishments (see Figures 12.6 and 12.7):
• Mean reduced by 25 minutes (38 percent)
• Standard deviation reduced by 17 minutes (38 percent)
• Range reduced by 46 percent
• Z-score improved by 0.44 Sigma
• DPMO reduced by 158,333
• Flow improved with elimination of non-value-added process steps
• Standards created to sustain change
• Financial impact equaled more than $1.2 million
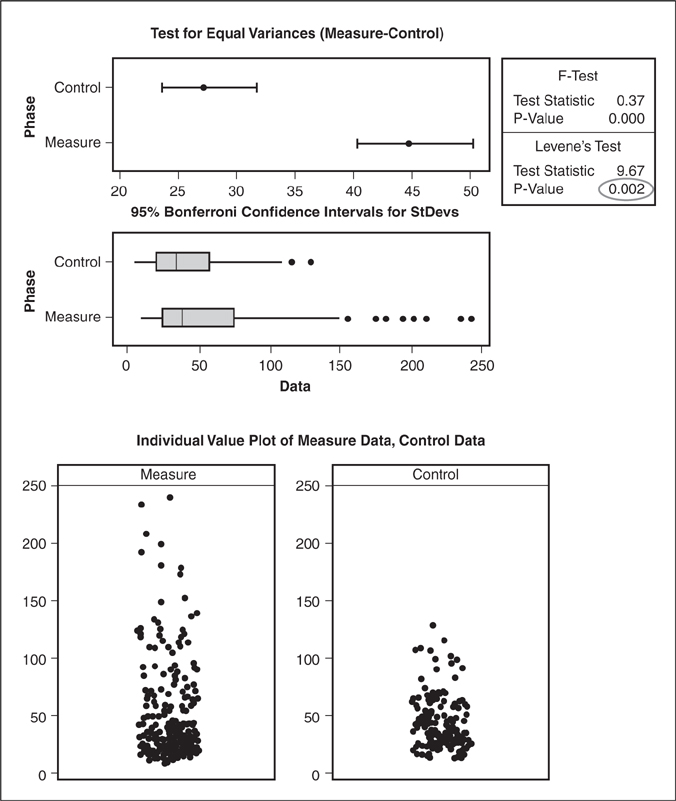
Figure 12.6. Statistical results
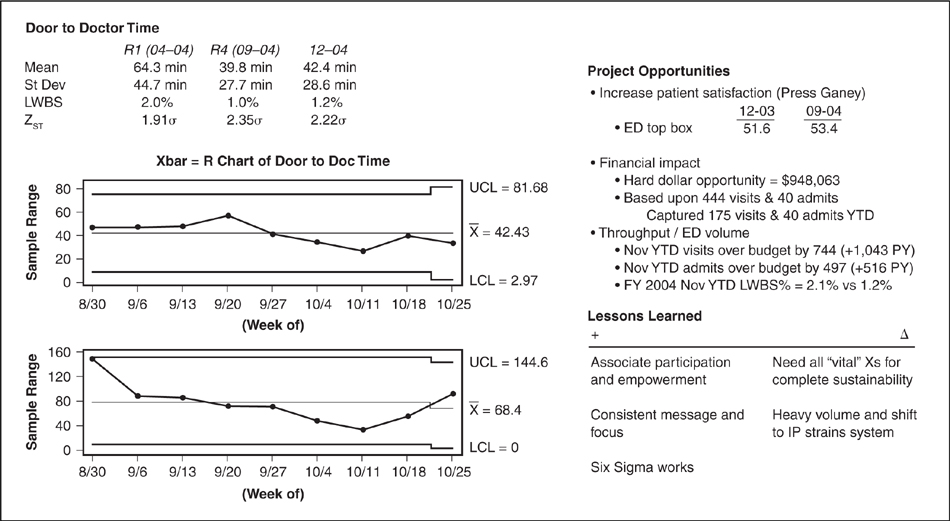
Figure 12.7. Results
“The change has been profound on my initial contact with the patient,” says Dr. Steven McGraw, ED physician. “Instead of apologizing for the delay in greeting a patient and defusing his/her frustrations, I can now more readily move ahead with treatment.”
The Operational Excellence Team at St. John Health includes:
• James Tucci, MD, Chief Medical Officer
• Judy Avie, VP of Performance Improvement and Care Design
• Todd Sperl, Master Black Belt
• Diane Radloff, President, Providence
• Maria Strom, CNO, SJMH
• Dr. Ernie Yoder, Physician, Providence
• Chris Palazollo, VP Finance, SJHMC
• Brendon Weil, Black Belt, SJHMC
• Mary Naber, Worklife Service Leader
• Ben Miles, Black Belt
Case Study 2: Expanding CT Capacity at North Shore University Hospital
One of the most prevalent challenges in healthcare involves the ability to move patients efficiently through the system without lengthy delays and bottlenecks along the way. The dilemma can take many forms across the healthcare enterprise, and may relate to issues such as throughput, turnaround time, length of stay, patient flow, or capacity constraints. Lean and Six Sigma have proven useful in many healthcare facilities to pinpoint and address the underlying causes that drive lack of capacity.
Identifying opportunities to improve throughput in radiology can help providers optimize performance and better meet the needs of patients and physicians. At North Shore University Hospital (NSUH), a project team applied its Lean Six Sigma skills to reduce delays and increase throughput in CT procedures. NSUH is located in Manhasset, New York, and is part of the North Shore-Long Island Jewish Health System (NSLIJ). Launching an effort to improve CT capacity would align with the health system’s Strategic Performance Dashboard dials of Service Excellence, Quality, and Operational Performance.
Focusing on both inpatient and outpatient CT scanners, the cross-functional project team was comprised of physician, technical, managerial, transport, and secretarial staff from the radiology department as well as Six Sigma experts from NSLIJ’s Center for Learning and Innovation. Through data collection, leadership support, and a four-day Kaizen event, the team identified three primary target areas:
• Workspace
• Workflow
• Scheduling
Voice of the Customer (VOC) data indicated that the expectation for turnaround time for a routine CT scan was several hours. Looking at current data, however, the team found that turnaround averaged 20.7 hours, with wide variance—anywhere between 8 and 34 hours. They began to evaluate daily patient throughput on the two CT scanners, Monday–Friday (8AM–12PM), with the goal to increase average daily patient throughput by 20 percent (increase patient volume from 45 to 54 patients daily). The anticipated benefits to the organization were to decrease length of stay, reduce scheduling delays, and raise patient and physician satisfaction.
By analyzing baseline data and information from key stakeholders, the team found that the methods used to prepare and deliver oral contrast media were too time-consuming, and that the manual or handwritten inpatient schedule had no visibility to nursing units or the CT reception desk. This situation contributed to a number of problems: excessive phone calls to the technologist control rooms, lack of transporter availability, and a slow pre-transport process. Furthermore, CT technicians and transporters often traveled long distances to obtain order requisition and transport notice forms, and the work environment had become so cluttered that it left the lead tech without any designated workspace.
To resolve these issues, the team used a combination of Six Sigma for process improvement and Lean to reduce or eliminate waste. They led a four-day Kaizen event, which included preparatory work to define the scope of the project, the collection of baseline data, and the formation of a charter to clarify expectations among participants.
The Measure phase began on the first day of the Kaizen event. The team created a detailed value stream map of the CT process, beginning at the point the test is ordered to completion of the test on the CT scanner. Group activities included classification of Value-Added (VA) activities, Business Non-Value Added (BNVA), and Non-Value Added (NVA) activities. Leveraging Lean concepts, the team identified seven forms of waste within the process: Transportation, Inventory, Motion, Waiting, Overproduction, Overprocessing, and Defects/Rework.
The team developed a cause and effect diagram to identify the key drivers to CT throughput (see Figure 12.8), and baseline data collected prior to the Kaizen was added to the process map. Measurement system analysis using a gage R/R confirmed the accuracy of the data, and key metrics were tracked including the number of patients scanned, staff travel distance, and reasons for cancellations.
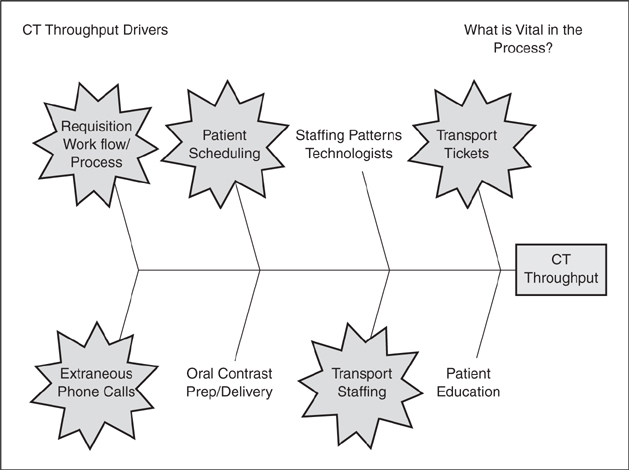
Figure 12.8. CT throughput drivers
On day two of the Kaizen event, it was time to begin brainstorming solutions. Through a collaborative effort built on the 5S method, a number of changes were implemented to create a more positive and orderly work environment, including designating workspace for the CT lead technologist, adding wall-mounted shelves with file holders, and creating a computer station for technical staff (see Figure 12.9).
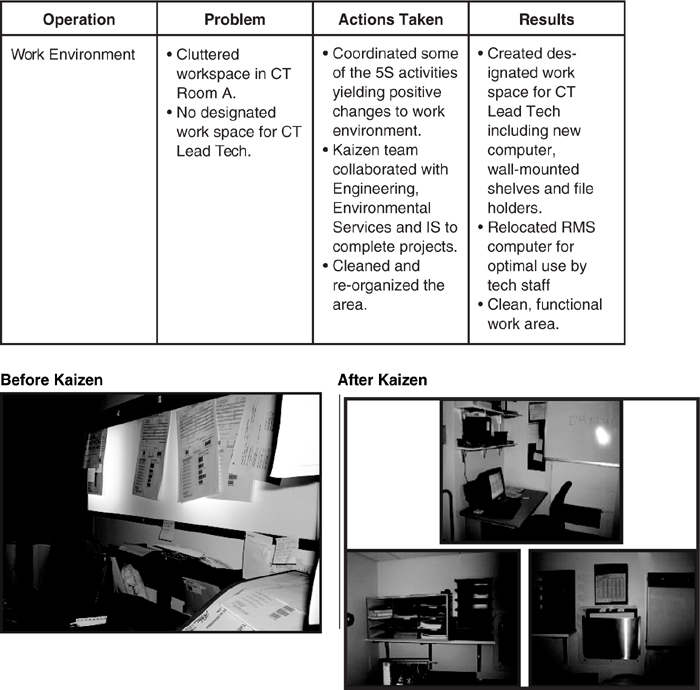
Figure 12.9. Kaizen impact on workspace
Travel time presents another opportunity to apply Lean techniques, and use of a spaghetti diagram can help to visualize the issues. Prior to the Kaizen, data indicated the average CT technologist traveled 6,480 feet per day to the requisition printer—or 324 miles per year of non-value added activity. The transporter logged 432 feet per day (or 21.6 miles per year) of non-value added travel going to and from the transport notification printer.
Scheduling was another area of concern. A handwritten schedule was constantly being revised to meet departmental needs, and there was a lack of scheduling visibility for clerical staff and nursing units. This led to CT technologists receiving approximately 75 calls per day, taking time away from their value-added job of scanning patients.
On the third day, the team try-stormed potential solutions for workflow and scheduling issues. To reduce CT technician and transporter travel time, the team routed both the requisitions and transport tickets to one designated, centrally located printer. This cut out 300 miles of non-value added travel time per year, improved communication between the CT technical staff and transporters, and reduced traffic in the main radiology department hallway (see Figure 12.10).
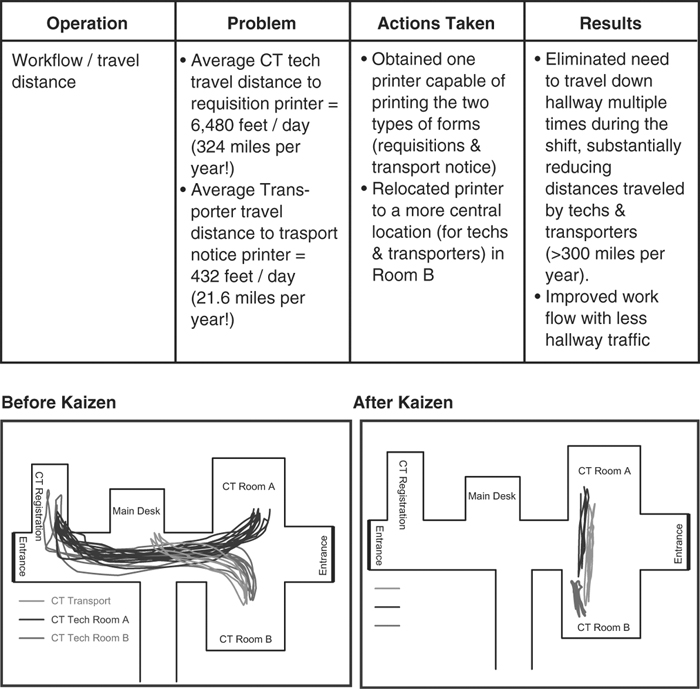
Figure 12.10. Kaizen impact on workflow
Further improvements to the department were made through
• Constructing and reorganizing the reception area
• Reassigning oral contrast preparation to the evening shift
• Delivering morning contrast incorporated into first transporter run for inpatients
• Implementing a new schedule in a Microsoft Excel format (see Figure 12.11)
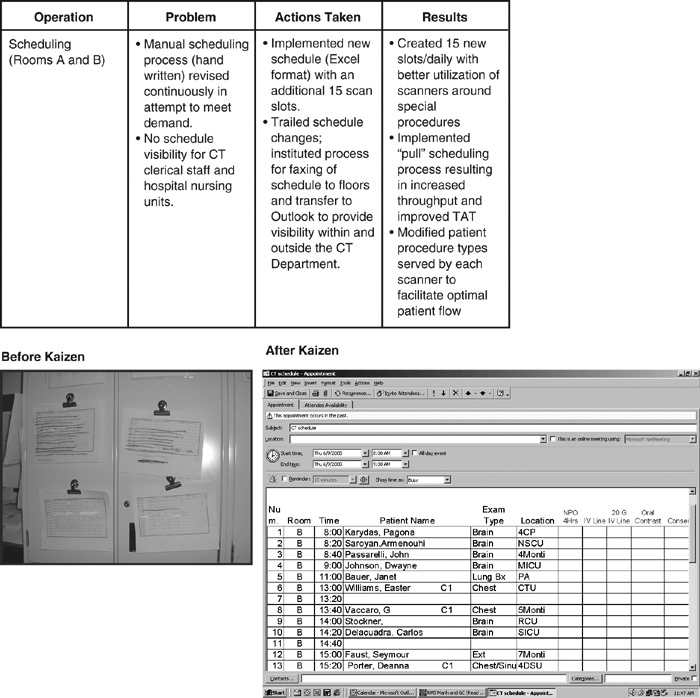
Figure 12.11. Kaizen impact on scheduling
• Developing a process for faxing schedules to floors and providing access through Microsoft Outlook for the CT department and unit secretaries
The team implemented a “pull” process for scheduling, so that as a scan was completed, the next patient was advanced regardless of time. STAT orders were inserted in the schedule and after completion the next patient moved forward. The team felt nursing unit access to scheduling would reduce the daily cancellations caused by improper patient prep or patient unavailability, and minimize calls to technical staff. Another schedule change involved designating the 8AM slot for outpatients and the 8:15AM slot for inpatients. Data showed that although the number of inpatients scanned on Mondays increased, total CT patient volume was statistically higher between Tuesday through Thursday when the department scheduled outpatient procedures (see Figure 12.12). Modifying patient procedure types optimized patient flow through both scanners. A balanced scorecard tool allowed the team to add ten additional outpatient slots to Mondays, generating additional revenue, and a WWW plan (Who What When) insured actions items were assigned with deliverable dates.
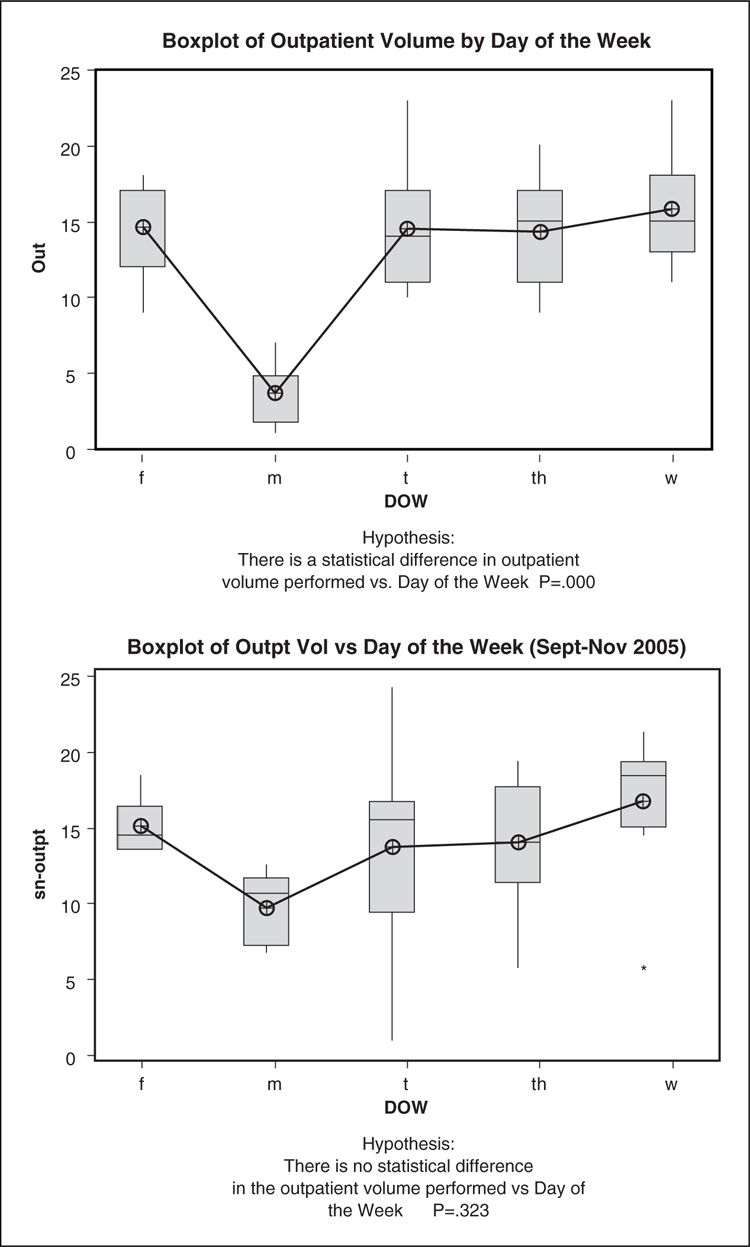
Figure 12.12. Impact on outpatient volume
On day 4, the team piloted the improvements and found a 33 percent increase in CT patient throughput on the two CT scanners. Feedback indicated the nurses appreciated email access to the CT schedule and felt it improved workflow. Strategies were developed to implement and sustain changes across the hospital. I-MR control charts were utilized to track daily patient volume (see Figure 12.13) and process charts monitored turnaround time. At the 30-day report-out, the number of patients scanned daily had increased from an average of 45 per day with a standard deviation of 7 per day to 51 patients per day with a standard deviation of 4. Each patient has an average of 1.4 procedures. The increased patient capacity yielded approximately 200 additional inpatient procedures per month and an additional 60 outpatient procedures per month (see Figures 12.14 and 12.15). Turnaround time for inpatient CT scans decreased from 20.7 hours to 11 hours (see Figure 12.16). Procedure cancellations due to improper patient prep decreased from 30.6 percent to 22.7 percent.
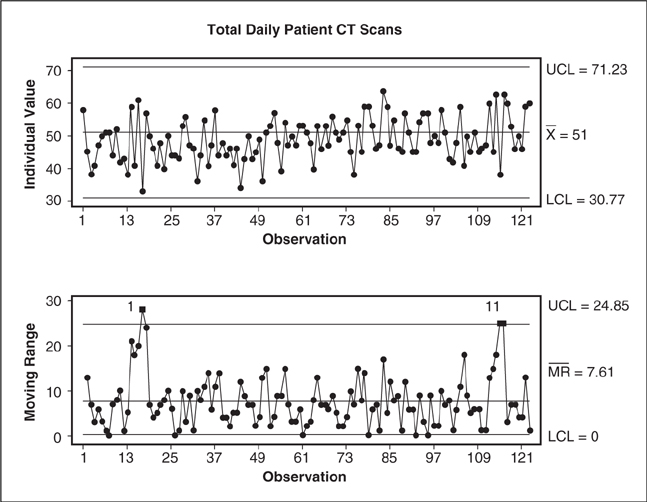
Figure 12.13. Variability in total daily patient CT scans
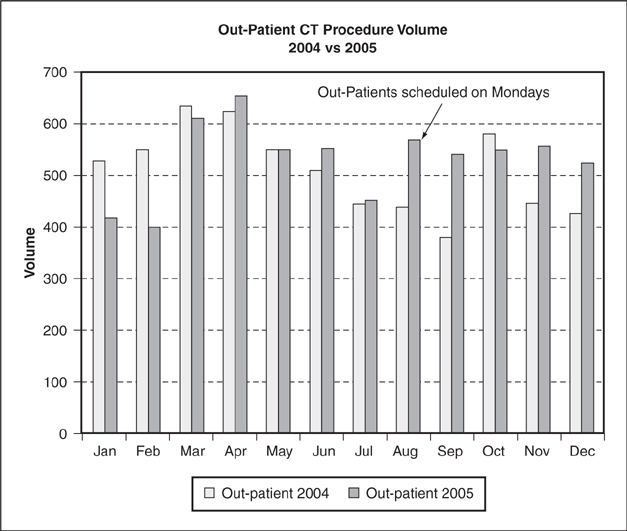
Figure 12.14. Out-patient CT procedure volume
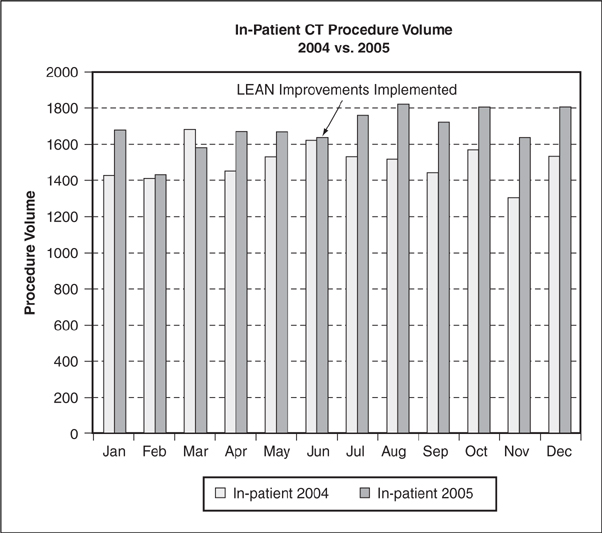
Figure 12.15. In-patient CT procedure volume
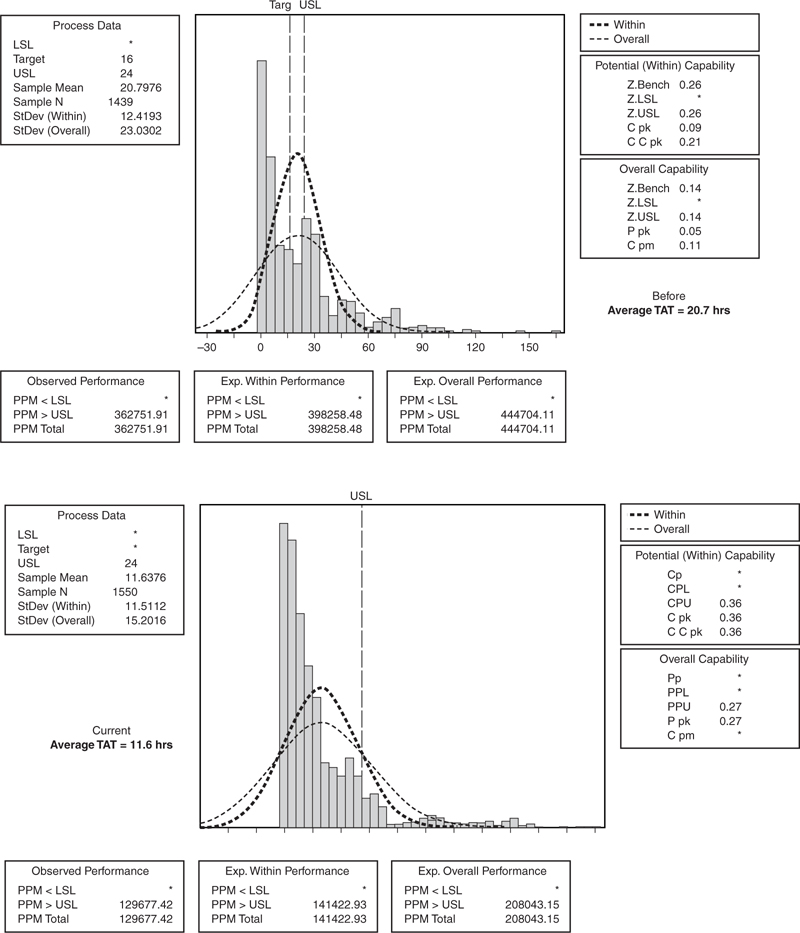
Figure 12.16. CT inpatient turnaround time
In terms of organizational results, the radiology department was able to increase capacity without additional staff while decreasing turnaround time (see Table 12.4). Additional outpatient CT procedures increased revenue to the radiology department by approximately $400 per procedure. For inpatients, length of stay decreased on units with high radiology usage. Employee satisfaction was higher as a result of the project, and though it was doing more scans per day, radiology staff said it felt their jobs were less stressful. In-house calls to CT techs decreased, enabling radiology staff to spend more time performing patient scans and less time on non-valued added tasks such as answering the phone and adjusting the schedule.
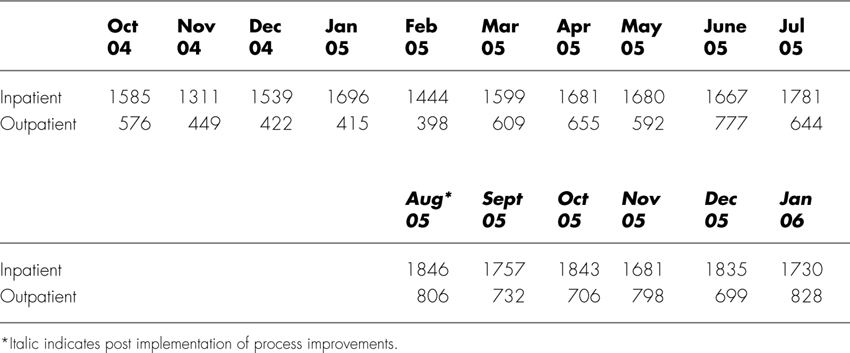
Table 12.4. CT Scan Volume at North Shore University Hospital
This project was a finalist in two categories for The 2006 Global Six Sigma Awards:
• Best Achievement of Six Sigma in Healthcare
• Best Achievement of Integrating Lean and Six Sigma
Endnotes
1. Whitepaper. Going Lean in Healthcare. Cambridge, MA: Institute for Healthcare Improvement, 2005 (http://www.ihi.org/IHI/Results/WhitePapers/GoingLeaninHealthCare.htm).
2. Normal, Gary, Phil Kaczmarksi and Carolyn Pexton “Integrating Six Sigma with Lean & Work-Out in Healthcare,” Six Sigma Healthcare, www.healthcare.isixsigma.com/library/content/c031126a.asp.