
Classifying Recurrent Dynamics on Emotional Speech Signals
Sudhangshu Sarkar⁎; Anilesh Dey† ⁎ Department of Electrical Engineering, Narula Institute of Technology, Kolkata, India
† Department of Electronics and Communication Engineering, Narula Institute of Technology, Kolkata, India
Abstract
The current study was an attempt to understand the dynamics of emotional speech signals. The nonlinear dynamics of two speech signals having two different emotions were investigated using recurrence analysis. First, two types of speech signals were collected when the subject spoke eight sentences in the Bengali language in angry and normal emotion. The recurrence plot and the phase space plot were constructed for each signal and recurrence-based features, namely %isometry and %consecutive isometry were extracted. A marked distinction was visually observed between the normal and the angry emotion-based signals from the recurrence and the phase space plots. The variation was further confirmed from the values of the recurrence parameters. The normal emotion exhibited higher %isometry and %consecutive isometry as compared to the angry emotion. The robustness of the recurrence-based method for classifying the emotional states was established from the consistency of the results provided by the recurrence parameters in both noise-free and noisy environments.
Keywords
Nonlinear dynamics; Recurrence plot; Isometry; Consecutive isometry; Speech signal
8.1 Introduction
Speech signal processing is a vast field of study, which contributes highly to human computer interaction (HCI) studies. Speech is simply the best carrier of information in human communication systems. It contains a lot of information apart from the verbal message, that is, speaker identification, speaker’s age, sex, locality, emotion, etc. Recognition of emotion contained in a speech signal is one of the fastest growing areas of interest in HCI study. Emotion in a speech plays an important role in expressing feelings. Based on different emotions, human speak in different ways, and the characteristics of speech changes, accordingly. Humans don’t need practice to recognize the emotional state of a speaker; it comes naturally [1]. However, it is a complex process when it’s implemented in a machine.
In this regard, a literary review of the past studies on speech-based emotion recognition systems was made. Researchers have proposed many techniques for emotion-based speech recognition [2, 3]. Schuller et al. [4] reported the continuous use of hidden Markov models (HMM) for speech-emotion recognition. The same group further extended their work in 2004 by combining acoustic features with linguistic data for a healthy emotion detection using support vector machine (SVM) [5]. Lin et al. [6] used the aforementioned two methods, namely HMM and SVM for classification of five dissimilar states of emotion, that is, annoyance, pleasure, sorrow, shock, and impartial emotion. Lalitha et al. [7] reported the use of time-domain speech features like pitch and prosody for recognition of seven different emotional states. Kamal et al. [8] predicted protein structures from images using HMM. Chapman Kolmogrov. Dey et al. [9,10] analyzed the progressiveness of acoustic waves in biomedical technology.
Identifying suitable features that characterize different emotions is an important process for developing a speech emotion recognition (SER) system [11]. Altrov et al. [12] identified the power of verbal communication and civilization on the accepting of language emotions. An effective discussion mainly depends on how we communicate our own emotions, how we recognize those of others, and how sufficient our reaction is to their emotions. Cowie et al. [13,14] illustrated that emotions have an essential role in our lives since they are typically present in everyday communication. Park and Sim [15] showed emotion detection by DRNN. Their paper found that pitch was a significant component in the identification of emotion. Therefore the basic accurate detection acoustical features [16,17] were analyzed for speech sound with emotion. The study of event-related potentials (ERPs) is recognized as a useful technique for exploring intelligent mechanisms of processing emotional speech [18]. Tao et al. [19] attempts to create exciting dialogue via “strong,” “average,” and “weak” classifications using various models like a linear modification model (LMM), a Gaussian mixture model (GMM), a classification and regression tree model (CART). Kang and Li [19] analyzed neutral-emotional speech by using prosody conversion. In 2010, Wu et al. [20] presented an advance to hierarchical prosody translation for an exciting language mixture. Jia et al. [21] adopted “Emotional Audio Visual Speech Synthesis Based on PAD,” while Dey and Ashour [22, 23] discussed arrival estimation of localized multispeech sources. An emotional text-to-speech system [24] is required for emotion-based speech recognition. Neural networks [25–27] have exhibited remarkable success to link the responsive space in communication signals. The direction of speech resources on a localized level has been eminently described by Dey and Ashour [28–30]. least squares regression [31] is one of the noted methods for speech emotion recognition. An ideal scientific SER system would be one that can develop real life and loud talking to recognize different state of emotions. In this paper, we have attempted to classify the recurrent dynamics of two different emotions, namely anger and normal, with the help of recurrence plot, phase space plot, and recurrence based parameters. The investigation was performed in both noise-free and on noisy environment to establish the suitability of the proposed method.
8.2 Data Collection and Processing
A healthy male volunteer (age 23 years old) was asked to participate in the study. He was informed about the details of the study, and a written consent to participate was obtained. Two types of speech signals were acquired from the volunteer using microphone Behringer C-1U, when he uttered eight different sentences (in the Bengali language) in angry and normal emotion. In order to process the speech signals, the sampling frequency was taken as 16 KHz in using Audacity version 1.3.6. in the Electronics and Communication Engineering Department, Narula Institute of Technology, Agarpara, Kolkata.
8.3 Research Methodology
Phase space approach was used to investigate the nonlinear properties of the speech signals. A phase space was reconstructed for each speech signal with appropriate time delay and proper embedding measurement.
8.3.1 Phase Space Reconstruction
The condition of a dynamical method is able to be illustrated in a space called phase space. A phase space is a multidimensional space, in which every point correlates with one state of the dynamical system [32]. The path traced by the phase space diagram of a system over time describes its evolution from an initial state. This is known as phase space trajectory.
The basic problem is that the information about all the variables governing the system is usually not obtained from its time series. Most of the time the series is single valued. Although numerous concurrent measurements can be performed; they may not coat each degree of freedom of the arrangement. Though the use of the time-delay embedding theorem [33] allows the recovery of lost information, and it becomes possible to construct the phase space diagram of a scheme from its period sequence. This method of phase space reconstruction requires the determination of the principles of suitable time delay τ and proper embedding measurement m.
Determining the most favorable value of time delay τ for the phase space reformation, for any time series {x(t)}t = 1N at a given state x(t), τ is one of the proper values of time delay, which divulges utmost novel information through dimension at x(t + τ). The auto mutual information (AMI) technique [34] is usually adapted the proper value of τ. The AMI of a time series for a given τ is calculated using Eq. (8.1) [35]. The optimal value of τ is that one for which AMI(τ) reaches its first minimum [34].

where τ = [1, 2, …, N − 1] and P[ ] denotes the probability.
Embedding dimension is a measure of the least element of the phase space of the reconstructed characteristic of a dynamical system [36, 37]. Kennel et al. [38] have anticipated the method of false nearest neighbor (FNN) to determine the minimum satisfactory embedding dimension m. The FNN algorithm can be described as follows.
For every point ![]() in the time series, its adjacent neighbor
in the time series, its adjacent neighbor ![]() is searched in an m- dimensional space. The space
is searched in an m- dimensional space. The space ![]() is calculated. Both the points are iterated and
is calculated. Both the points are iterated and ![]() is computed as given in Eq. (8.2).
is computed as given in Eq. (8.2).

If the computed value of ![]() goes beyond a specified heuristic verge
goes beyond a specified heuristic verge ![]() , this point is regarded as having a fake nearby neighbor. The minimal embedding length is obtained when the percentage of FNN at a given dimension reaches zero.
, this point is regarded as having a fake nearby neighbor. The minimal embedding length is obtained when the percentage of FNN at a given dimension reaches zero.
8.3.2 Recurrence Plot Analysis
Recurrence plot (RP) is one of the efficient graphical methods designed to find the hidden nonlinear structure of the phase spaces, introduced by Eckmann et al. [39]. For any two points xi, xj in a phase space, the distance among xi and xj can be calculated by ‖xi − xj‖. Then, the recurrence between two points xi and xj is given by.
where Θ represents Heaviside function.
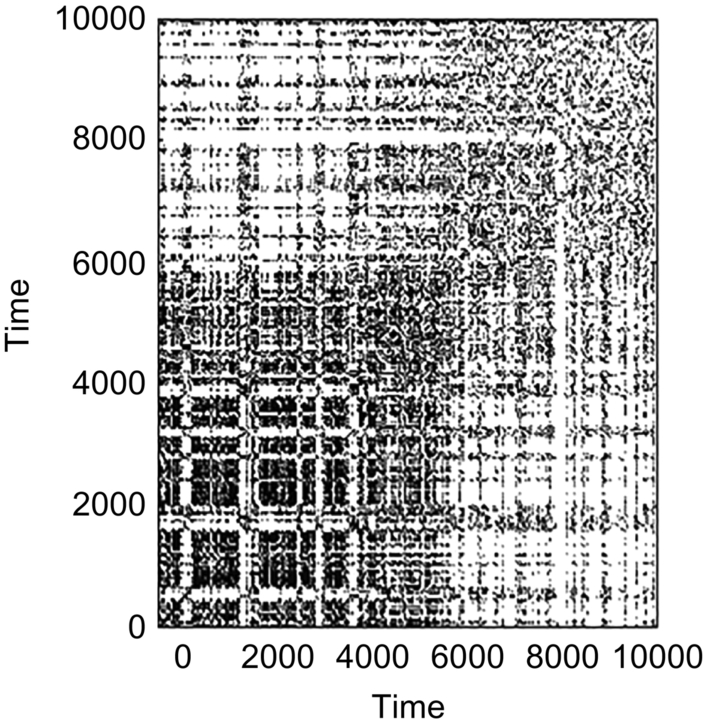
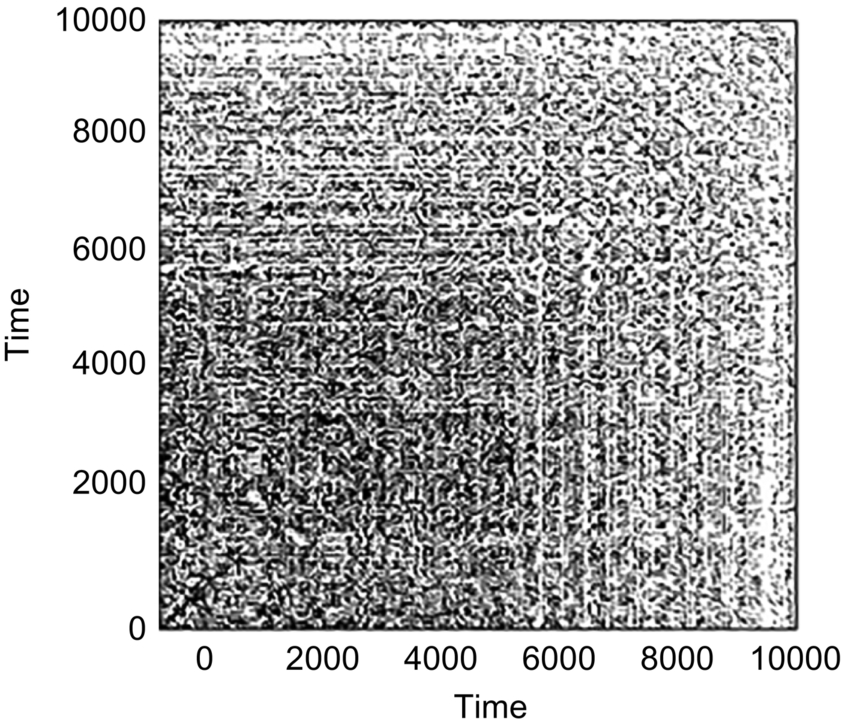
From the definition, it follows that the entries in the matrix (Rij)N × N (N being the span of the trajectory of the phase space) are either 1 or 0. The number “1” is represented by a black dot. On the other hand, “0” is represented by a white dot. So, an RP is a visual representation of a phase space by two colors. From the structure of the RP, various dynamical patterns of a complex dynamic can be described, such as periodicity, quasiperiodicity, noise effect, nonstationary behavior, and a chaotic nature. It indicates that classification between two different dynamics can be made by RP analysis. Fig. 8.1(A) and (B) show the recurrence plot of a speech signal in angry emotion and normal emotion, respectively.

If two points xi and xj are recurrent, we say that there is an isometry. Two points xi and xj in a phase space are said to be in consecutive isometry if.
whereL ∈ Z+.
Since periodicity and aperiodicity of a phase space are the reflection of isometry, so the nature of the dynamics can be described by it. In fact, complexity of the RP decreases as the consecutive isometry increases [40, 41].
8.4 Numerical Experiments and Results
In this work, speech signals in angry and normal emotion were analyzed using RP analysis for two cases, that is, noise free and noisy conditions. Two informative parameters, namely isometry and consecutive isometry were calculated for each case. For both cases, proper time delay and embedding dimension were recalculated. Fig. 8.2(A) shows the time delay for a speech signal in both the angry and normal emotion, which are represented by red and blue lines respectively. In order to calculate the probability, 17 bins were considered.
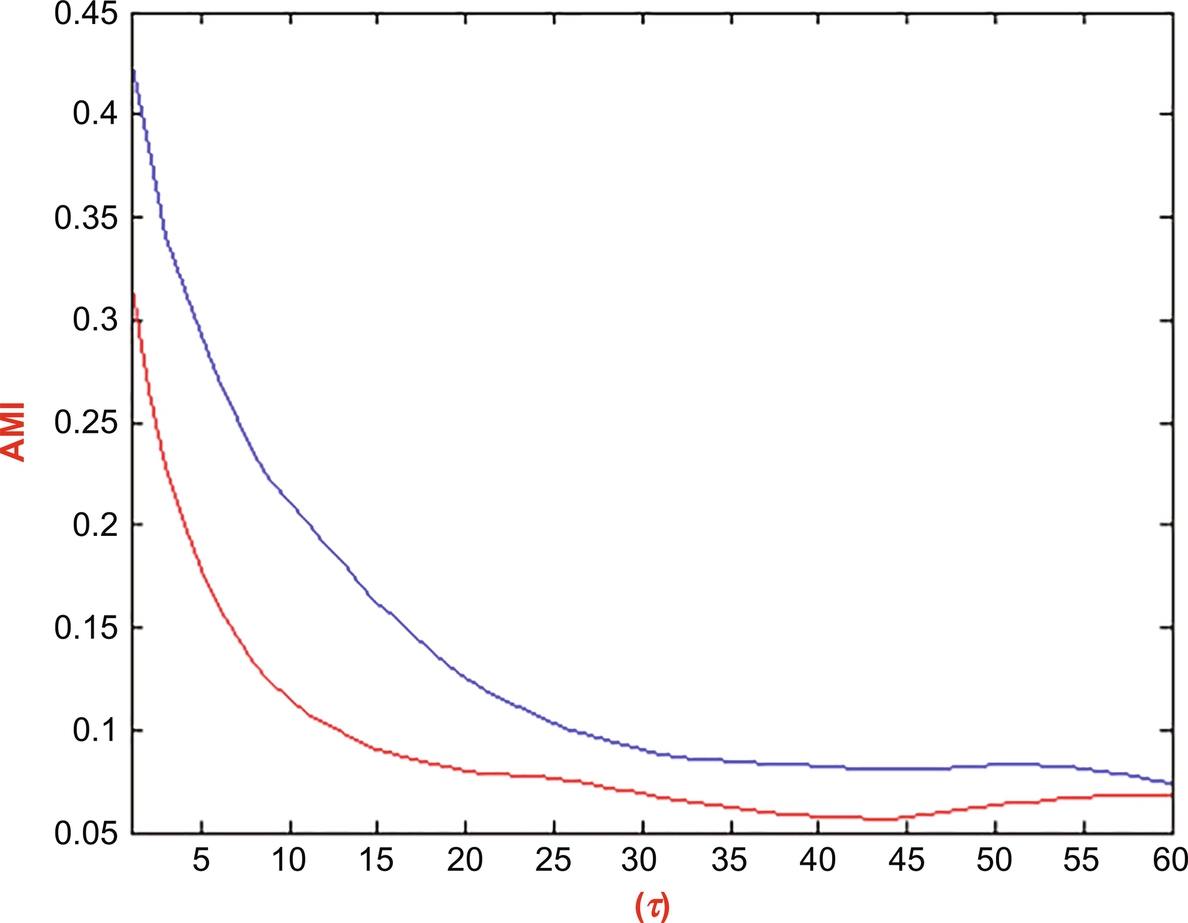

From the figure, it is observed that the AMI was minimum at τ = 60 in the case of normal speech, whereas it was minimum at τ = 43 for the angry speech signal. It suggested that the optimal time delay was different for the same speech in two different emotions. In fact, it was higher in the case of normal speech than that of the speech in angry emotion.
The percentage of FNN was calculated for embedding dimensions ranging from 1 to 10 with variable time delay τ varies from 1 to 60. Fig. 8.2(B) shows the fluctuation of FNN with embedding dimension for a speech signal in the angry emotion. The dimension, for which the percentage of FNN was minimum, was taken as the suitable embedding dimension.
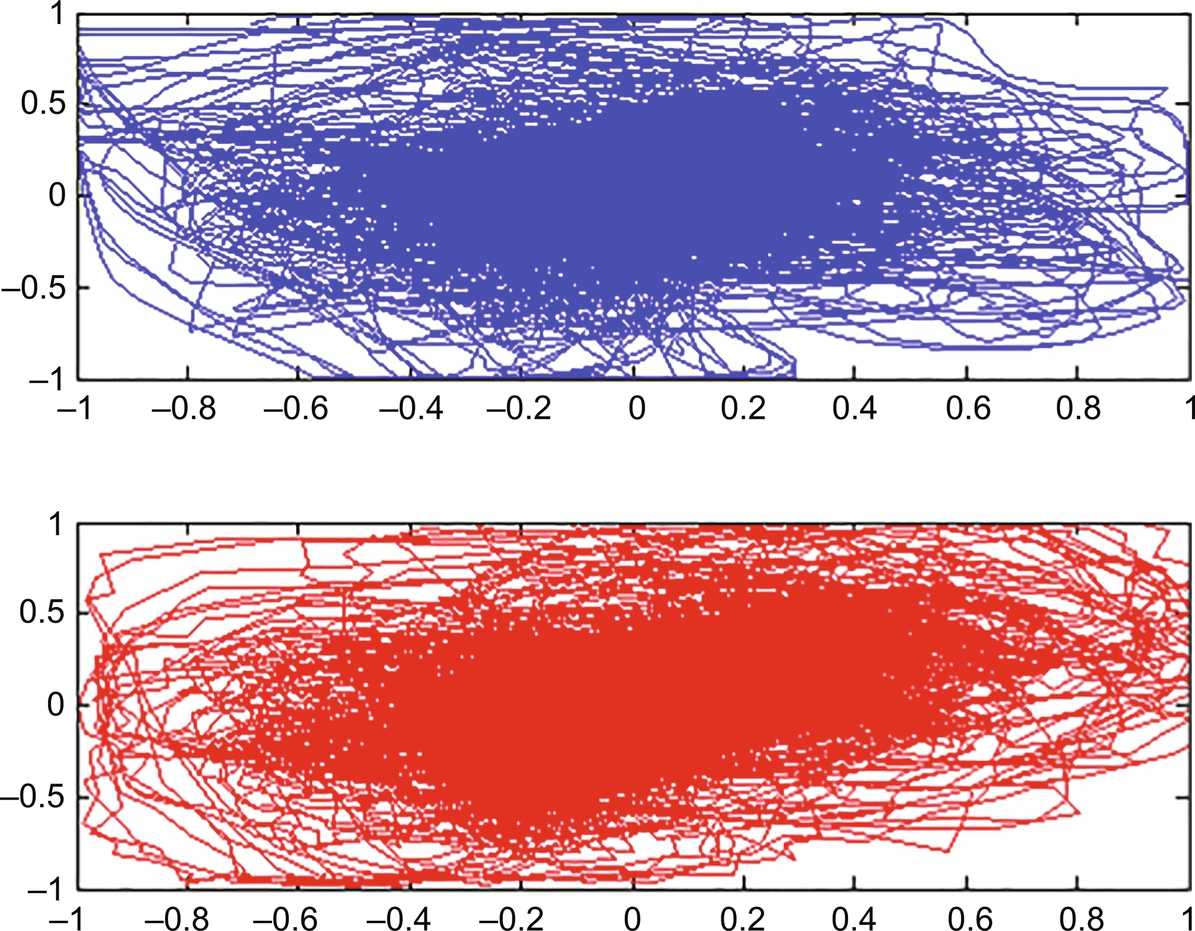
Dimension ranging from 1 to 10 with τ = 43. The phase space diagram was reconstructed for the speech signal for angry and normal emotion with proper time delay [42, 43] for each case as given in Fig. 8.2(C).
From Fig. 8.2(C), it can be seen that the number of outliers increased in the angry emotion compared to the normal emotion. It also can be seen that the normal emotion speech signal exhibited denser orbit than the angry emotion speech signal. These results suggest that different dynamics benefit different emotional states.
8.4.1 Noise-Free Environment
As stated above, isometry is the measure of recurrence in any phase space. It is calculated as
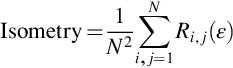
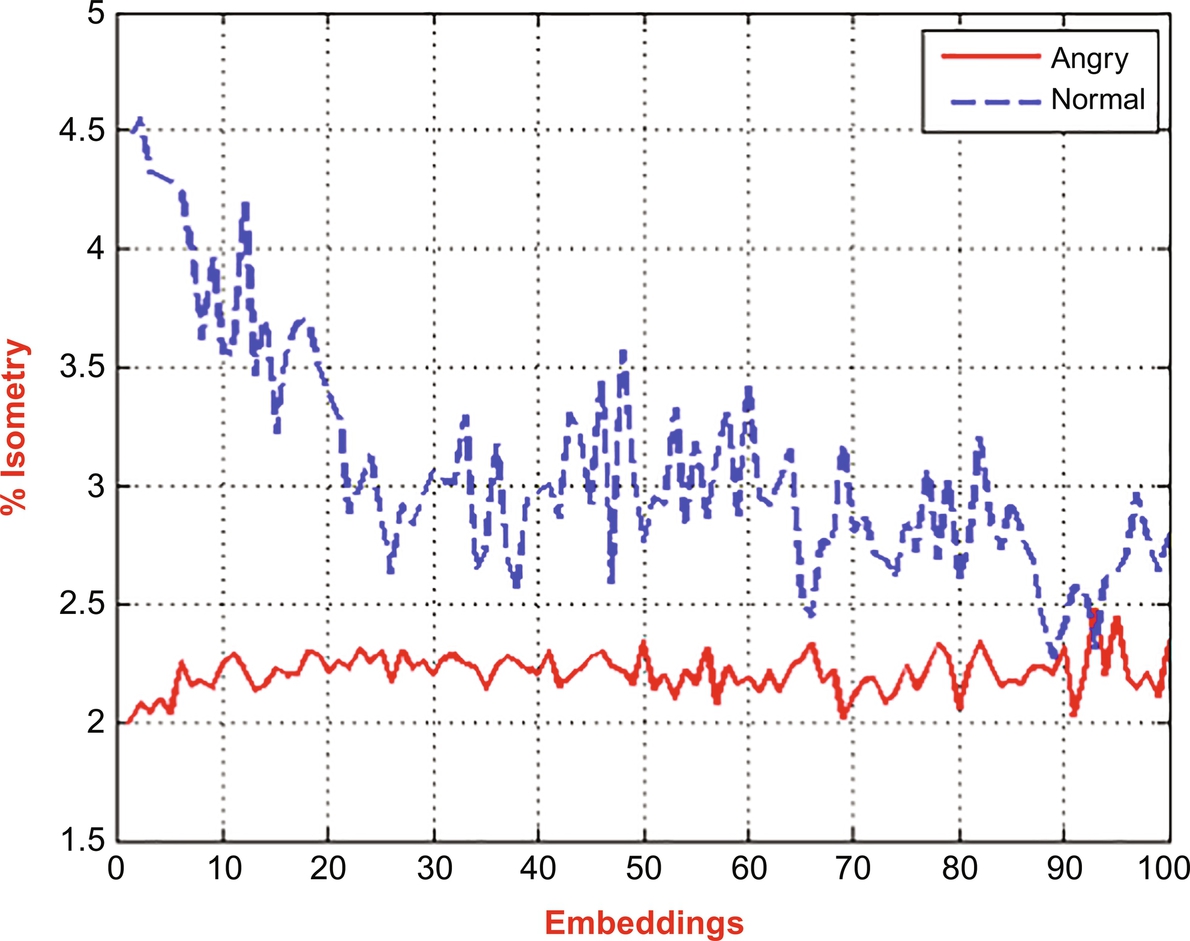
where N is the number of speech samples and Ri, j(ɛ) is the repetition matrix equivalent to a threshold of ɛ. Isometry is represented as the quantity of isometric recurrences articulated as a fraction of the entire quantity of pairs of vectors contrast in the sample (i.e., %isometry) [44]. The design of %isometry or any of its copied frameworks as a function of embedding dimension is considered as an embedding plot. The embedding plot of %isometry, represented in Fig. 8.3, shows the comparison between the %isometry of two speech signals in angry and normal emotion in a noise-free environment.
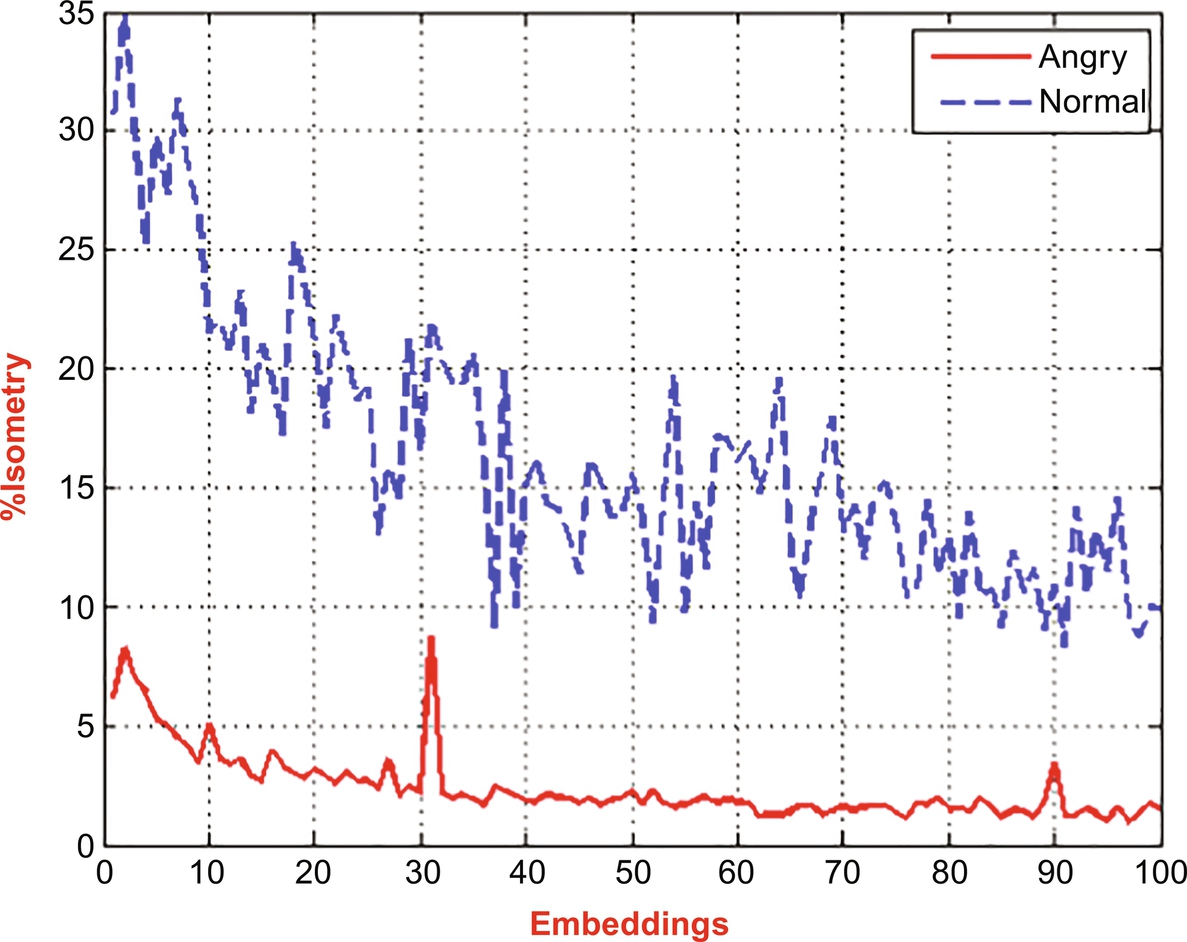
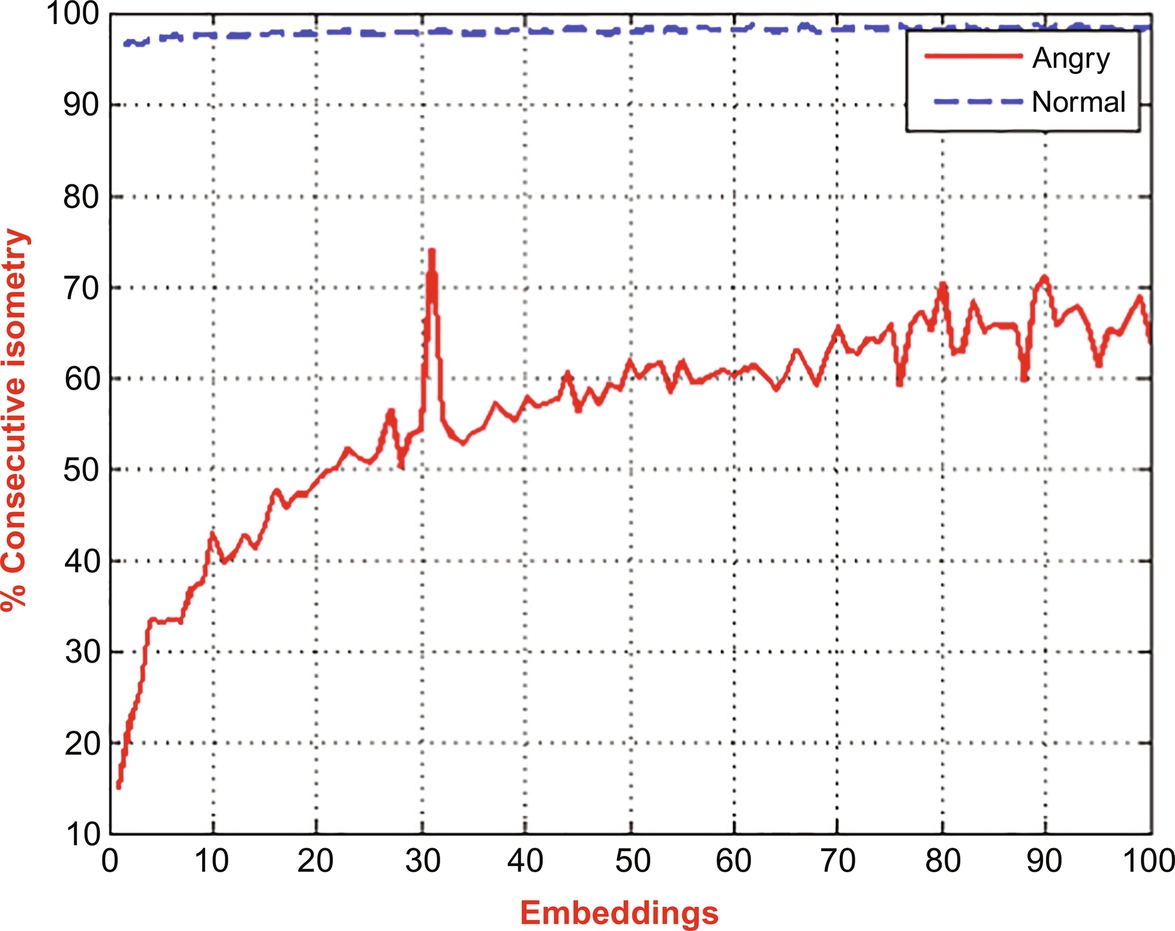
Fig. 8.3 clearly shows that the %isometry of the normal emotional speech signal was higher than that of the angry speech signal. It suggests that the autocorrelation was higher in the case of the normal speech signal. The same observation is also made for %consecutive isometry, represented in Fig. 8.4. (See Fig. 8.5.)
8.4.2 Noisy Environment
To investigate the effect of noise on the isometry, a Gaussian noise was added, given by ![]() , where φ(ξ) is a Gaussian random variable.
, where φ(ξ) is a Gaussian random variable.
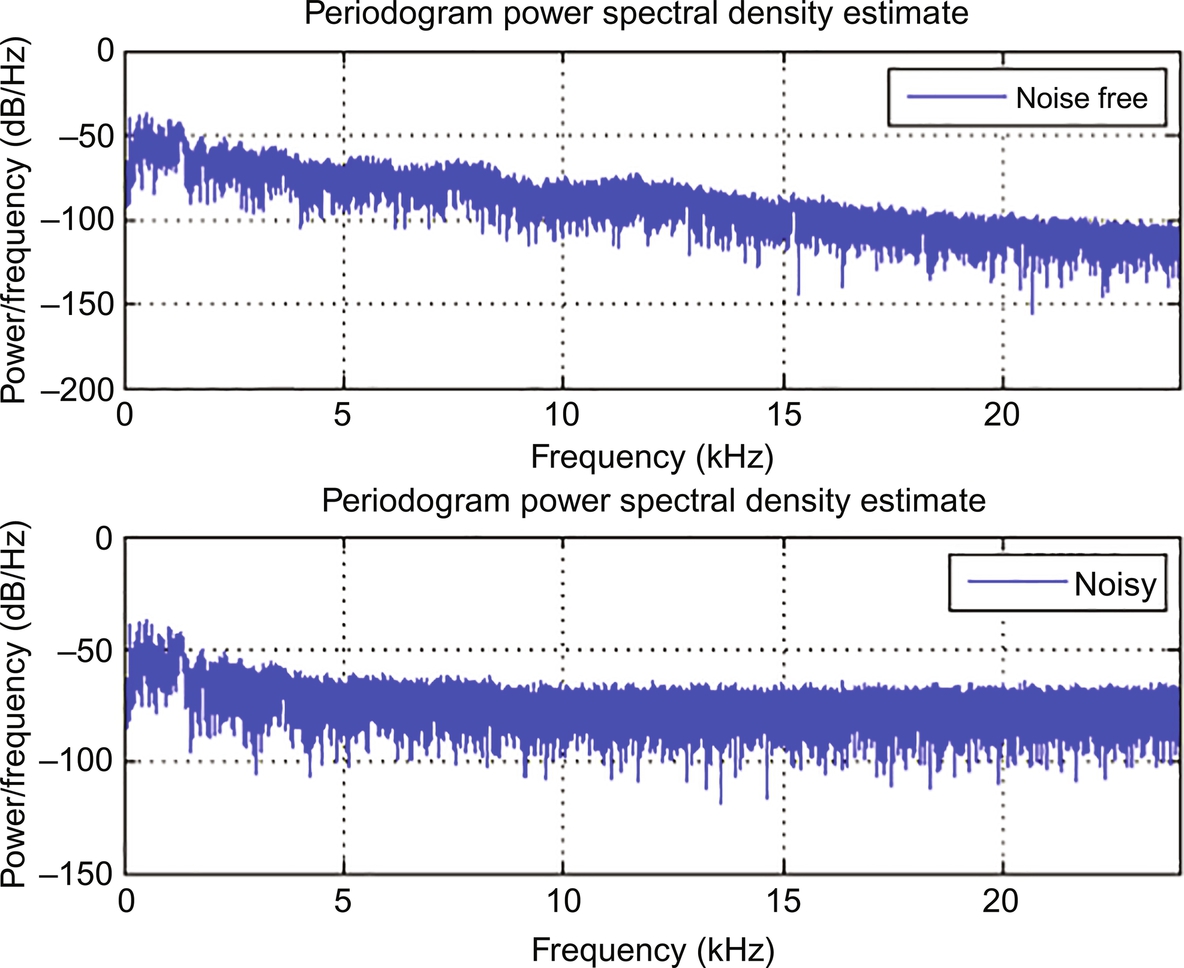
When the energy of the signal is strong in the region of a restricted time interim (especially if its total energy is limited), one may calculate the energy spectral compactness. However, more commonly used is the power spectrum. In the experiment, it was noticed that the power frequency of the signal became higher in the power spectrum after the addition of noise.
Fig. 8.6(A) and (B) shows the recurrence plot of a speech signal in angry emotion and usual emotion, respectively. After the addition of noise.
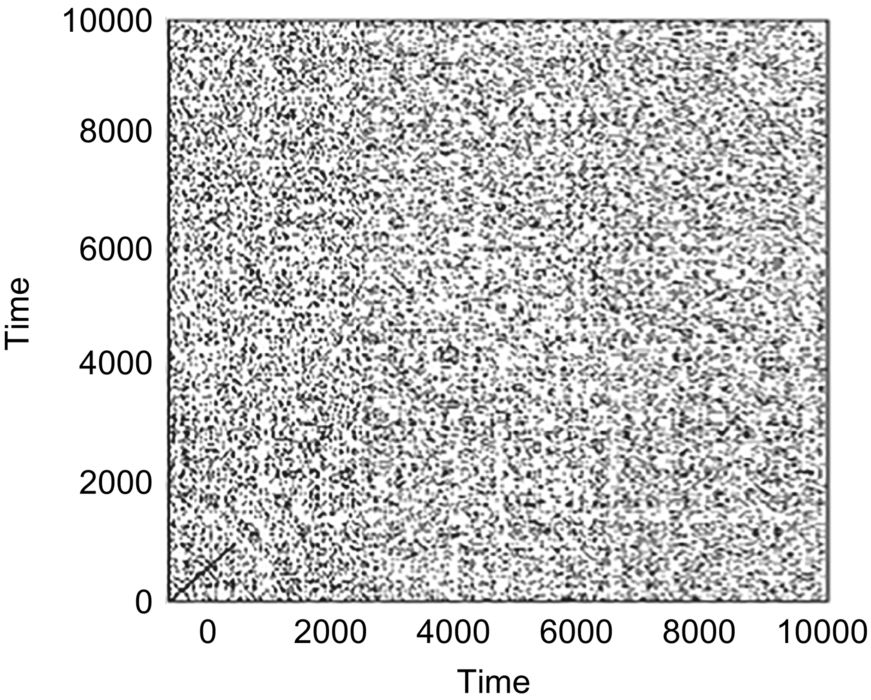
In a noisy condition, it was observed that the recurrence plots were more complex with lots of dark dots. It suggested that the addition of noise in the signal increased the recurrence rate.
Both %isometry and %consecutive isometry were again calculated for the speech signals in angry and normal emotions after adding the noise. Figs. 8.7 and 8.8 show the embedding plots of %isometry and %consecutive isometry, for speech signals in angry and normal emotion, respectively, after adding noise. It is evident from the figures that the speech signal in normal emotion exhibited more %isometry and %consecutive isometry than the speech signal in an angry emotion, similar to that of a noise-free condition. These results indicated the robustness of the two parameters even in the noisy condition.

8.5 Conclusion
Speech signals were acquired from a healthy male volunteer at a sampling rate of 16 KHz, when the volunteer uttered eight sentences in the Bengali language in normal and angry emotion. Phase space analysis and recurrence analysis were performed on the speech signals to classify normal and angry emotion conditions. During the editing of the phase space diagram, the proper values of time delay and the embedding dimension were approximated using auto mutual information (AMI) and false nearest neighbor (FNN) mechanism, respectively. The proper time delay was found to be more for normal emotion than angry emotion. The phase space plot for normal emotion had a denser orbit and lower number of outliers than that of the angry emotion. The recurrence plots were drawn and correlated parameters, specifically %isometry and %consecutive isometry, were calculated for the speech signals acquired during normal and angry emotion in noise-free and noisy environments. In both noise-free and noisy environments, %isometry and %consecutive isometry values were greater for normal emotion than angry emotion. This suggested that these parameters are robust to environmental noise and can be used to develop a SER system for classifying different emotional states.