
CHAPTER 9 Inventories: Additional Valuation Issues
LEARNING OBJECTIVES
After studying this chapter, you should be able to:
- Describe and apply the lower-of-cost-or-market rule.
- Explain when companies value inventories at net realizable value.
- Explain when companies use the relative sales value method to value inventories.
- Discuss accounting issues related to purchase commitments.
- Determine ending inventory by applying the gross profit method.
- Determine ending inventory by applying the retail inventory method.
- Explain how to report and analyze inventory.
Not What It Seems to Be
Investors need comparable information about inventory when evaluating a retailer's financial statements. To do so, investors need to determine what inventory method a retailer is using (FIFO, LIFO, average-cost, or a combination of methods) and then adjust the company to a common method. That is a good start. What investors often then do is compute relevant information about the company such as inventory turnover, number of days sales in inventory, gross profit rate, and liquidity measures such as the acid-test ratio. These calculations are critical. Inventory is a significant component of working capital and the gross profit resulting from sales of inventory is often viewed as the most important income component in measuring a retailer's progress. For example, consider the financial statements of Best Buy shown in the following table. Inventory comprises over 50 percent of current assets, and gross profit represents 24 percent of sales revenue.
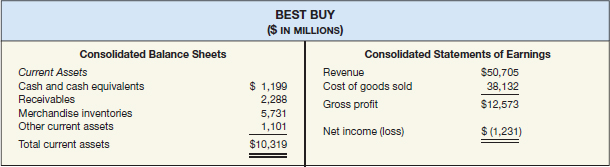
Therefore, analysis is based on these numbers. However, there often are still questions about the reliability of the information reported in the financial statements. That is, subjective estimates are involved because of the possible impairment of the inventory. For example, Best Buy provides disclosures related to inventory in its annual report, shown on the next page.
- See the Underlying Concepts on pages 479, 480, and 484.
![]() INTERNATIONAL FOCUS
INTERNATIONAL FOCUS
- See the International Perspectives on pages 474, 475, and 482.
- Read the IFRS Insights on pages 525–534 for a discussion of:
- Lower-of-cost-or-net realizable value (LCNRV)
- Agricultural inventory
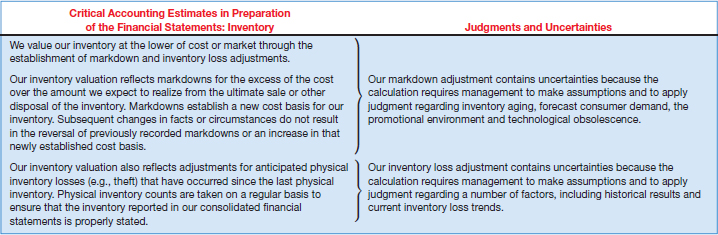
As indicated in the table below, subjective estimates concerning the measurement and valuation of inventory (related to markdowns and inventory losses) could have a significant impact on an investor's ability to compare inventory levels (and their impact on gross profit) at Best Buy relative to other retailers. Thus, inventory balances may not be what they seem, not only due to the cost flow assumptions (e.g., LIFO/FIFO) you learned about in Chapter 8 but also due to significant markdowns and losses that you will learn about in this chapter.
PREVIEW OF CHAPTER 9
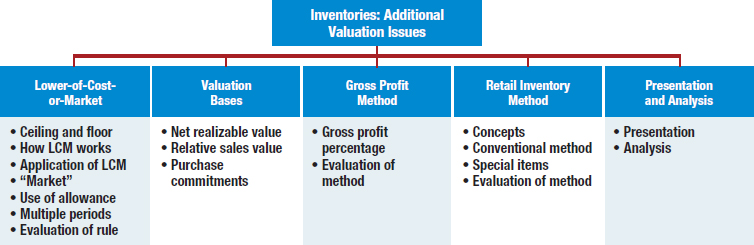
As our opening story indicates, information on inventories is important to investors. In this chapter, we discuss some of the valuation and estimation concepts that companies use to develop relevant inventory information. The content and organization of the chapter are as follows.
LOWER-OF-COST-OR-MARKET
Inventories are recorded at their cost. However, if inventory declines in value below its original cost, a major departure from the historical cost principle occurs. Whatever the reason for a decline—obsolescence, price-level changes, or damaged goods—a company should write down the inventory to market to report this loss. A company abandons the historical cost principle when the future utility (revenue-producing ability) of the asset drops below its original cost. Companies therefore report inventories at the lower-of-cost-or-market at each reporting period.
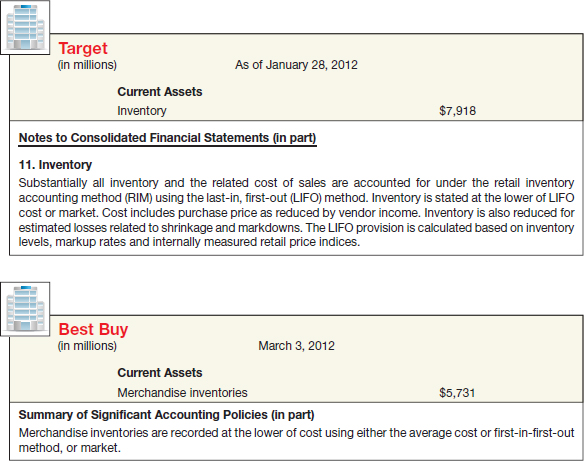
Illustration 9-1 shows how Target and Best Buy reported this information.
![]() International Perspective
International Perspective
IFRS defines market as net realizable value; GAAP defines market as replacement cost subject to certain constraints.
Recall that cost is the acquisition price of inventory computed using one of the historical cost-based methods—specific identification, average-cost, FIFO, or LIFO. The term market in the phrase “the lower-of-cost-or-market” (LCM) generally means the cost to replace the item by purchase or reproduction. For a retailer like Nordstrom, the term “market” refers to the market in which it purchases goods, not the market in which it sells them. For a manufacturer like William Wrigley Jr., the term “market” refers to the cost to reproduce. Thus the rule really means that companies value goods at cost or cost to replace, whichever is lower.
For example, say Target purchased a Timex wristwatch for $30 for resale. Target can sell the wristwatch for $48.95 and replace it for $25. It should therefore value the wristwatch at $25 for inventory purposes under the lower-of-cost-or-market rule. Target can use the lower-of-cost-or-market rule of valuation after applying any of the cost flow methods discussed above to determine the inventory cost.
A departure from cost is justified because a company should charge a loss of utility against revenues in the period in which the loss occurs, not in the period of sale. Note also that the lower-of-cost-or-market method is a conservative approach to inventory valuation. That is, when doubt exists about the value of an asset, a company should use the lower value for the asset, which also reduces net income.
Ceiling and Floor
Why use replacement cost to represent market value? Because a decline in the replacement cost of an item usually reflects or predicts a decline in selling price. Using replacement cost allows a company to maintain a consistent rate of gross profit on sales (normal profit margin). Sometimes, however, a reduction in the replacement cost of an item fails to indicate a corresponding reduction in its utility. This requires using two additional valuation limitations to value ending inventory—net realizable value and net realizable value less a normal profit margin.
Net realizable value (NRV) is the estimated selling price in the ordinary course of business, less reasonably predictable costs of completion and disposal (often referred to as net selling price). A normal profit margin is subtracted from that amount to arrive at net realizable value less a normal profit margin.
To illustrate, assume that Jerry Mander Corp. has unfinished inventory with a sales value of $1,000, estimated cost of completion and disposal of $300, and a normal profit margin of 10 percent of sales. Jerry Mander determines the following net realizable value.

![]() See the FASB Codification section (page 504).
See the FASB Codification section (page 504).
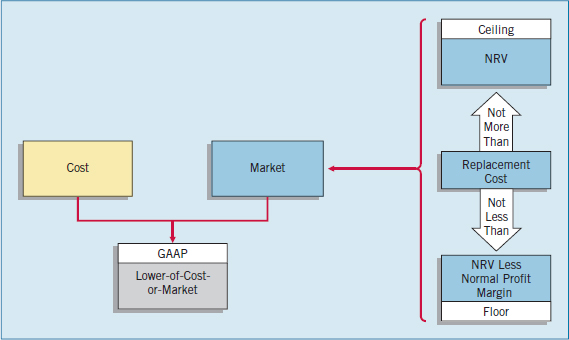
The general lower-of-cost-or-market rule is: A company values inventory at the lower-of-cost-or-market, with market limited to an amount that is not more than net realizable value or less than net realizable value less a normal profit margin. [1]
The upper limit (ceiling) is the net realizable value of inventory. The lower limit (floor) is the net realizable value less a normal profit margin. What is the rationale for these two limitations? Establishing these limits for the value of the inventory prevents companies from over- or understating inventory.
The maximum limitation, not to exceed the net realizable value (ceiling), prevents overstatement of the value of obsolete, damaged, or shopworn inventories. That is, if the replacement cost of an item exceeds its net realizable value, a company should not report inventory at replacement cost. The company can receive only the selling price less cost of disposal. To report the inventory at replacement cost would result in an overstatement of inventory and understatement of the loss in the current period.
To illustrate, assume that Staples paid $1,000 for a color laser printer that it can now replace for $900. The printer's net realizable value is $700. At what amount should Staples report the laser printer in its financial statements? To report the replacement cost of $900 overstates the ending inventory and understates the loss for the period. Therefore, Staples should report the printer at $700.
![]() International Perspective
International Perspective
IFRS does not use a ceiling or floor to determine market.
The minimum limitation (floor) is not to be less than net realizable value reduced by an allowance for an approximately normal profit margin. The floor establishes a value below which a company should not price inventory, regardless of replacement cost. It makes no sense to price inventory below net realizable value less a normal margin. This minimum amount (floor) measures what the company can receive for the inventory and still earn a normal profit. Use of a floor deters understatement of inventory and overstatement of the loss in the current period.
Illustration 9-3 graphically presents the guidelines for valuing inventory at the lower-of-cost-or-market.
How Lower-of-Cost-or-Market Works
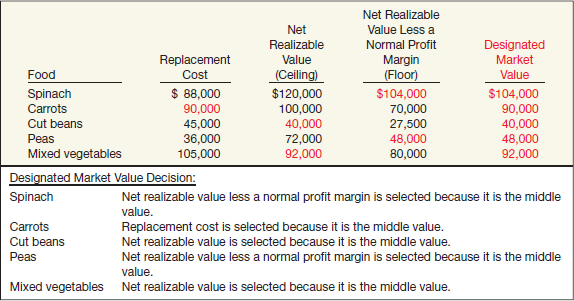
The designated market value is the amount that a company compares to cost. It is always the middle value of three amounts: replacement cost, net realizable value, and net realizable value less a normal profit margin. To illustrate how to compute designated market value, assume the information relative to the inventory of Regner Foods, Inc., as shown in Illustration 9-4.
Regner Foods then compares designated market value to cost to determine the lower-of-cost-or-market. It determines the final inventory value as shown in Illustration 9-5.
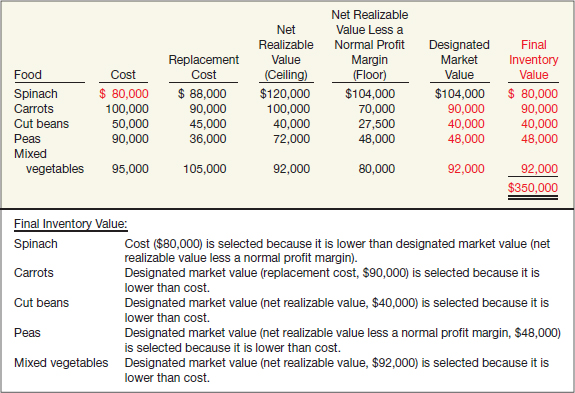
The application of the lower-of-cost-or-market rule incorporates only losses in value that occur in the normal course of business from such causes as style changes, shift in demand, or regular shop wear. A company reduces damaged or deteriorated goods to net realizable value. When material, it may carry such goods in separate inventory accounts.
Methods of Applying Lower-of-Cost-or-Market
In the Regner Foods illustration, we assumed that the company applied the lower-of-cost-or-market rule to each individual type of food. However, companies may apply the lower-of-cost-or-market rule either directly to each item, to each category, or to the total of the inventory. If a company follows a major category or total inventory approach in applying the lower-of-cost-or-market rule, increases in market prices tend to offset decreases in market prices. To illustrate, assume that Regner Foods separates its food products into two major categories, frozen and canned, as shown in Illustration 9-6.
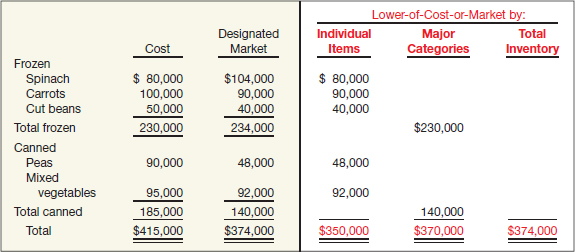
If Regner Foods applied the lower-of-cost-or-market rule to individual items, the amount of inventory is $350,000. If applying the rule to major categories, it jumps to $370,000. If applying LCM to the total inventory, it totals $374,000. Why this difference? When a company uses a major categories or total inventory approach, market values higher than cost offset market values lower than cost. For Regner Foods, using the major categories approach partially offsets the high market value for spinach. Using the total inventory approach totally offsets the high market value for spinach.
Companies usually price inventory on an item-by-item basis. In fact, tax rules require that companies use an individual-item basis barring practical difficulties. In addition, the individual-item approach gives the most conservative valuation for balance sheet purposes.1 Often, a company prices inventory on a total-inventory basis when it offers only one end product (comprised of many different raw materials). If it produces several end products, a company might use a category approach instead. The method selected should be the one that most clearly reflects income. Whichever method a company selects, it should apply the method consistently from one period to another.2
Recording “Market” Instead of Cost
One of two methods may be used to record the income effect of valuing inventory at market. One method, referred to as the cost-of-goods-sold method, debits cost of goods sold for the write-down of the inventory to market. As a result, the company does not report a loss in the income statement because the cost of goods sold already includes the amount of the loss. The second method, referred to as the loss method, debits a loss account for the write-down of the inventory to market. We use the following inventory data for Ricardo Company to illustrate entries under both methods.
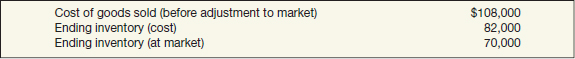
Illustration 9-7 shows the entries for both the cost-of-goods-sold and loss methods, assuming the use of a perpetual inventory system.
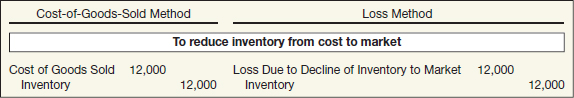
The cost-of-goods-sold method buries the loss in the Cost of Goods Sold account. The loss method, by identifying the loss due to the write-down, shows the loss separate from Cost of Goods Sold in the income statement.
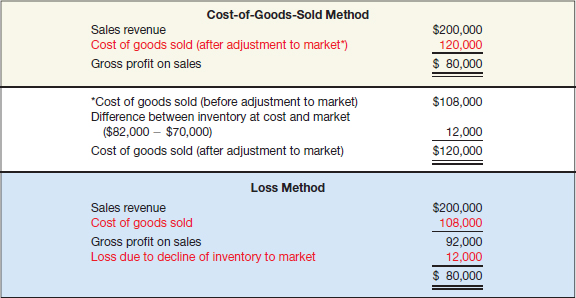
Illustration 9-8 contrasts the differing amounts reported in the income statement under the two approaches, using data from the Ricardo example.
ILLUSTRATION 9-8 Income Statement Presentation—Cost-of-Goods-Sold and Loss Methods of Reducing Inventory to Market
![]() Underlying Concepts
Underlying Concepts
The income statement under the cost-of-goods-sold method presentation lacks representational faithfulness. The cost-of-goods-sold method does not indicate what it purports to represent. However, allowing this presentation illustrates the concept of materiality.
GAAP does not specify a particular account to debit for the write-down. We believe the loss method presentation is preferable because it clearly discloses the loss resulting from a decline in inventory to market.
Use of an Allowance
Instead of crediting the Inventory account for market adjustments, companies generally use an allowance account, often referred to as Allowance to Reduce Inventory to Market. For example, using an allowance account under the loss method, Ricardo Company makes the following entry to record the inventory write-down to market.
![]()
Use of the allowance account results in reporting both the cost and the market of the inventory. Ricardo reports inventory in the balance sheet as follows.

The use of the allowance under the cost-of-goods-sold or loss method permits the balance sheet to reflect inventory measured at $82,000, although the balance sheet shows a net amount of $70,000. It also keeps subsidiary inventory ledgers and records in correspondence with the control account without changing prices. For homework purposes, use an allowance account to record market adjustments, unless instructed otherwise.
With respect to accounting for the allowance in the subsequent period, if the company still has on hand the merchandise in question, it should retain the allowance account. If it does not keep that account, the company will overstate beginning inventory and cost of goods. However, if the company has sold the goods, then it should close the account. It then establishes a “new allowance account” for any decline in inventory value that takes place in the current year.3
Use of an Allowance—Multiple Periods
![]() Underlying Concepts
Underlying Concepts
The inconsistency in the presentation of inventory is an example of the trade-off between relevance and faithful representation. Market is more relevant than cost, and cost is more representationally faithful than market. Apparently, relevance takes precedence in a down market, and faithful representation is more important in an up market.
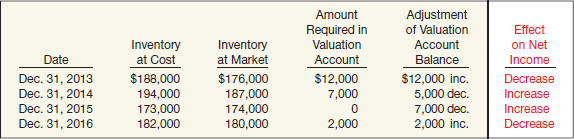
In general, accountants leave the allowance account on the books. They merely adjust the balance at the next year-end to agree with the discrepancy between cost and the lower-of-cost-or-market at that balance sheet date. Thus, if prices are falling, the company records an additional write-down. If prices are rising, the company records an increase in income, as shown in Illustration 9-10.
We can think of the net increase in income as the excess of the credit effect of closing the beginning allowance balance over the debit effect of setting up the current year-end allowance account. Recognizing the increases and decreases has the same effect on net income as closing the allowance balance to beginning inventory or to cost of goods sold.
What do the numbers mean? “PUT IT IN REVERSE”
The lower-of-cost-or-market rule is designed to provide timely information about the decline in the value of inventory. When the value of inventory declines, income takes a hit in the period of the write-down.
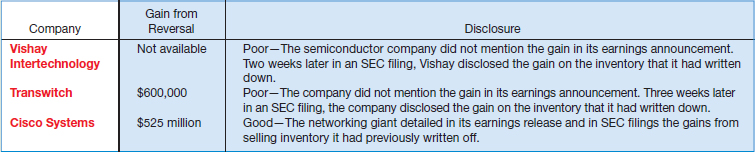
What happens in the periods after the write-down? For some companies, gross margins and bottom lines get a boost when they sell inventory that had been written down in a previous period. For example, as the table below shows, Vishay Intertechnology, Transwitch, and Cisco Systems reported gains from selling inventory that had previously been written down. The table also evaluates how clearly these companies disclosed the effects of the reversal of inventory write-downs.
For Transwitch, the reversal of fortunes amounted to 23 percent of net income. The problem is that the $600,000 credit had little to do with the company's ongoing operations, and the company did not do a good job disclosing the effect of the reversal on current-year profitability.
Even when companies do disclose a reversal, it is sometimes hard to determine the impact on income. For example, Intel disclosed that it had sold inventory that had been written down in prior periods but did not specify how much reserved inventory was sold.
Transparency of financial reporting should be a top priority. With better disclosure of the reversals that boost profits in the current period, financial transparency would also get a boost.
Source: S. E. Ante, “The Secret Behind Those Profit Jumps,” BusinessWeek Online (December 8, 2003).
Evaluation of the Lower-of-Cost-or-Market Rule
The lower-of-cost-or-market rule suffers some conceptual deficiencies:
- A company recognizes decreases in the value of the asset and the charge to expense in the period in which the loss in utility occurs—not in the period of sale. On the other hand, it recognizes increases in the value of the asset only at the point of sale. This inconsistent treatment can distort income data.
- Application of the rule results in inconsistency because a company may value the inventory at cost in one year and at market in the next year.
- Lower-of-cost-or-market values the inventory in the balance sheet conservatively, but its effect on the income statement may or may not be conservative. Net income for the year in which a company takes the loss is definitely lower. Net income of the subsequent period may be higher than normal if the expected reductions in sales price do not materialize.
- Application of the lower-of-cost-or-market rule uses a “normal profit” in determining inventory values. Since companies estimate “normal profit” based on past experience (which they may not attain in the future), this subjective measure presents an opportunity for income manipulation.
Many financial statement users appreciate the lower-of-cost-or-market rule because they at least know that it prevents overstatement of inventory. In addition, recognizing all losses but anticipating no gains generally avoids overstating income.
VALUATION BASES
Valuation at Net Realizable Value
LEARNING OBJECTIVE ![]()
Explain when companies value inventories at net realizable value.
For the most part, companies record inventory at cost or at the lower-of-cost-or-market.4 However, many believe that for purposes of applying the lower-of-cost-or-market rule, companies should define “market” as net realizable value (selling price less estimated costs to complete and sell) rather than as replacement cost. This argument is based on the fact that the amount that companies will collect from this inventory in the future is the net realizable value.5
Under limited circumstances, support exists for recording inventory at net realizable value, even if that amount is above cost. GAAP permits this exception to the normal recognition rule under the following conditions: (1) when there is a controlled market with a quoted price applicable to all quantities, and (2) when no significant costs of disposal are involved. For example, mining companies ordinarily report inventories of certain minerals (rare metals, especially) at selling prices because there is often a controlled market without significant costs of disposal. Similar treatment is given agricultural products that are immediately marketable at quoted prices.
![]() International Perspective
International Perspective
Similar to GAAP, certain agricultural products and mineral products can be reported at net realizable value using IFRS.
A third reason for allowing valuation at net realizable value is that sometimes it is too difficult to obtain the cost figures. Cost figures are not difficult to determine in, say, a manufacturing plant, where the company combines various raw materials and purchased parts to create a finished product. The manufacturer can use the cost basis to account for various items in inventory because it knows the cost of each individual component part. The situation is different in a meat-packing plant, however. The “raw material” consists of, say, cattle, each unit of which the company purchases as a whole and then divides into parts that are the products. Instead of one product out of many raw materials or parts, the meat-packing company makes many products from one “unit” of raw material. To allocate the cost of the animal “on the hoof” into the cost of, say, ribs, chuck, and shoulders, is a practical impossibility. It is much easier and more useful for the company to determine the market price of the various products and value them in the inventory at selling price less the various costs necessary to get them to market (costs such as shipping and handling). Hence, because of a peculiarity of the industry, meat-packing companies sometimes carry inventories at sales price less distribution costs.
Valuation Using Relative Sales Value
LEARNING OBJECTIVE ![]()
Explain when companies use the relative sales value method to value inventories.
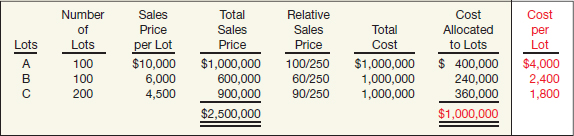
A special problem arises when a company buys a group of varying units in a single lump-sum purchase, also called a basket purchase. To illustrate, assume that Woodland Developers purchases land for $1 million that it will subdivide into 400 lots. These lots are of different sizes and shapes but can be roughly sorted into three groups graded A, B, and C. As Woodland sells the lots, it apportions the purchase cost of $1 million among the lots sold and the lots remaining on hand.
You might wonder why Woodland would not simply divide the total cost of $1 million by 400 lots, to get a cost of $2,500 for each lot. This approach would not recognize that the lots vary in size, shape, and attractiveness. Therefore, to accurately value each unit, the common and most logical practice is to allocate the total among the various units on the basis of their relative sales value.
Illustration 9-11 shows the allocation of relative sales value for the Woodland Developers example.
Woodland determines the cost of lots sold and the gross profit, using the amounts given in the “Cost per Lot” column, as follows.
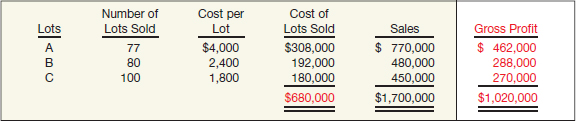
The ending inventory is therefore $320,000 ($1,000,000 − $680,000).
Woodland also can compute this inventory amount another way. The ratio of cost to selling price for all the lots is $1 million divided by $2,500,000, or 40 percent. Accordingly, if the total sales price of lots sold is, say $1,700,000, then the cost of the lots sold is 40 percent of $1,700,000, or $680,000. The inventory of lots on hand is then $1 million less $680,000, or $320,000.
The petroleum industry widely uses the relative sales value method to value (at cost) the many products and by-products obtained from a barrel of crude oil.
Purchase Commitments—A Special Problem
LEARNING OBJECTIVE ![]()
Discuss accounting issues related to purchase commitments.
In many lines of business, a company's survival and continued profitability depends on its having a sufficient stock of merchandise to meet customer demand. Consequently, it is quite common for a company to make purchase commitments, which are agreements to buy inventory weeks, months, or even years in advance. Generally, the seller retains title to the merchandise or materials covered in the purchase commitments. Indeed, the goods may exist only as natural resources as unplanted seed (in the case of agricultural commodities), or as work in process (in the case of a product).6
Usually, it is not necessary for the buyer to make any entries to reflect commitments for purchases of goods that the seller has not shipped. Ordinary orders, for which the buyer and seller will determine prices at the time of shipment and which are subject to cancellation, do not represent either an asset or a liability to the buyer. Therefore, the buyer need not record such purchase commitments or report them in the financial statements.
What happens, though, if a buyer enters into a formal, noncancelable purchase contract? Even then, the buyer recognizes no asset or liability at the date of inception, because the contract is “executory” in nature: Neither party has fulfilled its part of the contract. However, if material, the buyer should disclose such contract details in a note to its financial statements. Illustration 9-13 shows an example of a purchase commitment disclosure.
In the disclosure in Illustration 9-13, the contract price was less than the market price at the balance sheet date. If the contract price is greater than the market price and the buyer expects that losses will occur when the purchase is effected, the buyer should recognize losses in the period during which such declines in market prices take place. [4]7
As an example, at one time many Northwest forest-product companies such as Boise Cascade, Georgia-Pacific, and Weyerhaeuser signed long-term timber-cutting contracts with the U.S. Forest Service. These contracts required that the companies pay $310 per thousand board feet for timber-cutting rights. Unfortunately, the market price for timber-cutting rights in the latter part of the year dropped to $80 per thousand board feet. As a result, a number of these companies had long-term contracts that, if fulfilled, would result in substantial future losses.
![]() Underlying Concepts
Underlying Concepts
Reporting the loss is conservative. However, reporting the decline in market price is debatable because no asset is recorded. This area demonstrates the need for good definitions of assets and liabilities.
To illustrate the accounting problem, assume that St. Regis Paper Co. signed timber-cutting contracts to be executed in 2015 at a price of $10,000,000. Assume further that the market price of the timber cutting rights on December 31, 2014, dropped to $7,000,000. St. Regis would make the following entry on December 31, 2014.
![]()
St. Regis would report this unrealized holding loss in the income statement under “Other expenses and losses.” And because the contract is to be executed within the next fiscal year, St. Regis would report the Estimated Liability on Purchase Commitments in the current liabilities section on the balance sheet. When St. Regis cuts the timber at a cost of $10 million, it would make the following entry.
![]()
The result of the purchase commitment was that St. Regis paid $10 million for a contract worth only $7 million. It recorded the loss in the previous period—when the price actually declined.
If St. Regis can partially or fully recover the contract price before it cuts the timber, it reduces the Estimated Liability on Purchase Commitments. In that case, it then reports in the period of the price increase a resulting gain for the amount of the partial or full recovery. For example, Congress permitted some of the forest-products companies to buy out of their contracts at reduced prices in order to avoid potential bankruptcies. To illustrate, assume that Congress permitted St. Regis to reduce its contract price and therefore its commitment by $1,000,000. The entry to record this transaction is as follows.
![]()
If the market price at the time St. Regis cuts the timber is more than $2,000,000 below the contract price, St. Regis will have to recognize an additional loss in the period of cutting and record the purchase at the lower-of-cost-or-market.
Are purchasers at the mercy of market price declines? Not totally. Purchasers can protect themselves against the possibility of market price declines of goods under contract by hedging. In hedging, the purchaser in the purchase commitment simultaneously enters into a contract in which it agrees to sell in the future the same quantity of the same (or similar) goods at a fixed price. Thus the company holds a buy position in a purchase commitment and a sell position in a futures contract in the same commodity. The purpose of the hedge is to offset the price risk of the buy and sell positions. The company will be better off under one contract by approximately (maybe exactly) the same amount by which it is worse off under the other contract.
For example, St. Regis Paper Co. could have hedged its purchase commitment contract with a futures contract for timber rights of the same amount. In that case, its loss of $3,000,000 on the purchase commitment could have been offset by a $3,000,000 gain on the futures contract.8
As easy as this makes it sound, accounting for purchase commitments is still unsettled and controversial. Some argue that companies should report purchase commitments as assets and liabilities at the time they sign the contract. Others believe that the present recognition at the delivery date is more appropriate. FASB Concepts Statement No. 6 states, “a purchase commitment involves both an item that might be recorded as an asset and an item that might be recorded as a liability. That is, it involves both a right to receive assets and an obligation to pay…. If both the right to receive assets and the obligation to pay were recorded at the time of the purchase commitment, the nature of the loss and the valuation account that records it when the price falls would be clearly seen.” Although the discussion in Concepts Statement No. 6 does not exclude the possibility of recording assets and liabilities for purchase commitments, it contains no conclusions or implications about whether companies should record them.9
THE GROSS PROFIT METHOD OF ESTIMATING INVENTORY
LEARNING OBJECTIVE ![]()
Determine ending inventory by applying the gross profit method.
Companies take a physical inventory to verify the accuracy of the perpetual inventory records or, if no records exist, to arrive at an inventory amount. Sometimes, however, taking a physical inventory is impractical. In such cases, companies use substitute measures to approximate inventory on hand.
One substitute method of verifying or determining the inventory amount is the gross profit method (also called the gross margin method). Auditors widely use this method in situations where they need only an estimate of the company's inventory (e.g., interim reports). Companies also use this method when fire or other catastrophe destroys either inventory or inventory records. The gross profit method relies on three assumptions:
- The beginning inventory plus purchases equal total goods to be accounted for.
- Goods not sold must be on hand.
- The sales, reduced to cost, deducted from the sum of the opening inventory plus purchases, equal ending inventory.
To illustrate, assume that Cetus Corp. has a beginning inventory of $60,000 and purchases of $200,000, both at cost. Sales at selling price amount to $280,000. The gross profit on selling price is 30 percent.
Cetus applies the gross profit method as follows.
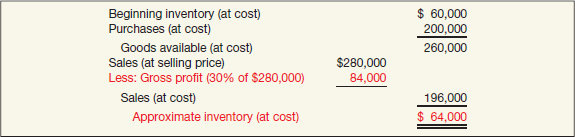
The current period's records contain all the information Cetus needs to compute inventory at cost, except for the gross profit percentage. Cetus determines the gross profit percentage by reviewing company policies or prior period records. In some cases, companies must adjust this percentage if they consider prior periods unrepresentative of the current period.10
Computation of Gross Profit Percentage
In most situations, the gross profit percentage is stated as a percentage of selling price. The previous illustration, for example, used a 30 percent gross profit on sales. Gross profit on selling price is the common method for quoting the profit for several reasons. (1) Most companies state goods on a retail basis, not a cost basis. (2) A profit quoted on selling price is lower than one based on cost. This lower rate gives a favorable impression to the consumer. (3) The gross profit based on selling price can never exceed 100 percent.11
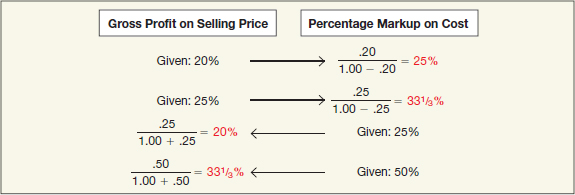
In Illustration 9-14, the gross profit was a given. But how did Cetus derive that figure? To see how to compute a gross profit percentage, assume that an article cost $15 and sells for $20, a gross profit of $5. As shown in the computations in Illustration 9-15, this markup is ¼ or 25 percent of retail, and ⅓ or, 33⅓ percent of cost.
Although companies normally compute the gross profit on the basis of selling price, you should understand the basic relationship between markup on cost and markup on selling price. For example, assume that a company marks up a given item by 25 percent. What, then, is the gross profit on selling price? To find the answer, assume that the item sells for $1. In this case, the following formula applies.
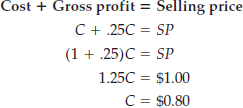
The gross profit equals $0.20 ($1.00 − $0.80). The rate of gross profit on selling price is therefore 20 percent ($0.20/$1.00).
Conversely, assume that the gross profit on selling price is 20 percent. What is the markup on cost? To find the answer, again assume that the item sells for $1. Again, the same formula holds:
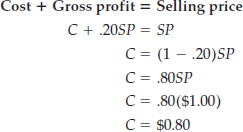
As in the previous example, the markup equals $0.20 ($1.00 − $0.80). The markup on cost is 25 percent ($0.20/$0.80).
Retailers use the following formulas to express these relationships:
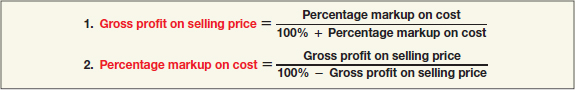
To understand how to use these formulas, consider their application in the following calculations.
Because selling price exceeds cost and with the gross profit amount the same for both, gross profit on selling price will always be less than the related percentage based on cost. Note that companies do not multiply sales by a cost-based markup percentage. Instead, they must convert the gross profit percentage to a percentage based on selling price.
Evaluation of Gross Profit Method
What are the major disadvantages of the gross profit method? One disadvantage is that it provides an estimate. As a result, companies must take a physical inventory once a year to verify the inventory. Second, the gross profit method uses past percentages in determining the markup. Although the past often provides answers to the future, a current rate is more appropriate. Note that whenever significant fluctuations occur, companies should adjust the percentage as appropriate. Third, companies must be careful in applying a blanket gross profit rate. Frequently, a store or department handles merchandise with widely varying rates of gross profit. In these situations, the company may need to apply the gross profit method by subsections, lines of merchandise, or a similar basis that classifies merchandise according to their respective rates of gross profit. The gross profit method is normally unacceptable for financial reporting purposes because it provides only an estimate. GAAP requires a physical inventory as additional verification of the inventory indicated in the records. Nevertheless, GAAP permits the gross profit method to determine ending inventory for interim (generally quarterly) reporting purposes, provided a company discloses the use of this method. Note that the gross profit method will follow closely the inventory method used (FIFO, LIFO, average-cost) because it relies on historical records.
What do the numbers mean? THE SQUEEZE
Managers and analysts closely follow gross profits. A small change in the gross profit rate can significantly affect the bottom line. At one time, Apple suffered a textbook case of shrinking gross profits. In response to pricing wars in the personal computer market, Apple had to quickly reduce the price of its signature Macintosh computers—reducing prices more quickly than it could reduce its costs. As a result, its gross profit rate fell from 44 percent to 40 percent in one year. Though the drop of 4 percent seems small, its impact on the bottom line caused Apple's stock price to drop from $57 per share to $27.50 per share in a two-month period (with a recent share price over $500, it would have been great to get into Apple stock at those lower prices!)
As another, more recent example, Nike—the largest global manufacturer of athletic footwear—in a recent quarter reported earnings that indicated falling gross profit, leading market analysts to adjust Nike's stock price downward. The cause—continuing downward pressure on its gross profit. On the positive side, an increase in the gross profit rate provides a positive signal to the market. For example, just a 1 percent boost in Dr. Pepper's gross profit rate cheered the market, indicating the company was able to avoid the squeeze of increased commodity costs by raising its prices.
Sources: Trefis, “Nike's Earnings Reiterate Gross Margin Pressure,” http://seekingalpha.com (March 23, 2011); and D. Kardous, “Higher Pricing Helps Boost Dr. Pepper Snapple's Net,” Wall Street Journal Online (June 5, 2008).
RETAIL INVENTORY METHOD
LEARNING OBJECTIVE ![]()
Determine ending inventory by applying the retail inventory method.
Accounting for inventory in a retail operation presents several challenges. Retailers with certain types of inventory may use the specific identification method to value their inventories. Such an approach makes sense when a retailer holds significant individual inventory units, such as automobiles, pianos, or fur coats. However, imagine attempting to use such an approach at Target, Home Depot, Sears Holdings, or Bloomingdale's—high-volume retailers that have many different types of merchandise. It would be extremely difficult to determine the cost of each sale, to enter cost codes on the tickets, to change the codes to reflect declines in value of the merchandise, to allocate costs such as transportation, and so on.
An alternative is to compile the inventories at retail prices. For most retailers, an observable pattern between cost and price exists. The retailer can then use a formula to convert retail prices to cost. This method is called the retail inventory method. It requires that the retailer keep a record of (1) the total cost and retail value of goods purchased, (2) the total cost and retail value of the goods available for sale, and (3) the sales for the period. Use of the retail inventory method is very common. For example, Safeway supermarkets, Target, Wal-Mart, and Best Buy use the retail inventory method.
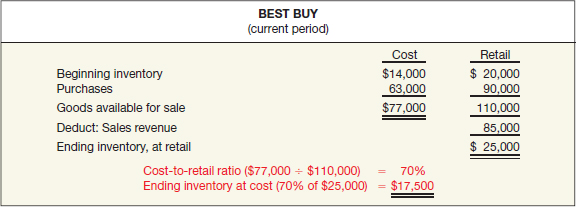
Here is how it works at a company like Best Buy. Beginning with the retail value of the goods available for sale, Best Buy deducts the sales revenue for the period. This calculation determines an estimated inventory (goods on hand) at retail. It next computes the cost-to-retail ratio for all goods. The formula for this computation is to divide the total goods available for sale at cost by the total goods available at retail price. Finally, to obtain ending inventory at cost, Best Buy applies the cost-to-retail ratio to the ending inventory valued at retail. Illustration 9-18 shows the retail inventory method calculations for Best Buy (assumed data).
There are different versions of the retail inventory method. These include the conventional method (based on lower-of-average-cost-or-market), the cost method, the LIFO retail method, and the dollar-value LIFO retail method. Regardless of which version a company uses, the IRS, various retail associations, and the accounting profession all sanction use of the retail inventory method. One of its advantages is that a company like Best Buy can approximate the inventory balance without a physical count. However, to avoid a potential overstatement of the inventory, Target makes periodic inventory counts. Such counts are especially important in retail operations where loss due to shoplifting or breakage is common.
The retail inventory method is particularly useful for any type of interim report because such reports usually need a fairly quick and reliable measure of the inventory. Also, similar to use of the gross profit method, insurance adjusters often use this method to estimate losses from fire, flood, or other type of casualty. This method also acts as a control device because a company will have to explain any deviations from a physical count at the end of the year. Finally, the retail method expedites the physical inventory count at the end of the year. The crew taking the physical inventory need record only the retail price of each item. The crew does not need to look up each item's invoice cost, thereby saving time and expense.
Retail-Method Concepts
The amounts shown in the “Retail” column of Illustration 9-18 above represent the original retail prices, assuming no price changes. In practice, though, retailers frequently mark up or mark down the prices they charge buyers.
For retailers, the term markup means an additional markup of the original retail price. (In another context, such as the gross profit discussion on pages 485–488, we often think of markup on the basis of cost.) Markup cancellations are decreases in prices of merchandise that the retailer had marked up above the original retail price.
In a competitive market, retailers often need to use markdowns, which are decreases in the original sales prices. Such cuts in sales prices may be necessary because of a decrease in the general level of prices, special sales, soiled or damaged goods, overstocking, and market competition. Markdowns are common in retailing these days. Markdown cancellations occur when the markdowns are later offset by increases in the prices of goods that the retailer had marked down—such as after a one-day sale, for example. Neither a markup cancellation nor a markdown cancellation can exceed the original markup or markdown.
To illustrate these concepts, assume that Designer Clothing Store recently purchased 100 dress shirts from Marroway, Inc. The cost for these shirts was $1,500, or $15 a shirt. Designer Clothing established the selling price on these shirts at $30 a shirt. The shirts were selling quickly in anticipation of Father's Day, so the manager added a markup of $5 per shirt. This markup made the price too high for customers, and sales slowed. The manager then reduced the price to $32. At this point we would say that the shirts at Designer Clothing have had a markup of $5 and a markup cancellation of $3.
Right after Father's Day, the manager marked down the remaining shirts to a sale price of $23. At this point, an additional markup cancellation of $2 has taken place, and a $7 markdown has occurred. If the manager later increases the price of the shirts to $24, a markdown cancellation of $1 would occur.
Retail Inventory Method with Markups and Markdowns—Conventional Method
Retailers use markup and markdown concepts in developing the proper inventory valuation at the end of the accounting period. To obtain the appropriate inventory figures, companies must give proper treatment to markups, markup cancellations, markdowns, and markdown cancellations.
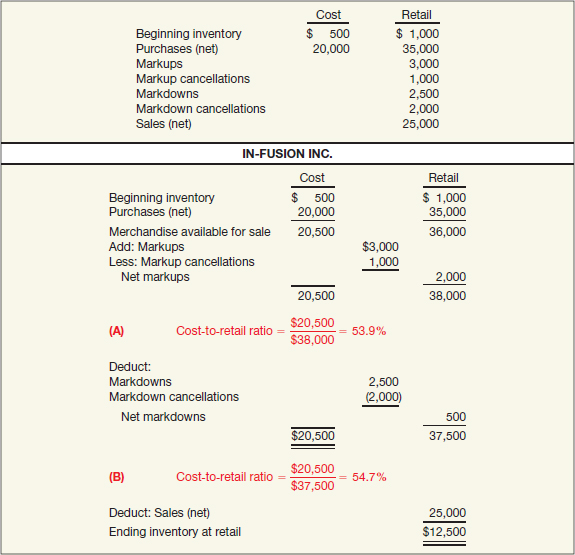
To illustrate the different possibilities, consider the data for In-Fusion Inc., shown in Illustration 9-19. In-Fusion can calculate its ending inventory at cost under two assumptions, A and B. (We'll explain the reasons for the two later.)
Assumption A: Computes a cost ratio after markups (and markup cancellations) but before markdowns.
Assumption B: Computes a cost ratio after both markups and markdowns (and cancellations).
The computations for In-Fusion are:
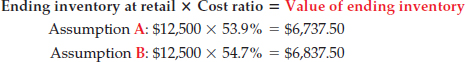
The question becomes: Which assumption and which percentage should In-Fusion use to compute the ending inventory valuation? The answer depends on which retail inventory method In-Fusion chooses.
One approach uses only assumption A (a cost ratio using markups but not markdowns). It approximates the lower-of-average-cost-or-market. We will refer to this approach as the conventional retail inventory method or the lower-of-cost-or-market approach.
To understand why this method considers only the markups, not the markdowns, in the cost percentage, you must understand how a retail business operates. A markup normally indicates an increase in the market value of the item. On the other hand, a markdown means a decline in the utility of that item. Therefore, to approximate the lower-of-cost-or-market, we would consider markdowns a current loss and so would not include them in calculating the cost-to-retail ratio. Omitting the markdowns would make the cost-to-retail ratio lower, which leads to an approximate lower-of-cost-or-market.
An example will make the distinction between the two methods clear. In-Fusion purchased two items for $5 apiece; the original sales price was $10 each. One item was subsequently written down to $2. Assuming no sales for the period, if markdowns are considered in the cost-to-retail ratio (assumption B—the cost method), we compute the ending inventory in the following way.
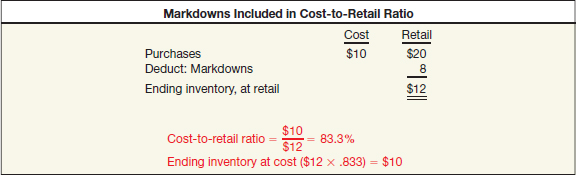
This approach (the cost method) reflects an average cost of the two items of the commodity without considering the loss on the one item. It values ending inventory at $10.
If markdowns are not considered in the cost-to-retail ratio (assumption A—the conventional retail method), we compute the ending inventory as follows.
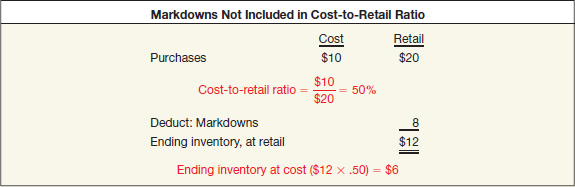
Under this approach (the conventional retail method, in which markdowns are not considered), ending inventory would be $6. The inventory valuation of $6 reflects two inventory items, one inventoried at $5 and the other at $1. It reflects the fact that In-Fusion reduced the sales price from $10 to $2, and reduced the cost from $5 to $1.12
To approximate the lower-of-cost-or-market, In-Fusion must establish the cost-to-retail ratio. It does this by dividing the cost of goods available for sale by the sum of the original retail price of these goods plus the net markups. This calculation excludes markdowns and markdown cancellations. Illustration 9-22 shows the basic format for the retail inventory method using the lower-of-cost-or-market approach along with the In-Fusion Inc. information.
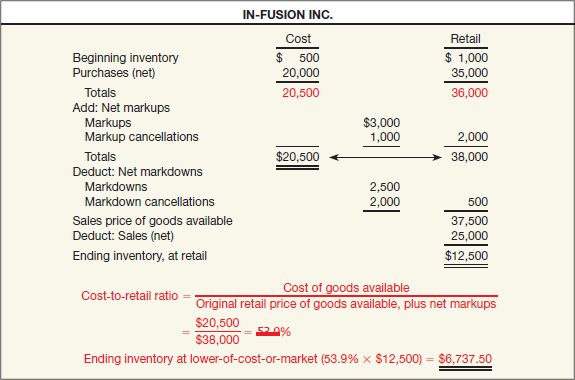
Because an averaging effect occurs, an exact lower-of-cost-or-market inventory valuation is ordinarily not obtained, but an adequate approximation can be achieved. In contrast, adding net markups and deducting net markdowns yields approximate cost.
Special Items Relating to Retail Method
The retail inventory method becomes more complicated when we consider such items as freight-in, purchase returns and allowances, and purchase discounts. In the retail method, we treat such items as follows.
- Freight costs are part of the purchase cost.
- Purchase returns are ordinarily considered as a reduction of the price at both cost and retail.
- Purchase discounts and allowances usually are considered as a reduction of the cost of purchases.
In short, the treatment for the items affecting the cost column of the retail inventory approach follows the computation for cost of goods available for sale.13
Note also that sales returns and allowances are considered as proper adjustments to gross sales. However, when sales are recorded gross, companies do not recognize sales discounts. To adjust for the sales discount account in such a situation would provide an ending inventory figure at retail that would be overvalued.
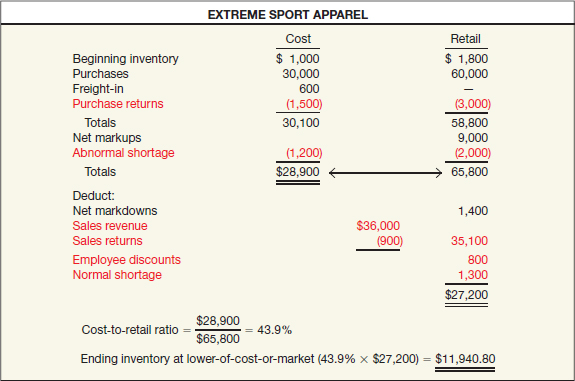
In addition, a number of special items require careful analysis:
- Transfers-in from another department are reported in the same way as purchases from an outside company.
- Normal shortages (breakage, damage, theft, shrinkage) should reduce the retail column because these goods are no longer available for sale. Such costs are reflected in the selling price because a certain amount of shortage is considered normal in a retail enterprise. As a result, companies do not consider this amount in computing the cost-to-retail percentage. Rather, to arrive at ending inventory at retail, they show normal shortages as a deduction similar to sales.
- Abnormal shortages, on the other hand, are deducted from both the cost and retail columns and reported as a special inventory amount or as a loss. To do otherwise distorts the cost-to-retail ratio and overstates ending inventory.
- Employee discounts (given to employees to encourage loyalty, better performance, and so on) are deducted from the retail column in the same way as sales. These discounts should not be considered in the cost-to-retail percentage because they do not reflect an overall change in the selling price.14
Illustration 9-23 (page 494) shows some of these concepts. The company, Extreme Sport Apparel, determines its inventory using the conventional retail inventory method.
Evaluation of Retail Inventory Method
Companies like Gap Inc., Home Depot, or your local department store use the retail inventory method of computing inventory for the following reasons: (1) to permit the computation of net income without a physical count of inventory, (2) as a control measure in determining inventory shortages, (3) in regulating quantities of merchandise on hand, and (4) for insurance information.
One characteristic of the retail inventory method is that it has an averaging effect on varying rates of gross profit. This can be problematic when companies apply the method to an entire business, where rates of gross profit vary among departments. There is no allowance for possible distortion of results because of such differences. Companies refine the retail method under such conditions by computing inventory separately by departments or by classes of merchandise with similar gross profits. In addition, the reliability of this method assumes that the distribution of items in inventory is similar to the “mix” in the total goods available for sale.
PRESENTATION AND ANALYSIS
Presentation of Inventories
LEARNING OBJECTIVE ![]()
Explain how to report and analyze inventory.
Accounting standards require financial statement disclosure of the composition of the inventory, inventory financing arrangements, and the inventory costing methods employed. The standards also require the consistent application of costing methods from one period to another.
Manufacturers should report the inventory composition either in the balance sheet or in a separate schedule in the notes. The relative mix of raw materials, work in process, and finished goods helps in assessing liquidity and in computing the stage of inventory completion.
Significant or unusual financing arrangements relating to inventories may require note disclosure. Examples include transactions with related parties, product financing arrangements, firm purchase commitments, involuntary liquidation of LIFO inventories, and pledging of inventories as collateral. Companies should present inventories pledged as collateral for a loan in the current assets section rather than as an offset to the liability.
A company should also report the basis on which it states inventory amounts (lower-of-cost-or-market) and the method used in determining cost (LIFO, FIFO, average-cost, etc.). For example, the annual report of Mumford of Wyoming contains the following disclosures.
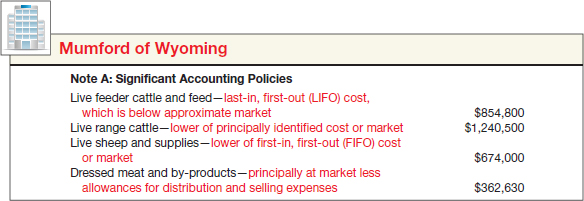
Illustration 9-24 shows that a company can use different pricing methods for different elements of its inventory. If Mumford changes the method of pricing any of its inventory elements, it must report a change in accounting principle. For example, if Mumford changes its method of accounting for live sheep from FIFO to average-cost, it should separately report this change, along with the effect on income, in the current and prior periods. Changes in accounting principle require an explanatory paragraph in the auditor's report describing the change in method.
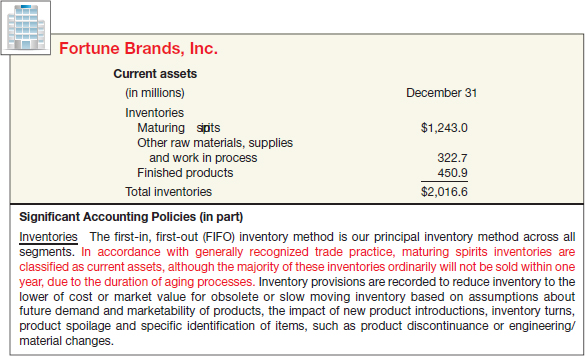
Fortune Brands, Inc. reported its inventories in its annual report as follows (note the “trade practice” followed in classifying inventories among the current assets).
Analysis of Inventories
As our opening story illustrates, the amount of inventory that a company carries can have significant economic consequences. As a result, companies must manage inventories. But, inventory management is a double-edged sword. It requires constant attention. On the one hand, management wants to stock a great variety and quantity of items. Doing so will provide customers with the greatest selection. However, such an inventory policy may incur excessive carrying costs (e.g., investment, storage, insurance, taxes, obsolescence, and damage). On the other hand, low inventory levels lead to stockouts, lost sales, and disgruntled customers.
Using financial ratios helps companies to chart a middle course between these two dangers. Common ratios used in the management and evaluation of inventory levels are inventory turnover and a related measure, average days to sell inventory.
Inventory Turnover
The inventory turnover measures the number of times on average a company sells the inventory during the period. It measures the liquidity of the inventory. To compute inventory turnover, divide the cost of goods sold by the average inventory on hand during the period.
Barring seasonal factors, analysts compute average inventory from beginning and ending inventory balances. For example, in its 2011 annual report Kellogg Company reported a beginning inventory of $1,056 million, an ending inventory of $1,132 million, and cost of goods sold of $7,750 million for the year. Illustration 9-26 shows the inventory turnover formula and Kellogg Company's 2011 ratio computation below.

Average Days to Sell Inventory
![]() You will want to read the IFRS INSIGHTS on pages 525–534 for discussion of IFRS related to inventories.
You will want to read the IFRS INSIGHTS on pages 525–534 for discussion of IFRS related to inventories.
A variant of the inventory turnover is the average days to sell inventory. This measure represents the average number of days’ sales for which a company has inventory on hand. For example, the inventory turnover for Kellogg Company of 7.08 times divided into 365 is approximately 51.6 days.
There are typical levels of inventory in every industry. However, companies that keep their inventory at lower levels with higher turnovers than those of their competitors, and that still can satisfy customer needs, are the most successful.
KEY TERMS
average days to sell inventory, 496
conventional retail inventory method, 490
cost-of-goods-sold method, 478
cost-to-retail ratio, 489
designated market value, 476
gross profit method, 485
gross profit percentage, 486
hedging, 485
inventory turnover, 496
loss method, 478
lower limit (floor), 475
lower-of-cost-or-market (LCM), 475
lump-sum (basket) purchase, 482
markdown, 490
markdown cancellations, 490
market (for LCM), 474
markup, 489
markup cancellations, 489
net realizable value (NRV), 475
net realizable value less a normal profit margin, 475
purchase commitments, 483
retail inventory method, 488
upper limit (ceiling), 475
SUMMARY OF LEARNING OBJECTIVES
![]() Describe and apply the lower-of-cost-or-market rule. If inventory declines in value below its original cost, for whatever reason, a company should write down the inventory to reflect this loss. The general rule is to abandon the historical cost principle when the future utility (revenue-producing ability) of the asset drops below its original cost.
Describe and apply the lower-of-cost-or-market rule. If inventory declines in value below its original cost, for whatever reason, a company should write down the inventory to reflect this loss. The general rule is to abandon the historical cost principle when the future utility (revenue-producing ability) of the asset drops below its original cost.
![]() Explain when companies value inventories at net realizable value. Companies value inventory at net realizable value when (1) there is a controlled market with a quoted price applicable to all quantities, (2) no significant costs of disposal are involved, and (3) the cost figures are too difficult to obtain.
Explain when companies value inventories at net realizable value. Companies value inventory at net realizable value when (1) there is a controlled market with a quoted price applicable to all quantities, (2) no significant costs of disposal are involved, and (3) the cost figures are too difficult to obtain.
![]() Explain when companies use the relative sales value method to value inventories. When a company purchases a group of varying units at a single lump-sum price—a so-called basket purchase—the company may allocate the total purchase price to the individual items on the basis of relative sales value.
Explain when companies use the relative sales value method to value inventories. When a company purchases a group of varying units at a single lump-sum price—a so-called basket purchase—the company may allocate the total purchase price to the individual items on the basis of relative sales value.
![]() Discuss accounting issues related to purchase commitments. Accounting for purchase commitments is controversial. Some argue that companies should report purchase commitment contracts as assets and liabilities at the time the contract is signed. Others believe that recognition at the delivery date is most appropriate. The FASB neither excludes nor recommends the recording of assets and liabilities for purchase commitments. However, companies record losses when market prices fall relative to the commitment price.
Discuss accounting issues related to purchase commitments. Accounting for purchase commitments is controversial. Some argue that companies should report purchase commitment contracts as assets and liabilities at the time the contract is signed. Others believe that recognition at the delivery date is most appropriate. The FASB neither excludes nor recommends the recording of assets and liabilities for purchase commitments. However, companies record losses when market prices fall relative to the commitment price.
![]() Determine ending inventory by applying the gross profit method. Companies follow these steps to determine ending inventory by the gross profit method. (1) Compute the gross profit percentage on selling price. (2) Compute gross profit by multiplying net sales by the gross profit percentage. (3) Compute cost of goods sold by subtracting gross profit from net sales. (4) Compute ending inventory by subtracting cost of goods sold from total goods available for sale.
Determine ending inventory by applying the gross profit method. Companies follow these steps to determine ending inventory by the gross profit method. (1) Compute the gross profit percentage on selling price. (2) Compute gross profit by multiplying net sales by the gross profit percentage. (3) Compute cost of goods sold by subtracting gross profit from net sales. (4) Compute ending inventory by subtracting cost of goods sold from total goods available for sale.
![]() Determine ending inventory by applying the retail inventory method. Companies follow these steps to determine ending inventory by the conventional retail method. (1) To estimate inventory at retail, deduct the sales for the period from the retail value of the goods available for sale. (2) To find the cost-to-retail ratio for all goods passing through a department or firm, divide the total goods available for sale at cost by the total goods available at retail. (3) Convert the inventory valued at retail to approximate cost by applying the cost-to-retail ratio.
Determine ending inventory by applying the retail inventory method. Companies follow these steps to determine ending inventory by the conventional retail method. (1) To estimate inventory at retail, deduct the sales for the period from the retail value of the goods available for sale. (2) To find the cost-to-retail ratio for all goods passing through a department or firm, divide the total goods available for sale at cost by the total goods available at retail. (3) Convert the inventory valued at retail to approximate cost by applying the cost-to-retail ratio.
![]() Explain how to report and analyze inventory. Accounting standards require financial statement disclosure of (1) the composition of the inventory (in the balance sheet or a separate schedule in the notes), (2) significant or unusual inventory financing arrangements, and (3) inventory costing methods employed (which may differ for different elements of inventory). Accounting standards also require the consistent application of costing methods from one period to another. Common ratios used in the management and evaluation of inventory levels are inventory turnover and average days to sell inventory.
Explain how to report and analyze inventory. Accounting standards require financial statement disclosure of (1) the composition of the inventory (in the balance sheet or a separate schedule in the notes), (2) significant or unusual inventory financing arrangements, and (3) inventory costing methods employed (which may differ for different elements of inventory). Accounting standards also require the consistent application of costing methods from one period to another. Common ratios used in the management and evaluation of inventory levels are inventory turnover and average days to sell inventory.
APPENDIX 9A LIFO RETAIL METHODS
LEARNING OBJECTIVE ![]()
Determine ending inventory by applying the LIFO retail methods.
A number of retail establishments have changed from the more conventional treatment to a LIFO retail method. For example, the world's largest retailer, Wal-Mart Stores, Inc., uses the LIFO retail method. The primary reason to do so is for the tax advantages associated with valuing inventories on a LIFO basis. In addition, adoption of LIFO results in a better matching of costs and revenues.
The use of LIFO retail is made under two assumptions: (1) stable prices and (2) fluctuating prices.
STABLE PRICES—LIFO RETAIL METHOD
It is much more complex to compute the final inventory balance using a LIFO flow than using the conventional retail method. Under the LIFO retail method, companies like Wal-Mart or Target consider both markups and markdowns in obtaining the proper cost-to-retail percentage. Furthermore, since the LIFO method is concerned only with the additional layer, or the amount that should be subtracted from the previous layer, the beginning inventory is excluded from the cost-to-retail percentage.
A major assumption of the LIFO retail method is that the markups and markdowns apply only to the goods purchased during the current period and not to the beginning inventory. This assumption is debatable and may explain why some companies do not adopt this method.
Illustration 9A-1 presents the major concepts involved in the LIFO retail method applied to the Hernandez Company. Note that, to simplify the accounting, we have assumed that the price level has remained unchanged.
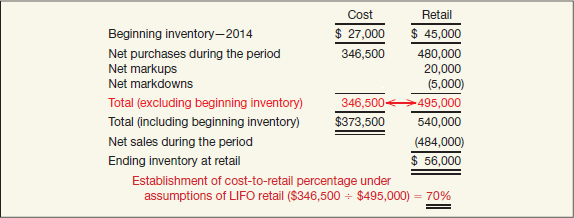
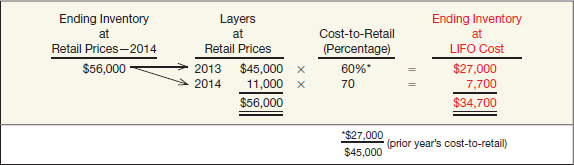
Illustration 9A-2 indicates that the inventory is composed of two layers: the beginning inventory and the additional increase that occurred in the inventory this period (2014). When we start the next period (2015), the beginning inventory will be composed of those two layers. If an increase in inventory occurs again, an additional layer will be added.
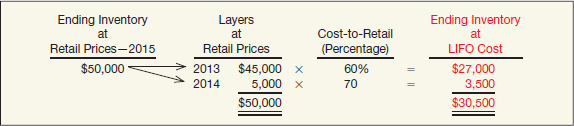
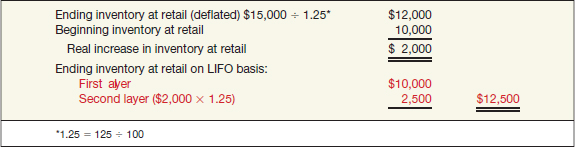
However, if the final inventory figure is below the beginning inventory, Hernandez must reduce the beginning inventory starting with the most recent layer. For example, assume that the ending inventory for 2015 at retail is $50,000. Illustration 9A-3 shows the computation of the ending inventory at cost. Notice that the 2014 layer is reduced from $11,000 to $5,000.
FLUCTUATING PRICES—DOLLAR-VALUE LIFO RETAIL METHOD
The previous example simplified the LIFO retail method by ignoring changes in the selling price of the inventory. Let us now assume that a change in the price level of the inventories occurs (as is usual). If the price level does change, the company must eliminate the price change so as to measure the real increase in inventory, not the dollar increase. This approach is referred to as the dollar-value LIFO retail method.
To illustrate, assume that the beginning inventory had a retail market value of $10,000 and the ending inventory had a retail market value of $15,000. Assume further that the price level has risen from 100 to 125. It is inappropriate to suggest that a real increase in inventory of $5,000 has occurred. Instead, the company must deflate the ending inventory at retail, as the computation in Illustration 9A-4 shows.
This approach is essentially the dollar-value LIFO method discussed in Chapter 8. In computing the LIFO inventory under a dollar-value LIFO approach, the company finds the dollar increase in inventory and deflates it to beginning-of-the-year prices. This indicates whether actual increases or decreases in quantity have occurred. If an increase in quantities occurs, the company prices this increase at the new index, in order to compute the value of the new layer. If a decrease in quantities happens, the company subtracts the increase from the most recent layers to the extent necessary.
The following computations, based on those in Illustration 9A-1 for Hernandez Company, illustrate the differences between the dollar-value LIFO retail method and the regular LIFO retail approach. Assume that the current 2014 price index is 112 (prior year = 100) and that the inventory ($56,000) has remained unchanged. In comparing Illustrations 9A-1 and 9A-5 (see below), note that the computations involved in finding the cost-to-retail percentage are exactly the same. However, the dollar-value method determines the increase that has occurred in the inventory in terms of base-year prices.
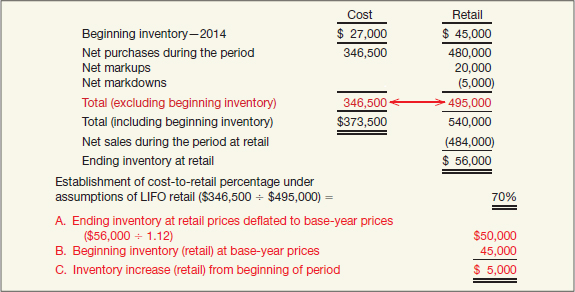
From this information, we compute the inventory amount at cost:
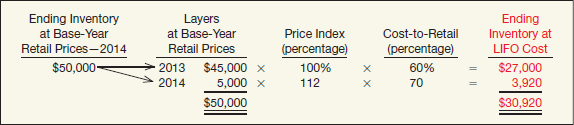
As Illustration 9A-6 shows, before the conversion to cost takes place, Hernandez must restate layers of a particular year to the prices in effect in the year when the layer was added.
Note the difference between the LIFO approach (stable prices) and the dollar-value LIFO method as indicated below.
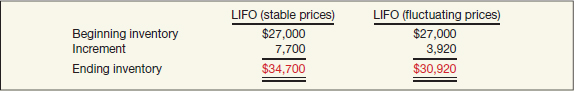
The difference of $3,780 ($34,700 − $30,920) results from an increase in the price of goods, not from an increase in the quantity of goods.
SUBSEQUENT ADJUSTMENTS UNDER DOLLAR-VALUE LIFO RETAIL
The dollar-value LIFO retail method follows the same procedures in subsequent periods as the traditional dollar-value method discussed in Chapter 8. That is, when a real increase in inventory occurs, Hernandez adds a new layer.
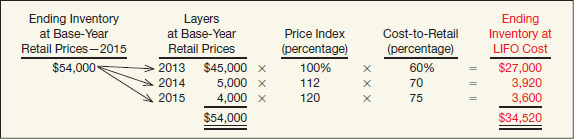
To illustrate, using the data from the previous example, assume that the retail value of the 2015 ending inventory at current prices is $64,800, the 2015 price index is 120 percent of base-year, and the cost-to-retail percentage is 75 percent. In base-year dollars, the ending inventory is therefore $54,000 ($64,800/120%). Illustration 9A-8 shows the computation of the ending inventory at LIFO cost.
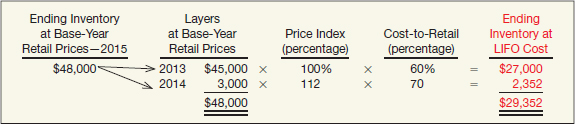
Conversely, when a real decrease in inventory develops, Hernandez “peels off” previous layers at prices in existence when the layers were added. To illustrate, assume that in 2015 the ending inventory in base-year prices is $48,000. The computation of the LIFO inventory is as follows.
The advantages and disadvantages of the lower-of-cost-or-market method (conventional retail) versus LIFO retail are the same for retail operations as for non-retail operations. As a practical matter, a company's selection of which retail inventory method to use often involves determining which method provides a lower taxable income. It might appear that retail LIFO will provide the lower taxable income in a period of rising prices. But this is not always the case. LIFO will provide an approximate current cost matching, but it states ending inventory at cost. The conventional retail method may have a large write-off because of the use of the lower-of-cost-or-market approach, which may offset the LIFO current cost matching.
CHANGING FROM CONVENTIONAL RETAIL TO LIFO
Because conventional retail is a lower-of-cost-or-market approach, the company must restate beginning inventory to a cost basis when changing from the conventional retail to the LIFO method.15 The usual approach is to compute the cost basis from the purchases of the prior year, adjusted for both markups and markdowns.16
To illustrate, assume that Hakeman Clothing Store employs the conventional retail method but wishes to change to the LIFO retail method beginning in 2015. The amounts shown on the company's books are as follows.

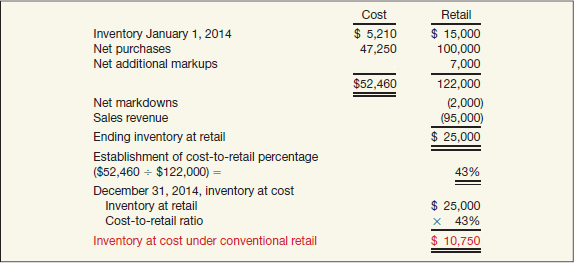
Illustration 9A-10 (page 502) shows computation of ending inventory under the conventional retail method for 2014.
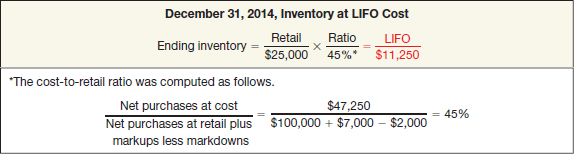
Hakeman Clothing can then quickly approximate the ending inventory for 2014 under the LIFO retail method, as shown in Illustration 9A-11.
The difference of $500 ($11,250 − $10,750) between the LIFO retail method and the conventional retail method in the ending inventory for 2014 is the amount by which the company must adjust beginning inventory for 2015. The entry to adjust the inventory to a cost basis is as follows.
![]()
KEY TERMS
dollar-value LIFO retail method, 499
LIFO retail method, 497
SUMMARY OF LEARNING OBJECTIVE FOR APPENDIX 9A
![]() Determine ending inventory by applying the LIFO retail methods. The application of LIFO retail is made under two assumptions: stable prices and fluctuating prices.
Determine ending inventory by applying the LIFO retail methods. The application of LIFO retail is made under two assumptions: stable prices and fluctuating prices.
Procedures under stable prices: (a) Because the LIFO method is a cost method, both markups and markdowns must be considered in obtaining the proper cost-to-retail percentage. (b) Since the LIFO method is concerned only with the additional layer, or the amount that should be subtracted from the previous layer, the beginning inventory is excluded from the cost-to-retail percentage. (c) The markups and markdowns apply only to the goods purchased during the current period and not to the beginning inventory.
Procedures under fluctuating prices: The steps are the same as for stable prices except that in computing the LIFO inventory under a dollar-value LIFO approach, the dollar increase in inventory is found and deflated to beginning-of-the-year prices. Doing so will determine whether actual increases or decreases in quantity have occurred. If quantities increase, this increase is priced at the new index to compute the new layer. If quantities decrease, the decrease is subtracted from the most recent layers to the extent necessary.
DEMONSTRATION PROBLEM
Norwood Company makes miniature circuit boards that are components of wireless phones and personal organizers. The company has experienced strong growth, and you are especially interested in how well Norwood is managing its inventory balances. You have collected the following information for the current year.
![]()
The company values inventory at lower-of-cost (using LIFO cost flow assumption)-or-market.
Instructions
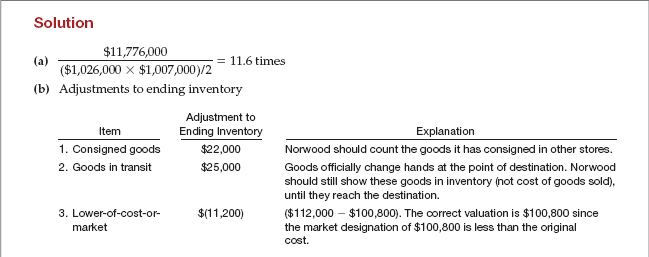
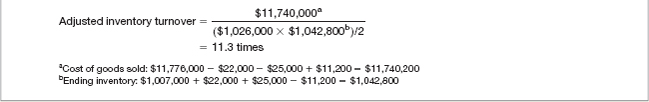
(a) Compute Norwood's inventory turnover before any adjustment.
(b) Recompute the inventory turnover after adjusting Norwood's inventory information for the following items.
- During the year, Norwood recorded sales and costs of goods sold on $22,000 of units shipped to various wholesalers on consignment. At year-end, none of these units have been sold by wholesalers.
- Shipping contracts changed 2 months ago from f.o.b. shipping point to f.o.b. destination point. At the end of the year, $25,000 of products are en route to China and will not arrive until after financial statements are released. Current inventory balances do not reflect this change in policy.
- At the end of the year, Norwood determined that a certain section of inventory with an historical cost of $112,000 has a replacement cost of $100,800, net realizable value of $101,000 and net realizable value less a normal profit margin of $90,400. There is no need to make a lower-of-cost-or-market adjustment to other inventory.
 FASB CODIFICATION
FASB Codification References
[1] FASB ASC 330-10-35. [Predecessor literature: “Restatement and Revision of Accounting Research Bulletins,” Accounting Research Bulletin No. 43 (New York: AICPA, 1953), Ch. 4, par. 8.]
[2] FASB ASC 330-10-S99-3. [Predecessor literature: “AICPA Task Force on LIFO Inventory Problems,” Issues Paper (New York: AICPA, November 30, 1984), pp. 50–55.]
[3] FASB ASC 330-10-35. [Predecessor literature: “Restatement and Revision of Accounting Research Bulletins,” Accounting Research Bulletin No. 43 (New York: AICPA, 1953), Ch. 4.]
[4] FASB ASC 330-10-35-16 through 18. [Predecessor literature: “Restatement and Revision of Accounting Research Bulletins,” Accounting Research Bulletin No. 43 (New York: AICPA, 1953), Ch. 4, par. 16.]
Exercises
If your school has a subscription to the FASB Codification, go to http://aaahq.org/asclogin.cfm to log in and prepare responses to the following. Provide Codification references for your responses.
| CE9-1 | Access the glossary (“Master Glossary”) to answer the following.
(a) What is the definition of inventory? (b) What is the definition of market as it relates to inventory? (c) What is the definition of net realizable value? |
| CE9-2 | Based on increased competition for one of its key products, Tutaj Company is concerned that it will not be able to sell its products at a price that would cover its costs. Since the company is already having a bad year, the sales manager proposes writing down the inventory to the lowest level possible, so that all the bad news will be in the current year. Explain to the sales manager the rationale for lower-of-cost-or-market adjustments, according to GAAP. |
| CE9-3 | What are the provisions for subsequent measurement of inventory in the context of a hedging transaction? |
| CE9-4 | What is the nature of the SEC guidance concerning inventory disclosures? |
An additional Codification case can be found in the Using Your Judgment section, on page 525.
Be sure to check the book's companion website for a Review and Analysis Exercise, with solution.
![]() Brief Exercises, Exercises, Problems, and many more learning and assessment tools and resources are available for practice in WileyPLUS.
Brief Exercises, Exercises, Problems, and many more learning and assessment tools and resources are available for practice in WileyPLUS.
Note: All asterisked Questions, Exercises, and Problems relate to material in the appendix to the chapter.
QUESTIONS
- Where there is evidence that the utility of inventory goods, as part of their disposal in the ordinary course of business, will be less than cost, what is the proper accounting treatment?
- Explain the rationale for the ceiling and floor in the lower-of-cost-or-market method of valuing inventories.
- Why are inventories valued at the lower-of-cost-or-market? What are the arguments against the use of the LCM method of valuing inventories?
- What approaches may be employed in applying the lower-of-cost-or-market procedure? Which approach is normally used and why?
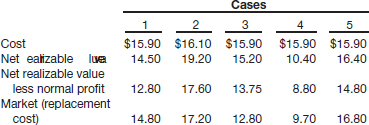
- In some instances, accounting principles require a departure from valuing inventories at cost alone. Determine the proper unit inventory price in the following cases.
- What method(s) might be used in the accounts to record a loss due to a price decline in the inventories? Discuss.
- What factors might call for inventory valuation at sales prices (net realizable value or market price)?
- Under what circumstances is relative sales value an appropriate basis for determining the price assigned to inventory?
- At December 31, 2014, Ashley Co. has outstanding purchase commitments for 150,000 gallons, at $6.20 per gallon, of a raw material to be used in its manufacturing process. The company prices its raw material inventory at cost or market, whichever is lower. Assuming that the market price as of December 31, 2014, is $5.90, how would you treat this situation in the accounts?
- What are the major uses of the gross profit method?
- Distinguish between gross profit as a percentage of cost and gross profit as a percentage of sales price. Convert the following gross profit percentages based on cost to gross profit percentages based on sales price: 25% and 33⅓%. Convert the following gross profit percentages based on sales price to gross profit percentages based on cost: 33⅓% and 60%.
- Adriana Co., with annual net sales of $5 million, maintains a markup of 25% based on cost. Adriana's expenses average 15% of net sales. What is Adriana's gross profit and net profit in dollars?
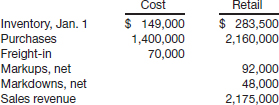
- A fire destroys all of the merchandise of Assante Company on February 10, 2014. Presented below is information compiled up to the date of the fire.
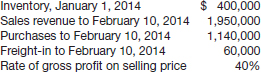
What is the approximate inventory on February 10, 2014?
- What conditions must exist for the retail inventory method to provide valid results?
- The conventional retail inventory method yields results that are essentially the same as those yielded by the lower-of-cost-or-market method. Explain. Prepare an illustration of how the retail inventory method reduces inventory to market.
(a) Determine the ending inventory under the conventional retail method for the furniture department of Mayron Department Stores from the following data.
(b) If the results of a physical inventory indicated an inventory at retail of $295,000, what inferences would you draw?
- Deere and Company reported inventory in its balance sheet as follows.

What additional disclosures might be necessary to present the inventory fairly?
- Of what significance is inventory turnover to a retail store?
- * What modifications to the conventional retail method are necessary to approximate a LIFO retail flow?
BRIEF EXERCISES
BE9-1 Presented below is information related to Rembrandt Inc.'s inventory.
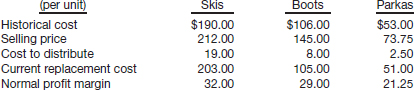
Determine the following: (a) the two limits to market value (i.e., the ceiling and the floor) that should be used in the lower-of-cost-or-market computation for skis, (b) the cost amount that should be used in the lower-of-cost-or-market comparison of boots, and (c) the market amount that should be used to value parkas on the basis of the lower-of-cost-or-market.
![]()
![]()
BE9-2 Floyd Corporation has the following four items in its ending inventory.
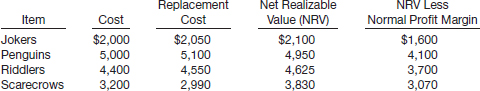
Determine the final lower-of-cost-or-market inventory value for each item.
![]()
![]()
BE9-3 Kumar Inc. uses a perpetual inventory system. At January 1, 2014, inventory was $214,000 at both cost and market value. At December 31, 2014, the inventory was $286,000 at cost and $265,000 at market value. Prepare the necessary December 31 entry under (a) the cost-of-goods-sold method and (b) the loss method.
![]()
BE9-4 Bell, Inc. buys 1,000 computer game CDs from a distributor who is discontinuing those games. The purchase price for the lot is $8,000. Bell will group the CDs into three price categories for resale, as indicated below.
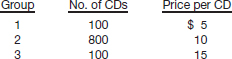
Determine the cost per CD for each group, using the relative sales value method.
![]()
BE9-5 Kemper Company signed a long-term noncancelable purchase commitment with a major supplier to purchase raw materials in 2015 at a cost of $1,000,000. At December 31, 2014, the raw materials to be purchased have a market value of $950,000. Prepare any necessary December 31, 2014, entry.
![]()
BE9-6 Use the information for Kemper Company from BE9-5. In 2015, Kemper paid $1,000,000 to obtain the raw materials which were worth $950,000. Prepare the entry to record the purchase.
![]()
BE9-7 Fosbre Corporation's April 30 inventory was destroyed by fire. January 1 inventory was $150,000, and purchases for January through April totaled $500,000. Sales revenue for the same period were $700,000. Fosbre's normal gross profit percentage is 35% on sales. Using the gross profit method, estimate Fosbre's April 30 inventory that was destroyed by fire.
![]()
BE9-8 Boyne Inc. had beginning inventory of $12,000 at cost and $20,000 at retail. Net purchases were $120,000 at cost and $170,000 at retail. Net markups were $10,000; net markdowns were $7,000; and sales revenue was $147,000. Compute ending inventory at cost using the conventional retail method.
![]()
BE9-9 In its 2012 annual report, Gap Inc. reported inventory of $1,615 million on January 25, 2012, and $1,620 million on January 29, 2011, cost of sales of $9,275 million for fiscal year 2012, and net sales of $14,549 million. Compute Gap's inventory turnover and the average days to sell inventory for the fiscal year 2012.
![]()
*BE9-10 Use the information for Boyne Inc. from BE9-8. Compute ending inventory at cost using the LIFO retail method.
![]()
*BE9-11 Use the information for Boyne Inc. from BE9-8, and assume the price level increased from 100 at the beginning of the year to 115 at year-end. Compute ending inventory at cost using the dollar-value LIFO retail method.
EXERCISES

E9-1 (Lower-of-Cost-or-Market) The inventory of 3T Company on December 31, 2014, consists of the following items.
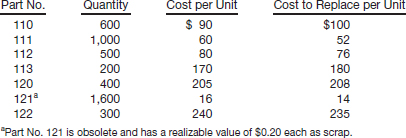
Instructions
(a) Determine the inventory as of December 31, 2014, by the lower-of-cost-or-market method, applying this method directly to each item.
(b) Determine the inventory by the lower-of-cost-or-market method, applying the method to the total of the inventory.
![]()
![]()
E9-2 (Lower-of-Cost-or-Market) Smashing Pumpkins Company uses the lower-of-cost-or-market method, on an individual-item basis, in pricing its inventory items. The inventory at December 31, 2014, consists of products D, E, F, G, H, and I. Relevant per-unit data for these products appear below.
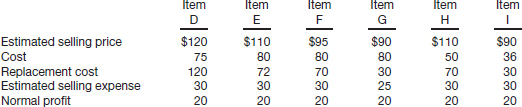
Instructions
Using the lower-of-cost-or-market rule, determine the proper unit value for balance sheet reporting purposes at December 31, 2014, for each of the inventory items above.
![]()
![]()
E9-3 (Lower-of-Cost-or-Market) Michael Bolton Company follows the practice of pricing its inventory at the lower-of-cost-or-market, on an individual-item basis.
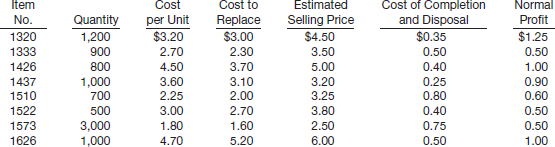
Instructions
From the information above, determine the amount of Bolton Company inventory.
![]()
![]()
E9-4 (Lower-of-Cost-or-Market—Journal Entries) Corrs Company began operations in 2013 and determined its ending inventory at cost and at lower-of-cost-or-market at December 31, 2013, and December 31, 2014. This information is presented below.
![]()
(a) Prepare the journal entries required at December 31, 2013, and December 31, 2014, assuming that the inventory is recorded at market, and a perpetual inventory system (direct method) is used.
(b) Prepare journal entries required at December 31, 2013, and December 31, 2014, assuming that the inventory is recorded at cost and an allowance account is adjusted at each year-end under a perpetual system.
(c) Which of the two methods above provides the higher net income in each year?
![]()
![]()
E9-5 (Lower-of-Cost-or-Market—Valuation Account) Presented below is information related to Candlebox Enterprises.
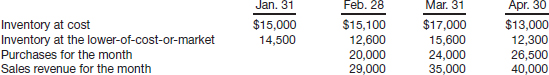
Instructions
(a) From the information, prepare (as far as the data permit) monthly income statements in columnar form for February, March, and April. The inventory is to be shown in the statement at cost, the gain or loss due to market fluctuations is to be shown separately, and a valuation account is to be set up for the difference between cost and the lower of cost or market.
(b) Prepare the journal entry required to establish the valuation account at January 31 and entries to adjust it monthly thereafter.
![]()
![]()
E9-6 (Lower-of-Cost-or-Market—Error Effect) Winans Company uses the lower-of-cost-or-market method, on an individual-item basis, in pricing its inventory items. The inventory at December 31, 2013, included product X. Relevant per-unit data for product X appear below.
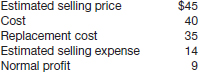
There were 1,000 units of product X on hand at December 31, 2013. Product X was incorrectly valued at $35 per unit for reporting purposes. All 1,000 units were sold in 2014.
Instructions
Compute the effect of this error on net income for 2013 and the effect on net income for 2014, and indicate the direction of the misstatement for each year.
![]()
E9-7 (Relative Sales Value Method) Phil Collins Realty Corporation purchased a tract of unimproved land for $55,000. This land was improved and subdivided into building lots at an additional cost of $34,460. These building lots were all of the same size but owing to differences in location were offered for sale at different prices as follows.
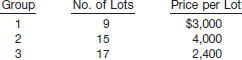
Operating expenses for the year allocated to this project total $18,200. Lots unsold at the year-end were as follows.
![]()
Instructions
At the end of the fiscal year Phil Collins Realty Corporation instructs you to arrive at the net income realized on this operation to date.
E9-8 (Relative Sales Value Method) During 2014, Pretenders Furniture Company purchases a carload of wicker chairs. The manufacturer sells the chairs to Pretenders for a lump sum of $59,850 because it is discontinuing manufacturing operations and wishes to dispose of its entire stock. Three types of chairs are included in the carload. The three types and the estimated selling price for each are listed below.
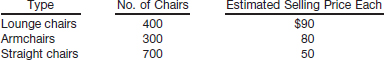
During 2014, Pretenders sells 200 lounge chairs, 100 armchairs, and 120 straight chairs.
Instructions
What is the amount of gross profit realized during 2014? What is the amount of inventory of unsold straight chairs on December 31, 2014?
![]()
E9-9 (Purchase Commitments) Marvin Gaye Company has been having difficulty obtaining key raw materials for its manufacturing process. The company therefore signed a long-term noncancelable purchase commitment with its largest supplier of this raw material on November 30, 2014, at an agreed price of $400,000. At December 31, 2014, the raw material had declined in price to $365,000.
Instructions
What entry would you make on December 31, 2014, to recognize these facts?
![]()
E9-10 (Purchase Commitments) At December 31, 2014, Indigo Girls Company has outstanding noncancelable purchase commitments for 36,000 gallons, at $3.00 per gallon, of raw material to be used in its manufacturing process. The company prices its raw material inventory at cost or market, whichever is lower.
Instructions
(a) Assuming that the market price as of December 31, 2014, is $3.30, how would this matter be treated in the accounts and statements? Explain.
(b) Assuming that the market price as of December 31, 2014, is $2.70, instead of $3.30, how would you treat this situation in the accounts and statements?
(c) Give the entry in January 2015, when the 36,000-gallon shipment is received, assuming that the situation given in (b) above existed at December 31, 2014, and that the market price in January 2015 was $2.70 per gallon. Give an explanation of your treatment.
![]()
E9-11 (Gross Profit Method) Each of the following gross profit percentages is expressed in terms of cost.
- 20%.
- 25%.
- 33⅓%.
- 50%.
Instructions
Indicate the gross profit percentage in terms of sales for each of the above.
![]()
E9-12 (Gross Profit Method) Mark Price Company uses the gross profit method to estimate inventory for monthly reporting purposes. Presented below is information for the month of May.
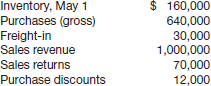
Instructions
(a) Compute the estimated inventory at May 31, assuming that the gross profit is 30% of sales.
(b) Compute the estimated inventory at May 31, assuming that the gross profit is 30% of cost.
![]()
E9-13 (Gross Profit Method) Tim Legler requires an estimate of the cost of goods lost by fire on March 9. Merchandise on hand on January 1 was $38,000. Purchases since January 1 were $72,000; freight-in, $3,400; purchase returns and allowances, $2,400. Sales are made at 33⅓% above cost and totaled $100,000 to March 9. Goods costing $10,900 were left undamaged by the fire; remaining goods were destroyed.
Instructions
(a) Compute the cost of goods destroyed.
(b) Compute the cost of goods destroyed, assuming that the gross profit is 33⅓% of sales.
E9-14 (Gross Profit Method) Rasheed Wallace Company lost most of its inventory in a fire in December just before the year-end physical inventory was taken. The corporation's books disclosed the following.
![]()
Merchandise with a selling price of $21,000 remained undamaged after the fire. Damaged merchandise with an original selling price of $15,000 had a net realizable value of $5,300.
Instructions
Compute the amount of the loss as a result of the fire, assuming that the corporation had no insurance coverage.
![]()
E9-15 (Gross Profit Method) You are called by Tim Duncan of Spurs Co. on July 16 and asked to prepare a claim for insurance as a result of a theft that took place the night before. You suggest that an inventory be taken immediately. The following data are available.
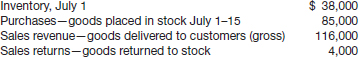
Your client reports that the goods on hand on July 16 cost $30,500, but you determine that this figure includes goods of $6,000 received on a consignment basis. Your past records show that sales are made at approximately 40% over cost. Duncan's insurance covers only goods owned.
Instructions
Compute the claim against the insurance company.
![]()
E9-16 (Gross Profit Method) Gheorghe Moresan Lumber Company handles three principal lines of merchandise with these varying rates of gross profit on cost.
| Lumber | 25% |
| Millwork | 30% |
| Hardware and fittings | 40% |
On August 18, a fire destroyed the office, lumber shed, and a considerable portion of the lumber stacked in the yard. To file a report of loss for insurance purposes, the company must know what the inventories were immediately preceding the fire. No detail or perpetual inventory records of any kind were maintained. The only pertinent information you are able to obtain are the following facts from the general ledger, which was kept in a fireproof vault and thus escaped destruction.
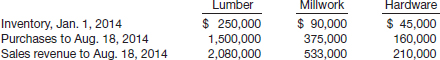
Instructions
Submit your estimate of the inventory amounts immediately preceding the fire.
![]()
E9-17 (Gross Profit Method) Presented below is information related to Aaron Rodgers Corporation for the current year.
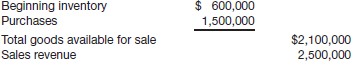
Instructions
Compute the ending inventory, assuming that (a) gross profit is 45% of sales; (b) gross profit is 60% of cost; (c) gross profit is 35% of sales; and (d) gross profit is 25% of cost.
E9-18 (Retail Inventory Method) Presented below is information related to Bobby Engram Company.
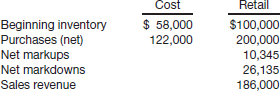
Instructions
(a) Compute the ending inventory at retail.
(b) Compute a cost-to-retail percentage (round to two decimals) under the following conditions.
(1) Excluding both markups and markdowns.
(2) Excluding markups but including markdowns.
(3) Excluding markdowns but including markups.
(4) Including both markdowns and markups.
(c) Which of the methods in (b) above (1, 2, 3, or 4) does the following?
(1) Provides the most conservative estimate of ending inventory.
(2) Provides an approximation of lower-of-cost-or-market.
(3) Is used in the conventional retail method.
(d) Compute ending inventory at lower-of-cost-or-market (round to nearest dollar).
(e) Compute cost of goods sold based on (d).
(f) Compute gross margin based on (d).
![]()
E9-19 (Retail Inventory Method) Presented below is information related to Ricky Henderson Company.
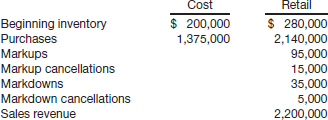
Instructions
Compute the inventory by the conventional retail inventory method.
![]()
E9-20 (Retail Inventory Method) The records of Ellen's Boutique report the following data for the month of April.
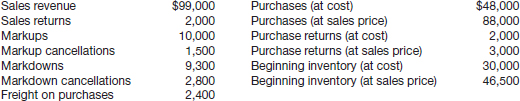
Instructions
Compute the ending inventory by the conventional retail inventory method.
![]()
E9-21 (Analysis of Inventories) The financial statements of ConAgra Foods, Inc.'s 2012 annual report disclose the following information.
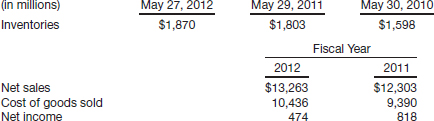
Compute ConAgra's (a) inventory turnover and (b) the average days to sell inventory for 2012 and 2011.
![]()
*E9-22 (Retail Inventory Method—Conventional and LIFO) Helen Keller Company began operations on January 1, 2013, adopting the conventional retail inventory system. None of the company's merchandise was marked down in 2013 and, because there was no beginning inventory, its ending inventory for 2013 of $38,100 would have been the same under either the conventional retail system or the LIFO retail system.
On December 31, 2014, the store management considers adopting the LIFO retail system and desires to know how the December 31, 2014, inventory would appear under both systems. All pertinent data regarding purchases, sales, markups, and markdowns are shown below. There has been no change in the price level.
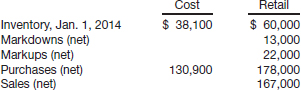
Instructions
Determine the cost of the 2014 ending inventory under both (a) the conventional retail method and (b) the LIFO retail method.
![]()
*E9-23 (Retail Inventory Method—Conventional and LIFO) Leonard Bernstein Company began operations late in 2013 and adopted the conventional retail inventory method. Because there was no beginning inventory for 2013 and no markdowns during 2013, the ending inventory for 2013 was $14,000 under both the conventional retail method and the LIFO retail method. At the end of 2014, management wants to compare the results of applying the conventional and LIFO retail methods. There was no change in the price level during 2014. The following data are available for computations.
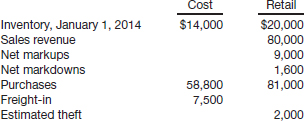
Instructions
Compute the cost of the 2014 ending inventory under both (a) the conventional retail method and (b) the LIFO retail method.
![]()
*E9-24 (Dollar-Value LIFO Retail) You assemble the following information for Seneca Department Store, which computes its inventory under the dollar-value LIFO method.
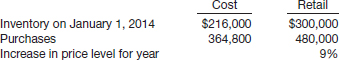
Instructions
Compute the cost of the inventory on December 31, 2014, assuming that the inventory at retail is (a) $294,300 and (b) $365,150.
![]()
*E9-25 (Dollar-Value LIFO Retail) Presented below is information related to Langston Hughes Corporation.
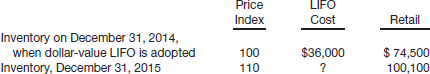
Compute the ending inventory under the dollar-value LIFO method at December 31, 2015. The cost-to-retail ratio for 2015 was 60%.
![]()
*E9-26 (Conventional Retail and Dollar-Value LIFO Retail) Amiras Corporation began operations on January 1, 2014, with a beginning inventory of $30,100 at cost and $50,000 at retail. The following information relates to 2014.
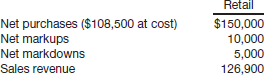
Instructions
(a) Assume Amiras decided to adopt the conventional retail method. Compute the ending inventory to be reported in the balance sheet.
(b) Assume instead that Amiras decides to adopt the dollar-value LIFO retail method. The appropriate price indexes are 100 at January 1 and 110 at December 31. Compute the ending inventory to be reported in the balance sheet.
(c) On the basis of the information in part (b), compute cost of goods sold.
![]()
*E9-27 (Dollar-Value LIFO Retail) Connie Chung Corporation adopted the dollar-value LIFO retail inventory method on January 1, 2013. At that time the inventory had a cost of $54,000 and a retail price of $100,000. The following information is available.
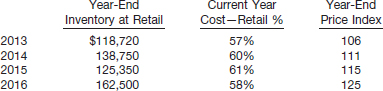
The price index at January 1, 2013, is 100.
Instructions
Compute the ending inventory at December 31 of the years 2013–2016. (Round to the nearest dollar.)
![]()
*E9-28 (Change to LIFO Retail) John Olerud Ltd., a local retailing concern in the Bronx, New York, has decided to change from the conventional retail inventory method to the LIFO retail method starting on January 1, 2015. The company recomputed its ending inventory for 2014 in accordance with the procedures necessary to switch to LIFO retail. The inventory computed was $212,600.
Instructions
Assuming that John Olerud Ltd.'s ending inventory for 2014 under the conventional retail inventory method was $205,000, prepare the appropriate journal entry on January 1, 2015.
EXERCISES SET B
See the book's companion website, at www.wiley.com/college/kieso, for an additional set of exercises.
PROBLEMS
![]()
![]()
P9-1 (Lower-of-Cost-or-Market) Remmers Company manufactures desks. Most of the company's desks are standard models and are sold on the basis of catalog prices. At December 31, 2014, the following finished desks appear in the company's inventory.
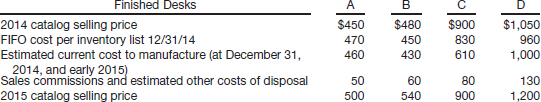
The 2014 catalog was in effect through November 2014, and the 2015 catalog is effective as of December 1, 2014. All catalog prices are net of the usual discounts. Generally, the company attempts to obtain a 20% gross profit on selling price and has usually been successful in doing so.
Instructions
At what amount should each of the four desks appear in the company's December 31, 2014, inventory, assuming that the company has adopted a lower-of-FIFO-cost-or-market approach for valuation of inventories on an individual-item basis?
![]()
![]()
![]()
P9-2 (Lower-of-Cost-or-Market) Garcia Home Improvement Company installs replacement siding, windows, and louvered glass doors for single-family homes and condominium complexes in northern New Jersey and southern New York. The company is in the process of preparing its annual financial statements for the fiscal year ended May 31, 2014, and Jim Alcide, controller for Garcia, has gathered the following data concerning inventory.
At May 31, 2014, the balance in Garcia's Raw Materials Inventory account was $408,000, and Allowance to Reduce Inventory to Market had a credit balance of $27,500. Alcide summarized the relevant inventory cost and market data at May 31, 2014, in the schedule below.
Alcide assigned Patricia Devereaux, an intern from a local college, the task of calculating the amount that should appear on Garcia's May 31, 2014, financial statements for inventory under the lower-of-cost-or-market rule as applied to each item in inventory. Devereaux expressed concern over departing from the historical cost principle.
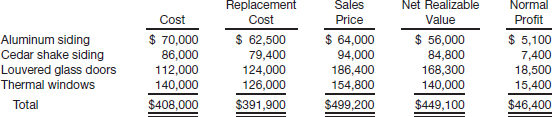
Instructions
(a)
(1) Determine the proper balance in Allowance to Reduce Inventory to Market at May 31, 2014.
(2) For the fiscal year ended May 31, 2014, determine the amount of the gain or loss that would be recorded due to the change in Allowance to Reduce Inventory to Market.
(b) Explain the rationale for the use of the lower-of-cost-or-market rule as it applies to inventories.
(CMA adapted)
![]()
![]()
P9-3 (Entries for Lower-of-Cost-or-Market—Cost-of-Goods-Sold and Loss) Malone Company determined its ending inventory at cost and at lower-of-cost-or-market at December 31, 2013, December 31, 2014, and December 31, 2015, as shown below.
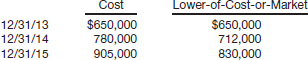
Instructions
(a) Prepare the journal entries required at December 31, 2014, and at December 31, 2015, assuming that the cost-of-goods-sold method of adjusting to lower-of-cost-or-market is used.
(b) Prepare the journal entries required at December 31, 2014, and at December 31, 2015, assuming that the loss method of adjusting to lower-of-cost-or-market is used.
P9-4 (Gross Profit Method) Eastman Company lost most of its inventory in a fire in December just before the year-end physical inventory was taken. Corporate records disclose the following.
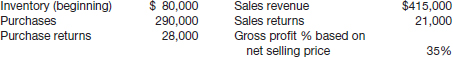
Merchandise with a selling price of $30,000 remained undamaged after the fire, and damaged merchandise has a net realizable value of $8,150. The company does not carry fire insurance on its inventory.
Instructions
Prepare a formal labeled schedule computing the fire loss incurred. (Do not use the retail inventory method.)
![]()
![]()
P9-5 (Gross Profit Method) On April 15, 2015, fire damaged the office and warehouse of Stanislaw Corporation. The only accounting record saved was the general ledger, from which the trial balance below was prepared.
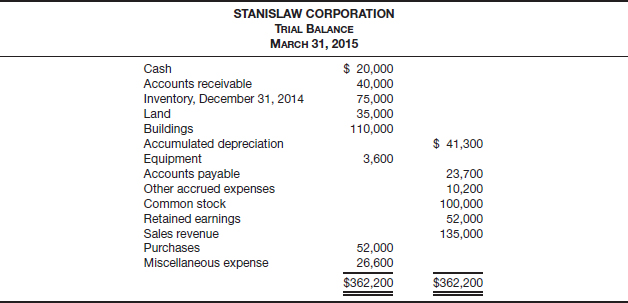
The following data and information have been gathered.
- The fiscal year of the corporation ends on December 31.
- An examination of the April bank statement and canceled checks revealed that checks written during the period April 1–15 totaled $13,000: $5,700 paid to accounts payable as of March 31, $3,400 for April merchandise shipments, and $3,900 paid for other expenses. Deposits during the same period amounted to $12,950, which consisted of receipts on account from customers with the exception of a $950 refund from a vendor for merchandise returned in April.
- Correspondence with suppliers revealed unrecorded obligations at April 15 of $15,600 for April merchandise shipments, including $2,300 for shipments in transit (f.o.b. shipping point) on that date.
- Customers acknowledged indebtedness of $46,000 at April 15, 2015. It was also estimated that customers owed another $8,000 that will never be acknowledged or recovered. Of the acknowledged indebtedness, $600 will probably be uncollectible.
- The companies insuring the inventory agreed that the corporation's fire-loss claim should be based on the assumption that the overall gross profit rate for the past 2 years was in effect during the current year. The corporation's audited financial statements disclosed this information:
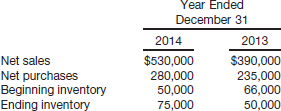
- Inventory with a cost of $7,000 was salvaged and sold for $3,500. The balance of the inventory was a total loss.
Instructions
Prepare a schedule computing the amount of inventory fire loss. The supporting schedule of the computation of the gross profit should be in good form.
(AICPA adapted)
![]()
P9-6 (Retail Inventory Method) The records for the Clothing Department of Sharapova's Discount Store are summarized below for the month of January.
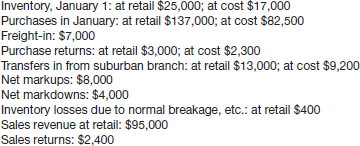
Instructions
(a) Compute the inventory for this department as of January 31, at retail prices.
(b) Compute the ending inventory using lower-of-average-cost-or-market.
![]()
P9-7 (Retail Inventory Method) Presented below is information related to Waveland Inc.
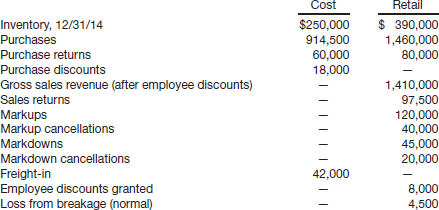
Instructions
Assuming that Waveland Inc. uses the conventional retail inventory method, compute the cost of its ending inventory at December 31, 2015.
![]()
![]()
P9-8 (Retail Inventory Method) Fuque Inc. uses the retail inventory method to estimate ending inventory for its monthly financial statements. The following data pertain to a single department for the month of October 2015.
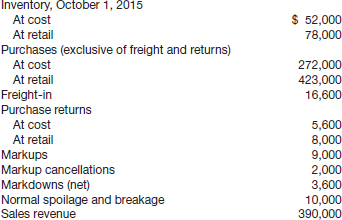
(a) Using the conventional retail method, prepare a schedule computing estimated lower-of-cost-or-market inventory for October 31, 2015.
(b) A department store using the conventional retail inventory method estimates the cost of its ending inventory as $60,000. An accurate physical count reveals only $47,000 of inventory at lower-of-cost-or-market. List the factors that may have caused the difference between the computed inventory and the physical count.
![]()
![]()
![]()
![]()
P9-9 (Statement and Note Disclosure, LCM, and Purchase Commitment) Maddox Specialty Company, a division of Lost World Inc., manufactures three models of gear shift components for bicycles that are sold to bicycle manufacturers, retailers, and catalog outlets. Since beginning operations in 1990, Maddox has used normal absorption costing and has assumed a first-in, first-out cost flow in its perpetual inventory system. The balances of the inventory accounts at the end of Maddox's fiscal year, November 30, 2014, are shown below. The inventories are stated at cost before any year-end adjustments.
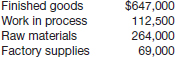
The following information relates to Maddox's inventory and operations.
- The finished goods inventory consists of the items analyzed below.
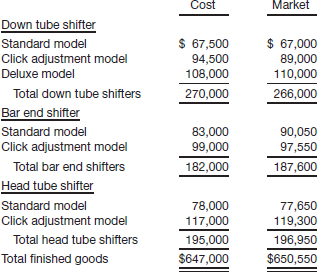
- One-half of the head tube shifter finished goods inventory is held by catalog outlets on consignment.
- Three-quarters of the bar end shifter finished goods inventory has been pledged as collateral for a bank loan.
- One-half of the raw materials balance represents derailleurs acquired at a contracted price 20% above the current market price. The market value of the rest of the raw materials is $127,400.
- The total market value of the work in process inventory is $108,700.
- Included in the cost of factory supplies are obsolete items with an historical cost of $4,200. The market value of the remaining factory supplies is $65,900.
- Maddox applies the lower-of-cost-or-market method to each of the three types of shifters in finished goods inventory. For each of the other three inventory accounts, Maddox applies the lower-of-cost-or-market method to the total of each inventory account.
- Consider all amounts presented above to be material in relation to Maddox's financial statements taken as a whole.
Instructions
(a) Prepare the inventory section of Maddox's balance sheet as of November 30, 2014, including any required note(s).
(b) Without prejudice to your answer to (a), assume that the market value of Maddox's inventories is less than cost. Explain how this decline would be presented in Maddox's income statement for the fiscal year ended November 30, 2014.
(c) Assume that Maddox has a firm purchase commitment for the same type of derailleur included in the raw materials inventory as of November 30, 2014, and that the purchase commitment is at a contracted price 15% greater than the current market price. These derailleurs are to be delivered to Maddox after November 30, 2014. Discuss the impact, if any, that this purchase commitment would have on Maddox's financial statements prepared for the fiscal year ended November 30, 2014.
(CMA adapted)
![]()
![]()
![]()
P9-10 (Lower-of-Cost-or-Market) Fiedler Co. follows the practice of valuing its inventory at the lower-of-cost-or-market. The following information is available from the company's inventory records as of December 31, 2014.
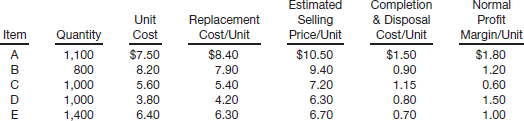
Instructions
Greg Forda is an accounting clerk in the accounting department of Fiedler Co., and he cannot understand why the market value keeps changing from replacement cost to net realizable value to something that he cannot even figure out. Greg is very confused, and he is the one who records inventory purchases and calculates ending inventory. You are the manager of the department and an accountant.
(a) Calculate the lower-of-cost-or-market using the “individual item” approach.
(b) Show the journal entry he will need to make in order to write down the ending inventory from cost to market.
(c) Then write a memo to Greg explaining what designated market value is as well as how it is computed. Use your calculations to aid in your explanation.
![]()
*P9-11 (Conventional and Dollar-Value LIFO Retail) As of January 1, 2014, Aristotle Inc. installed the retail method of accounting for its merchandise inventory.
To prepare the store's financial statements at June 30, 2014, you obtain the following data.
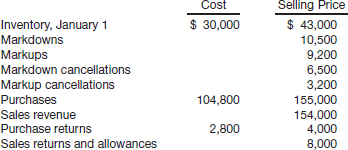
Instructions
(a) Prepare a schedule to compute Aristotle's June 30, 2014, inventory under the conventional retail method of accounting for inventories.
(b) Without prejudice to your solution to part (a), assume that you computed the June 30, 2014, inventory to be $59,400 at retail and the ratio of cost to retail to be 70%. The general price level has increased from 100 at January 1, 2014, to 108 at June 30, 2014. Prepare a schedule to compute the June 30, 2014, inventory at the June 30 price level under the dollar-value LIFO retail method.
(AICPA adapted)
![]()
![]()
*P9-12 (Retail, LIFO Retail, and Inventory Shortage) Late in 2011, Joan Seceda and four other investors took the chain of Becker Department Stores private, and the company has just completed its third year of operations under the ownership of the investment group. Andrea Selig, controller of Becker Department Stores, is in the process of preparing the year-end financial statements. Based on the preliminary financial statements, Seceda has expressed concern over inventory shortages, and she has asked Selig to determine whether an abnormal amount of theft and breakage has occurred. The accounting records of Becker Department Stores contain the following amounts on November 30, 2014, the end of the fiscal year.
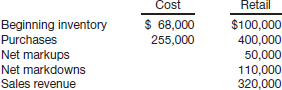
According to the November 30, 2014, physical inventory, the actual inventory at retail is $115,000.
Instructions
(a) Describe the circumstances under which the retail inventory method would be applied and the advantages of using the retail inventory method.
(b) Assuming that prices have been stable, calculate the value, at cost, of Becker Department Stores’ ending inventory using the last-in, first-out (LIFO) retail method. Be sure to furnish supporting calculations.
(c) Estimate the amount of shortage, at retail, that has occurred at Becker Department Stores during the year ended November 30, 2014.
(d) Complications in the retail method can be caused by such items as (1) freight-in costs, (2) purchase returns and allowances, (3) sales returns and allowances, and (4) employee discounts. Explain how each of these four special items is handled in the retail inventory method.
(CMA adapted)
![]()
*P9-13 (Change to LIFO Retail) Diderot Stores Inc., which uses the conventional retail inventory method, wishes to change to the LIFO retail method beginning with the accounting year ending December 31, 2014.
Amounts as shown below appear on the store's books before adjustment.
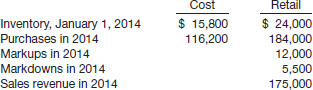
You are to assume that all markups and markdowns apply to 2014 purchases, and that it is appropriate to treat the entire inventory as a single department.
Instructions
Compute the inventory at December 31, 2014, under the following methods.
(a) The conventional retail method.
(b) The last-in, first-out retail method, effecting the change in method as of January 1, 2014. Assume that the cost-to-retail percentage for 2013 was recomputed correctly in accordance with procedures necessary to change to LIFO. This ratio was 59%.
(AICPA adapted)
![]()
*P9-14 (Change to LIFO Retail; Dollar-Value LIFO Retail) Davenport Department Store converted from the conventional retail method to the LIFO retail method on January 1, 2014, and is now considering converting to the dollar-value LIFO inventory method. During your examination of the financial statements for the year ended December 31, 2015, management requested that you furnish a summary showing certain computations of inventory cost for the past 3 years.
Here is the available information.
- The inventory at January 1, 2013, had a retail value of $56,000 and cost of $29,800 based on the conventional retail method.
- Transactions during 2013 were as follows.
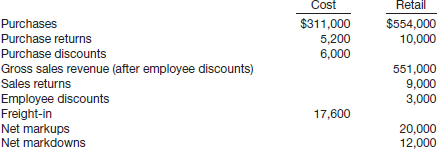
- The retail value of the December 31, 2014, inventory was $75,600, the cost ratio for 2014 under the LIFO retail method was 61%, and the regional price index was 105% of the January 1, 2014, price level.
- The retail value of the December 31, 2015, inventory was $62,640, the cost ratio for 2015 under the LIFO retail method was 60%, and the regional price index was 108% of the January 1, 2014, price level.
Instructions
(a) Prepare a schedule showing the computation of the cost of inventory on hand at December 31, 2013, based on the conventional retail method.
(b) Prepare a schedule showing the recomputation of the inventory to be reported on December 31, 2013, in accordance with procedures necessary to convert from the conventional retail method to the LIFO retail method beginning January 1, 2014. Assume that the retail value of the December 31, 2013, inventory was $60,000.
(c) Without prejudice to your solution to part (b), assume that you computed the December 31, 2013, inventory (retail value $60,000) under the LIFO retail method at a cost of $33,300. Prepare a schedule showing the computations of the cost of the store's 2014 and 2015 year-end inventories under the dollar-value LIFO method.
(AICPA adapted)
PROBLEMS SET B
See the book's companion website, at www.wiley.com/college/kieso, for an additional set of problems.
CONCEPTS FOR ANALYSIS
![]()
CA9-1 (Lower-of-Cost-or-Market) You have been asked by the financial vice president to develop a short presentation on the lower-of-cost-or-market method for inventory purposes. The financial VP needs to explain this method to the president because it appears that a portion of the company's inventory has declined in value.
Instructions
The financial VP asks you to answer the following questions.
(a) What is the purpose of the lower-of-cost-or-market method?
(b) What is meant by “market”? (Hint: Discuss the ceiling and floor constraints.)
(c) Do you apply the lower-of-cost-or-market method to each individual item, to a category, or to the total of the inventory? Explain.
(d) What are the potential disadvantages of the lower-of-cost-or-market method?
![]()
CA9-2 (Lower-of-Cost-or-Market) The market value of Lake Corporation's inventory has declined below its cost. Sheryl Conan, the controller, wants to use the loss method to write down inventory because it more clearly discloses the decline in market value and does not distort the cost of goods sold. Her supervisor, financial vice president Dick Wright, prefers the cost-of-goods-sold method to write down inventory because it does not call attention to the decline in market value.
Instructions
Answer the following questions.
(a) What, if any, is the ethical issue involved?
(b) Is any stakeholder harmed if Dick Wright's preference is used?
(c) What should Sheryl Conan do?
CA9-3 (Lower-of-Cost-or-Market) Ogala Corporation purchased a significant amount of raw materials inventory for a new product that it is manufacturing.
Ogala uses the lower-of-cost-or-market rule for these raw materials. The replacement cost of the raw materials is above the net realizable value, and both are below the original cost.
Ogala uses the average-cost inventory method for these raw materials. In the last 2 years, each purchase has been at a lower price than the previous purchase, and the ending inventory quantity for each period has been higher than the beginning inventory quantity for that period.
Instructions
(a)
(1) At which amount should Ogala's raw materials inventory be reported on the balance sheet? Why?
(2) In general, why is the lower-of-cost-or-market rule used to report inventory?
(b) What would have been the effect on ending inventory and cost of goods sold had Ogala used the LIFO inventory method instead of the average-cost inventory method for the raw materials? Why?
![]()
CA9-4 (Retail Inventory Method) Saurez Company, your client, manufactures paint. The company's president, Maria Saurez, has decided to open a retail store to sell Saurez paint as well as wallpaper and other supplies that would be purchased from other suppliers. She has asked you for information about the conventional retail method of pricing inventories at the retail store.
Instructions
Prepare a report to the president explaining the retail method of pricing inventories. Your report should include the following points.
(a) Description and accounting features of the method.
(b) The conditions that may distort the results under the method.
(c) A comparison of the advantages of using the retail method with those of using cost methods of inventory pricing.
(d) The accounting theory underlying the treatment of net markdowns and net markups under the method.
(AICPA adapted)
CA9-5 (Cost Determination, LCM, Retail Method) Olson Corporation, a retailer and wholesaler of national brand-name household lighting fixtures, purchases its inventories from various suppliers.
Instructions
(a)
(1) What criteria should be used to determine which of Olson's costs are inventoriable?
(2) Are Olson's administrative costs inventoriable? Defend your answer.
(b)
(1) Olson uses the lower-of-cost-or-market rule for its wholesale inventories. What are the theoretical arguments for that rule?
(2) The replacement cost of the inventories is below the net realizable value less a normal profit margin, which, in turn, is below the original cost. What amount should be used to value the inventories? Why?
(c) Olson calculates the estimated cost of its ending inventories held for sale at retail using the conventional retail inventory method. How would Olson treat the beginning inventories and net markdowns in calculating the cost ratio used to determine its ending inventories? Why?
(AICPA adapted)
![]()
CA9-6 (Purchase Commitments) Prophet Company signed a long-term purchase contract to buy timber from the U.S. Forest Service at $300 per thousand board feet. Under these terms, Prophet must cut and pay $6,000,000 for this timber during the next year. Currently, the market value is $250 per thousand board feet. At this rate, the market price is $5,000,000. Jerry Herman, the controller, wants to recognize the loss in value on the year-end financial statements, but the financial vice president, Billie Hands, argues that the loss is temporary and should be ignored. Herman notes that market value has remained near $250 for many months, and he sees no sign of significant change.
Instructions
(a) What are the ethical issues, if any?
(b) Is any particular stakeholder harmed by the financial vice president's decision?
(c) What should the controller do?
USING YOUR JUDGMENT
Financial Reporting Problem
The Procter & Gamble Company (P&G)
![]()
The financial statements of P&G are presented in Appendix 5B. The company's complete annual report, including the notes to the financial statements, can be accessed at the book's companion website, www.wiley.com/college/kieso.
Instructions
Refer to P&G's financial statements and the accompanying notes to answer the following questions.
(a) How does P&G value its inventories? Which inventory costing method does P&G use as a basis for reporting its inventories?
(b) How does P&G report its inventories in the balance sheet? In the notes to its financial statements, what three descriptions are used to classify its inventories?
(c) What costs does P&G include in Inventory and Cost of Products Sold?
(d) What was P&G's inventory turnover in 2011? What is its gross profit percentage? Evaluate P&G's inventory turnover and its gross profit percentage.
Comparative Analysis Case
The Coca-Cola Company and PepsiCo, Inc.
Instructions
Go to the book's companion website and use information found there to answer the following questions related to The Coca-Cola Company and PepsiCo, Inc.
(a) What is the amount of inventory reported by Coca-Cola at December 31, 2011, and by PepsiCo at December 31, 2011? What percent of total assets is invested in inventory by each company?
(b) What inventory costing methods are used by Coca-Cola and PepsiCo? How does each company value its inventories?
(c) In the notes, what classifications (description) are used by Coca-Cola and PepsiCo to categorize their inventories?
(d) Compute and compare the inventory turnovers and days to sell inventory for Coca-Cola and PepsiCo for 2011. Indicate why there might be a significant difference between the two companies.
Financial Statement Analysis Cases
Case 1 Robots, Inc.
Robots, Inc. reported the following information regarding 2013–2014 inventory.
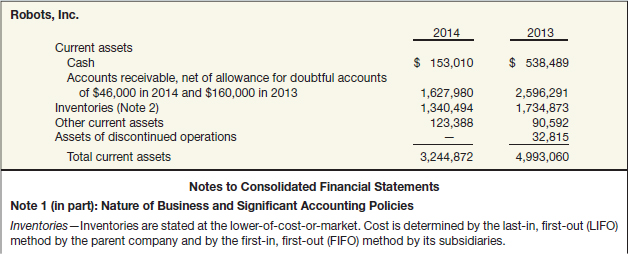
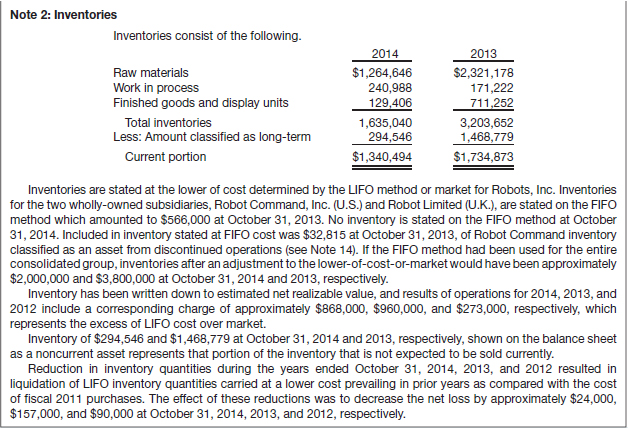
Instructions
(a) Why might Robots, Inc., use two different methods for valuing inventory?
(b) Comment on why Robots, Inc., might disclose how its LIFO inventories would be valued under FIFO.
(c) Why does the LIFO liquidation reduce operating costs?
(d) Comment on whether Robots, Inc. would report more or less income if it had been on a FIFO basis for all its inventory.
Case 2 Barrick Gold Corporation
Barrick Gold Corporation, with headquarters in Toronto, Canada, is the world's most profitable and largest gold mining company outside South Africa. Part of the key to Barrick's success has been due to its ability to maintain cash flow while improving production and increasing its reserves of gold-containing property. In the most recent year, Barrick achieved record growth in cash flow, production, and reserves.
The company maintains an aggressive policy of developing previously identified target areas that have the possibility of a large amount of gold ore, and that have not been previously developed. Barrick limits the riskiness of this development by choosing only properties that are located in politically stable regions, and by the company's use of internally generated funds, rather than debt, to finance growth.
Barrick's inventories are as follows.
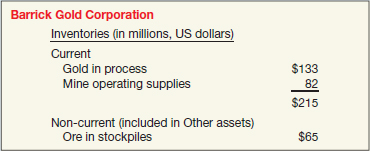
(a) Why do you think that there are no finished goods inventories? Why do you think the raw material, ore in stockpiles, is considered to be a non-current asset?
(b) Consider that Barrick has no finished goods inventories. What journal entries are made to record a sale?
(c) Suppose that gold bullion that cost $1.8 million to produce was sold for $2.4 million. The journal entry was made to record the sale, but no entry was made to remove the gold from the gold in process inventory. How would this error affect the following?
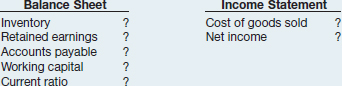
Accounting, Analysis, and Principles
Englehart Company sells two types of pumps. One is large and is for commercial use. The other is smaller and is used in residential swimming pools. The following inventory data is available for the month of March.
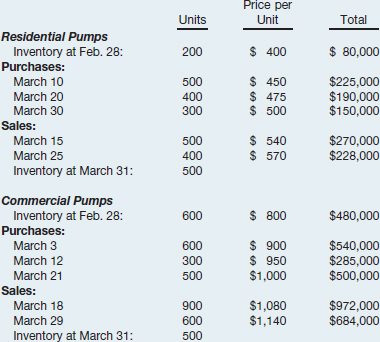
In addition to the above information, due to a downturn in the economy that has hit Englehart's commercial customers especially hard, Englehart expects commercial pump prices from March 31 onward to be considerably different (and lower) than at the beginning of and during March. Englehart has developed the following additional information.
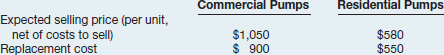
The normal profit margin is 16.67% of cost. Englehart uses the FIFO accounting method.
(a) Determine the dollar amount that Englehart should report on its March 31 balance sheet for inventory. Assume Englehart applies lower-of-cost-or-market at the individual product level.
(b) Repeat part (a) but assume Englehart applies lower-of-cost-or-market at the major category level. Englehart places both commercial and residential pumps into the same (and only) category.
Analysis
Which of the two approaches above (individual product level or major categories) for applying LCM do you think gives the financial statement reader better information?
Principles
Assume that during April, the replacement cost of commercial pumps rebounds to $1,050 (assume this will be designated market value).
(a) Briefly describe how Englehart will report in its April financial statements the inventory remaining from March 31.
(b) Briefly describe the conceptual trade-offs inherent in the accounting in part (a).
BRIDGE TO THE PROFESSION
![]() Professional Research: FASB Codification
Professional Research: FASB Codification
Jones Co. is in a technology-intensive industry. Recently, one of its competitors introduced a new product with technology that might render obsolete some of Jones's inventory. The accounting staff wants to follow the appropriate authoritative literature in determining the accounting for this significant market event.
Instructions
If your school has a subscription to the FASB Codification, go to http://aaahg.org/asclogin.cfm to log in and prepare responses to the following. Provide Codification references for your responses.
(a) Identify the primary authoritative guidance for the accounting for inventories. What is the predecessor literature?
(b) List three types of goods that are classified as inventory. What characteristic will automatically exclude an item from being classified as inventory?
(c) Define “market” as used in the phrase “lower-of-cost-or-market.”
(d) Explain when it is acceptable to state inventory above cost and which industries allow this practice.
Additional Professional Resources
See the book's companion website, at www.wiley.com/college/kieso, for professional simulations as well as other study resources.
 INSIGHTS
LEARNING OBJECTIVE ![]()
Compare the accounting procedures related to valuation of inventories under GAAP and IFRS.
The major IFRS requirements related to accounting and reporting for inventories are found in IAS 2 (“Inventories”), IAS 18 (“Revenue”), and IAS 41 (“Agriculture”). In most cases, IFRS and GAAP are the same. The major differences are that IFRS prohibits the use of the LIFO cost flow assumption and records market in the lower-of-cost-or-market differently.
RELEVANT FACTS
Following are the key similarities and differences between GAAP and IFRS related to inventories.
Similarities
- IFRS and GAAP account for inventory acquisitions at historical cost and evaluate inventory for lower-of-cost-or-market subsequent to acquisition.
- Who owns the goods—goods in transit, consigned goods, special sales agreements—as well as the costs to include in inventory are essentially accounted for the same under IFRS and GAAP.
Differences
- The requirements for accounting for and reporting inventories are more principles-based under IFRS. That is, GAAP provides more detailed guidelines in inventory accounting.
- A major difference between IFRS and GAAP relates to the LIFO cost flow assumption. GAAP permits the use of LIFO for inventory valuation. IFRS prohibits its use. FIFO and average-cost are the only two acceptable cost flow assumptions permitted under IFRS. Both sets of standards permit specific identification where appropriate.
- In the lower-of-cost-or-market test for inventory valuation, IFRS defines market as net realizable value. GAAP, on the other hand, defines market as replacement cost subject to the constraints of net realizable value (the ceiling) and net realizable value less a normal markup (the floor). IFRS does not use a ceiling or a floor to determine market.
- Under GAAP, if inventory is written down under the lower-of-cost-or-market valuation, the new basis is now considered its cost. As a result, the inventory may not be written back up to its original cost in a subsequent period. Under IFRS, the write-down may be reversed in a subsequent period up to the amount of the previous write-down. Both the write-down and any subsequent reversal should be reported on the income statement. IFRS accounting for lower-of-cost-or-market is discussed more fully in the About the Numbers section below.
- IFRS requires both biological assets and agricultural produce at the point of harvest to be reported at net realizable value. GAAP does not require companies to account for all biological assets in the same way. Furthermore, these assets generally are not reported at net realizable value. Disclosure requirements also differ between the two sets of standards. IFRS accounting for agriculture and biological assets is discussed more fully in the About the Numbers section.
ABOUT THE NUMBERS
Lower-of-Cost-or-Net Realizable Value (LCNRV)
Inventories are recorded at their cost. However, if inventory declines in value below its original cost, a major departure from the historical cost principle occurs. Whatever the reason for a decline—obsolescence, price-level changes, or damaged goods—a company should write down the inventory to net realizable value to report this loss. A company abandons the historical cost principle when the future utility (revenue-producing ability) of the asset drops below its original cost.
Recall that cost is the acquisition price of inventory computed using one of the historical cost-based methods—specific identification, average-cost, or FIFO. The term net realizable value (NRV) refers to the net amount that a company expects to realize from the sale of inventory. Specifically, net realizable value is the estimated selling price in the normal course of business less estimated costs to complete and estimated costs to make a sale.
To illustrate, assume that Mander Corp. has unfinished inventory with a cost of $950, a sales value of $1,000, estimated cost of completion of $50, and estimated selling costs of $200. Mander's net realizable value is computed as follows.

Mander reports inventory on its statement of financial position (balance sheet) at $750. In its income statement, Mander reports a Loss on Inventory Write-Down of $200 ($950−$750).
A departure from cost is justified because inventories should not be reported at amounts higher than their expected realization from sale or use. In addition, a company like Mander should charge the loss of utility against revenues in the period in which the loss occurs, not in the period of sale. Companies therefore report their inventories at the lower-of-cost-or-net realizable value (LCNRV) at each reporting date.
Illustration of LCNRV
As indicated, a company values inventory at LCNRV. A company estimates net realizable value based on the most reliable evidence of the inventories’ realizable amounts (expected selling price, expected costs to completion, and expected costs to sell). To illustrate, Regner Foods computes its inventory at LCNRV, as shown in Illustration IFRS9-1.
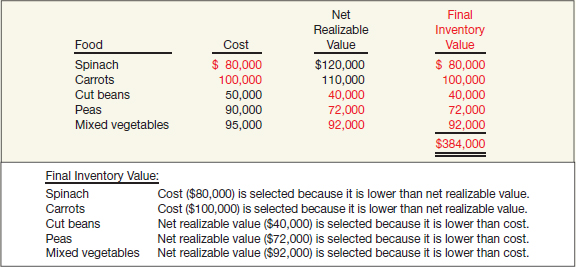
As indicated, the final inventory value of $384,000 equals the sum of the LCNRV for each of the inventory items. That is, Regner Foods applies the LCNRV rule to each individual type of food. Similar to GAAP, under IFRS, companies may apply the LCNRV rule to a group of similar or related items, or to the total of the inventory. If a company follows a group-of-similar-or-related-items or total-inventory approach in determining LCNRV, increases in market prices tend to offset decreases in market prices. In most situations, companies price inventory on an item-by-item basis. In fact, tax rules in some countries require that companies use an individual-item basis, barring practical difficulties.
In addition, the individual-item approach gives the lowest valuation for statement of financial position purposes. In some cases, a company prices inventory on a total-inventory basis when it offers only one end product (comprised of many different raw materials). If it produces several end products, a company might use a similar-or-related approach instead. Whichever method a company selects, it should apply the method consistently from one period to another.
Recording Net Realizable Value Instead of Cost
Similar to GAAP, one of two methods may be used to record the income effect of valuing inventory at net realizable value. One method, referred to as the cost-of-goods-sold method, debits cost of goods sold for the write-down of the inventory to net realizable value. As a result, the company does not report a loss in the income statement because the cost of goods sold already includes the amount of the loss. The second method, referred to as the loss method, debits a loss account for the write-down of the inventory to net realizable value. We use the following inventory data for Ricardo Company to illustrate entries under both methods.

Illustration IFRS9-2 shows the entries for both the cost-of-goods-sold and loss methods, assuming the use of a perpetual inventory system.
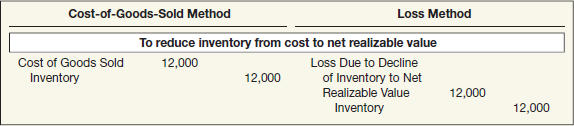
The cost-of-goods-sold method buries the loss in the Cost of Goods Sold account. The loss method, by identifying the loss due to the write-down, shows the loss separate from Cost of Goods Sold in the income statement. Illustration IFRS9-3 contrasts the differing amounts reported in the income statement under the two approaches, using data from the Ricardo example.
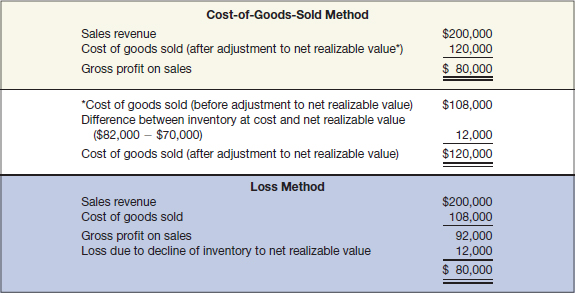
IFRS does not specify a particular account to debit for the write-down. We believe the loss method presentation is preferable because it clearly discloses the loss resulting from a decline in inventory net realizable values.
Use of an Allowance
Instead of crediting the Inventory account for net realizable value adjustments, companies generally use an allowance account, often referred to as Allowance to Reduce Inventory to Net Realizable Value. For example, using an allowance account under the loss method, Ricardo Company makes the following entry to record the inventory write-down to net realizable value.
![]()
Use of the allowance account results in reporting both the cost and the net realizable value of the inventory. Ricardo reports inventory in the statement of financial position as follows.

The use of the allowance under the cost-of-goods-sold or loss method permits both the income statement and the statement of financial position to reflect inventory measured at $82,000, although the statement of financial position shows a net amount of $70,000. It also keeps subsidiary inventory ledgers and records in correspondence with the control account without changing prices. For homework purposes, use an allowance account to record net realizable value adjustments, unless instructed otherwise.
Recovery of Inventory Loss
In periods following the write-down, economic conditions may change such that the net realizable value of inventories previously written down may be greater than cost or there is clear evidence of an increase in the net realizable value. In this situation, the amount of the write-down is reversed, with the reversal limited to the amount of the original write-down.
Continuing the Ricardo example, assume that in the subsequent period, market conditions change, such that the net realizable value increases to $74,000 (an increase of $4,000). As a result, only $8,000 is needed in the allowance. Ricardo makes the following entry, using the loss method.
![]()
Valuation Bases
For the most part, companies record inventory at LCNRV. However, there are some situations in which companies depart from the LCNRV rule. Such treatment may be justified in situations when cost is difficult to determine, the items are readily marketable at quoted market prices, and units of product are interchangeable. In this section, we discuss agricultural assets (including biological assets and agricultural produce), for which net realizable value is the general rule for valuing inventory.
Agricultural Inventory
Under IFRS, net realizable value measurement is used for inventory when the inventory is related to agricultural activity. In general, agricultural activity results in two types of agricultural assets: (1) biological assets or (2) agricultural produce at the point of harvest.
A biological asset (classified as a non-current asset) is a living animal or plant, such as sheep, cows, fruit trees, or cotton plants. Agricultural produce is the harvested product of a biological asset, such as wool from a sheep, milk from a dairy cow, picked fruit from a fruit tree, or cotton from a cotton plant.
Biological assets are measured on initial recognition and at the end of each reporting period at fair value less costs to sell (net realizable value). Companies record a gain or loss due to changes in the net realizable value of biological assets in income when it arises. For example, a gain may arise on initial recognition of a biological asset, such as when a calf is born. A gain or loss may arise on initial recognition of agricultural produce as a result of harvesting. Losses may arise on initial recognition for agricultural assets because costs to sell are deducted in determining fair value less costs to sell.
Agricultural produce (which are harvested from biological assets) are measured at fair value less costs to sell (net realizable value) at the point of harvest. Once harvested, the net realizable value of the agricultural produce becomes its cost, and this asset is accounted for similar to other inventories held for sale in the normal course of business. Measurement at fair value or selling price less point-of-sale costs corresponds to the net realizable value measure in the LCNRV test (selling price less estimated costs to complete and sell) since at harvest, the agricultural product is complete and is ready for sale.
Illustration of Agricultural Accounting at Net Realizable Value
To illustrate the accounting at net realizable value for agricultural assets, assume that Bancroft Dairy produces milk for sale to local cheese-makers. Bancroft began operations on January 1, 2014, by purchasing 420 milking cows for $460,000. Bancroft provides the following information related to the milking cows.
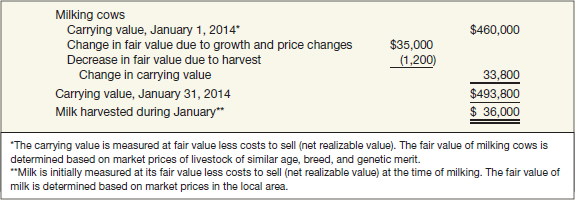
As indicated, the carrying value of the milking cows increased during the month. Part of the change is due to changes in market prices (less costs to sell) for milking cows. The change in market price may also be affected by growth—the increase in value as the cows mature and develop increased milking capacity. At the same time, as mature cows are milked, their milking capacity declines (fair value decrease due to harvest). For example, changes in fair value arising from growth and harvesting from mature cows can be estimated based on changes in market prices of different age cows in the herd.
Bancroft makes the following entry to record the change in carrying value of the milking cows.
![]()
As a result of this entry, Bancroft's statement of financial position reports Biological Asset—Milking Cows as a non-current asset at fair value less costs to sell (net realizable value). In addition, the unrealized gains and losses are reported as other income and expense on the income statement. In subsequent periods at each reporting date, Bancroft continues to report Biological Asset—Milking Cows at net realizable value and records any related unrealized gains or losses in income. Because there is a ready market for the biological assets (milking cows), valuation at net realizable value provides more relevant information about these assets.
In addition to recording the change in the biological asset, Bancroft makes the following summary entry to record the milk harvested for the month of January.
![]()
The milk inventory is recorded at net realizable value at the time it is harvested, and Unrealized Holding Gain or Loss—Income is recognized in income. As with the biological assets, net realizable value is considered the most relevant for purposes of valuation at harvest. What happens to the milk inventory that Bancroft recorded upon harvesting the milk from the cows? Assuming the milk harvested in January was sold to a local cheese-maker for $38,500, Bancroft records the sale as follows.
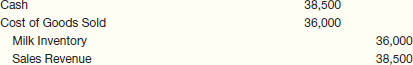
Thus, once harvested, the net realizable value of the harvested milk becomes its cost, and the milk is accounted for similar to other inventories held for sale in the normal course of business.
A final note: Some animals or plants may not be considered biological assets but would be classified and accounted for as other types of assets (not at net realizable value). For example, a pet shop may hold an inventory of dogs purchased from breeders that it then sells. Because the pet shop is not breeding the dogs, these dogs are not considered biological assets. As a result, the dogs are accounted for as inventory held for sale (at LCNRV).
ON THE HORIZON
One issue that will be difficult to resolve relates to the use of the LIFO cost flow assumption. As indicated, IFRS specifically prohibits its use. Conversely, the LIFO cost flow assumption is widely used in the United States because of its favorable tax advantages. In addition, many argue that LIFO from a financial reporting point of view provides a better matching of current costs against revenue and therefore enables companies to compute a more realistic income.
IFRS SELF-TEST QUESTIONS
- All of the following are key similarities between GAAP and IFRS with respect to accounting for inventories except:
(a) costs to include in inventories are similar.
(b) LIFO cost flow assumption where appropriate is used by both sets of standards.
(c) fair value valuation of inventories is prohibited by both sets of standards.
(d) guidelines on ownership of goods are similar.
- All of the following are key differences between GAAP and IFRS with respect to accounting for inventories except the:
(a) definition of the lower-of-cost-or-market test for inventory valuation differs between GAAP and IFRS.
(b) average-cost method is prohibited under IFRS.
(c) inventory basis determination for write-downs differs between GAAP and IFRS.
(d) guidelines are more principles-based under IFRS than they are under GAAP.
- Starfish Company (a company using GAAP and the LIFO inventory method) is considering changing to IFRS and the FIFO inventory method. How would a comparison of these methods affect Starfish's financials?
(a) During a period of inflation, working capital would decrease when IFRS and the FIFO inventory method are used as compared to GAAP and LIFO.
(b) During a period of inflation, the taxes will decrease when IFRS and the FIFO inventory method are used as compared to GAAP and LIFO.
(c) During a period of inflation, net income would be greater if IFRS and the FIFO inventory method are used as compared to GAAP and LIFO.
(d) During a period of inflation, the current ratio would decrease when IFRS and the FIFO inventory method are used as compared to GAAP and LIFO.
- Assume that Darcy Industries had the following inventory values.
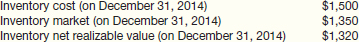
Under IFRS, what is the inventory carrying value on December 31, 2014?
(a) $1,500.
(b) $1,570.
(c) $1,560.
(d) $1,320.
- Under IFRS, agricultural activity results in which of the following types of assets?
I. Agricultural produce
II. Biological assets
(a) I only.
(b) II only.
(c) I and II.
(d) Neither I nor II.
IFRS CONCEPTS AND APPLICATION
IFRS9-1 Briefly describe some of the similarities and differences between GAAP and IFRS with respect to the accounting for inventories.
IFRS9-2 LaTour Inc. is based in France and prepares its financial statements in accordance with IFRS. In 2014, it reported cost of goods sold of $578 million and average inventory of $154 million. Briefly discuss how analysis of LaTour's inventory turnover (and comparisons to a company using GAAP) might be affected by differences in inventory accounting between IFRS and GAAP.
IFRS9-3 Reed Pentak, a finance major, has been following globalization and made the following observation concerning accounting convergence: “I do not see many obstacles concerning development of a single accounting standard for inventories.” Prepare a response to Reed to explain the main obstacle to achieving convergence in the area of inventory accounting.
IFRS9-4 Briefly describe the valuation of (a) biological assets and (b) agricultural produce.
IFRS9-5 In some instances, accounting principles require a departure from valuing inventories at cost alone. Determine the proper unit inventory price in the following cases.
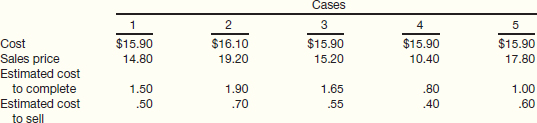
IFRS9-6 Riegel Company uses the LCNRV method, on an individual-item basis, in pricing its inventory items. The inventory at December 31, 2014, consists of products D, E, F, G, H, and I. Relevant per unit data for these products appear below.
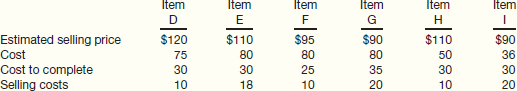
Using the LCNRV rule, determine the proper unit value for statement of financial position reporting purposes at December 31, 2014, for each of the inventory items above.
IFRS9-7 Dover Company began operations in 2014 and determined its ending inventory at cost and at LCNRV at December 31, 2014, and December 31, 2015. This information is presented below.
![]()
(a) Prepare the journal entries required at December 31, 2014, and December 31, 2015, assuming that the inventory is recorded at LCNRV and a perpetual inventory system using the cost-of-goods-sold method is used.
(b) Prepare journal entries required at December 31, 2014, and December 31, 2015, assuming that the inventory is recorded at cost and a perpetual system using the loss method is used.
(c) Which of the two methods above provides the higher net income in each year?
IFRS9-8 Keyser's Fleece Inc. holds a drove of sheep. Keyser shears the sheep on a semiannual basis and then sells the harvested wool into the specialty knitting market. Keyser has the following information related to the shearing sheep at January 1, 2014, and during the first six months of 2014.
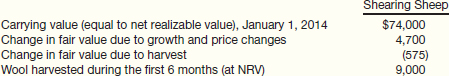
Prepare the journal entry(ies) for Keyser's biological asset (shearing sheep) for the first six months of 2014.
IFRS9-9 Refer to the data in IFRS9-8 for Keyser's Fleece Inc. Prepare the journal entries for (a) the wool harvested in the first six months of 2014, and (b) the wool harvested that is sold for $10,500 in July 2014.
Professional Research
IFRS9-10 Jones Co. is in a technology-intensive industry. Recently, one of its competitors introduced a new product with technology that might render obsolete some of Jones's inventory. The accounting staff wants to follow the appropriate authoritative literature in determining the accounting for this significant market event.
Instructions
Access the IFRS authoritative literature at the IASB website (http://eifrs.iasb.org/). (Click on the IFRS tab and then register for free eIFRS access if necessary.) When you have accessed the documents, you can use the search tool in your Internet browser to respond to the following questions. (Provide paragraph citations.)
(a) Identify the authoritative literature addressing inventory pricing.
(b) List three types of goods that are classified as inventory. What characteristic will automatically exclude an item from being classified as inventory?
(c) Define “net realizable value” as used in the phrase “lower-of-cost-or-net realizable value.”
(d) Explain when it is acceptable to state inventory above cost and which industries allow this practice.
International Financial Reporting Problem
Marks and Spencer plc
IFRS9-11 The financial statements of Marks and Spencer plc (M&S) are available at the book's companion website or can be accessed at http://annualreport.marksandspencer.com/_assets/downloads/Marks-and-Spencer-Annual-report-and-financial-statements-2012.pdf.
Instructions
Refer to M&S's financial statements and the accompanying notes to answer the following questions.
(a) How does M&S value its inventories? Which inventory costing method does M&S use as a basis for reporting its inventories?
(b) How does M&S report its inventories in the statement of financial position? In the notes to its financial statements, what three descriptions are used to classify its inventories?
(c) What costs does M&S include in Inventory and Cost of Sales?
(d) What was M&S's inventory turnover in 2012? What is its gross profit percentage? Evaluate M&S's inventory turnover and its gross profit percentage.
ANSWERS TO IFRS SELF-TEST QUESTIONS
- b
- b
- c
- d
- c
Remember to check the book's companion website to find additional resources for this chapter.
1If a company uses dollar-value LIFO, determining the LIFO cost of an individual item may be more difficult. The company might decide that it is more appropriate to apply the lower-of-cost-or-market rule to the total amount of each pool. The AICPA Task Force on LIFO Inventory Problems concluded that the most reasonable approach to applying the lower-of-cost-or-market provisions to LIFO inventories is to base the determination on reasonable groupings of items. A pool constitutes a reasonable grouping.
2Inventory accounting for financial statement purposes can be different from income tax purposes. For example, companies cannot use the lower-of-cost-or-market rule with LIFO for tax purposes. However, companies may use the lower-of-cost-or-market and LIFO for financial accounting purposes.
3The AICPA Task Force on LIFO Inventory Problems concluded that for LIFO inventories, companies should close the allowance from the prior year and should base the allowance at the end of the year on a new lower-of-cost-or-market computation. [2]
4Manufacturing companies frequently employ a standardized cost system that predetermines the unit costs for material, labor, and manufacturing overhead and that values raw materials, work in process, and finished goods inventories at their standard costs. For financial reporting purposes, it is acceptable to price inventories at standard costs if there is no significant difference between the actual costs and standard costs. If there is a significant difference, companies should adjust the inventory amounts to actual cost. In Accounting Research and Terminology Bulletin, Final Edition, the profession notes that “standard costs are acceptable if adjusted at reasonable intervals to reflect current conditions.” Burlington Industries and Hewlett-Packard use standard costs for valuing at least a portion of their inventories.
5“The Accounting Basis of Inventories,” Accounting Research Study No. 13 (New York: AICPA, 1973) recommends that companies adopt net realizable value. We also should note that companies frequently fail to apply the rules of lower-of-cost-or-market in practice. For example, companies rarely compute and apply the lower limit—net realizable value less a normal markup—because it is a fairly subjective computation. In addition, companies often do not reduce inventory to market unless its disposition is expected to result in a loss. Furthermore, if the net realizable value of finished goods exceeds cost, companies usually assume that both work in process and raw materials do also. In practice, therefore, authoritative literature [3] is considered a guide, and accountants often exercise professional judgment in lieu of following the pronouncements literally.
6One study noted that about 30 percent of public companies have purchase commitments outstanding, with an estimated value of $725 billion (“SEC Staff Report on Off-Balance Sheet Arrangements, Special Purpose Entities, and Related Issues,” http://www.sec.gov/news/studies/soxoffbalancerpt.pdf, June 2005). Purchase commitments are popular because the buyer can secure a supply of inventory at a known price. The seller also benefits in these arrangements by knowing how much to produce.
7There is a long-standing controversy on the accounting in this area. See, for example, Yuji Ijiri, Recognition of Contractual Rights and Obligations, Research Report (Stamford, Conn.: FASB, 1980), who argues that companies should capitalize firm purchase commitments. “Firm” means that it is unlikely that companies can avoid performance under the contract without a severe penalty.
Also, see Mahendra R. Gujarathi and Stanley F. Biggs, “Accounting for Purchase Commitments: Some Issues and Recommendations,” Accounting Horizons (September 1988), pp. 75–78. They conclude, “Recording an asset and liability on the date of inception for the noncancelable purchase commitments is suggested as the first significant step towards alleviating the accounting problems associated with the issue. At year-end, the potential gains and losses should be treated as contingencies which provide a coherent structure for the reporting of such gains and losses.”
8Appendix 17A provides a complete discussion of hedging and the use of derivatives such as futures.
9“Elements of Financial Statements,” Statement of Financial Accounting Concepts No. 6 (Stamford, Conn.: FASB, 1985), paras. 251–253.
10An alternative method of estimating inventory using the gross profit percentage is considered by some to be less complicated than the traditional method. This alternative method uses the standard income statement format as follows. (Assume the same data as in the Cetus example above.)
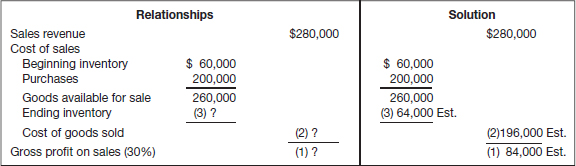
Compute the unknowns as follows: first the gross profit amount, then cost of goods sold, and finally the ending inventory, as shown below.
(1) $280,000 × 30% = $84,000 (gross profit on sales).
(2) $280,000 − $84,000 = $196,000 (cost of goods sold).
(3) $260,000 − $196,000 = $64,000 (ending inventory).
11The terms gross margin percentage, rate of gross profit, and percentage markup are synonymous, although companies more commonly use markup in reference to cost and gross profit in reference to sales.
12This figure is not really market (replacement cost), but it is net realizable value less the normal margin that is allowed. In other words, the sale price of the goods written down is $2, but subtracting a normal margin of 50 percent ($5 cost, $10 price), the figure becomes $1.
13When the purchase allowance is not reflected by a reduction in the selling price, no adjustment is made to the retail column.
14Note that if employee sales are recorded gross, no adjustment is necessary for employee discounts in the retail column.
15Changing from the conventional retail method to LIFO retail represents a change in accounting principle. We provide an expanded discussion of accounting principle changes in Chapter 22.
16A logical question to ask is, “Why are only the purchases from the prior period considered and not also the beginning inventory?” Apparently, the IRS believes that “the purchases-only approach” provides a more reasonable cost basis. The IRS position is debatable. However, for our purposes, it seems appropriate to use the purchases-only approach.