
CHAPTER 8 Valuation of Inventories: A Cost-Basis Approach
LEARNING OBJECTIVES
After studying this chapter, you should be able to:
- Identify major classifications of inventory.
- Distinguish between perpetual and periodic inventory systems.
- Determine the goods included in inventory and the effects of inventory errors on the financial statements.
- Understand the items to include as inventory cost.
- Describe and compare the cost flow assumptions used to account for inventories.
- Explain the significance and use of a LIFO reserve.
- Understand the effect of LIFO liquidations.
- Explain the dollar-value LIFO method.
- Identify the major advantages and disadvantages of LIFO.
- Understand why companies select given inventory methods.
To Switch or Not to Switch
Many companies use the last-in, first-out (LIFO) cost flow assumption in the accounting for inventories. LIFO has a lot going for it in terms of tax savings and providing an income number that better reflects the gross profit associated with inventories with different historical costs. However, in the wake of international convergence discussions (LIFO is not permitted under IFRS) and tax policy debates (LIFO is one of a number of “tax loopholes” that if closed could help address our budget and deficit challenges), more companies are seriously considering the switch from LIFO to first-in, first-out (FIFO) or average-cost inventory methods. For example, of the 449 large public companies surveyed by the AICPA in 2012, just 163 indicated LIFO use (a 25% decline relative to 2001). Here are some of the reasons to support the switch from LIFO.
- While many believe that LIFO provides a more useful income measure, other methods, such as FIFO and average-cost, better reflect the current value of inventory on the balance sheet.
- Many companies discontinued LIFO use to support uniformity of inventory valuation across operations. That is, companies were using LIFO in their U.S. operations but FIFO and/or average-cost in international units. The switch from LIFO simplifies the external reporting for these multinational companies.
- There is also a “bandwagon” effect—when some companies make the switch, their peers likely follow suit to enhance comparability for financial statement users.
- The recent periods of low inflation have resulted in less significant tax benefits associated with LIFO use. That is, in times of rising costs, by expensing the most recently purchased items, cost of goods sold is higher (compared to FIFO or average-cost) and taxable income is lower. A number of companies do not believe the smaller tax benefits of LIFO offset the costs. For example, Kraft Foods switched from LIFO to average-cost in 2009, noting that in the recent stable price environment, its cost of goods sold was $95 million higher under average-cost.
- See the Underlying Concepts on pages 422, 425, and 427.
- Read the Evolving Issue on page 445 for a discussion of LIFO.
![]() INTERNATIONAL FOCUS
INTERNATIONAL FOCUS
- See the International Perspectives on pages 421, 426, 429, 431, and 444.
- IFRS Insights related to inventory are presented in Chapter 9 on pages 525–534.
- Finally, the companies most resistant to make the switch from LIFO are those with large inventory balances. That is, the higher the inventory balance, the higher the additional tax payment will be upon the switch to FIFO. However, a growing number of companies have implemented just-in-time (JIT) or other lean manufacturing techniques, under which much lower inventories are kept on hand. In the extreme, JIT leads to zero inventory and no LIFO effect relative to other methods. For example, JCPenney recently switched from LIFO to FIFO in the same period that it rolled out its “Door-to-Floor” lean inventory strategy. As a result, the accounting effect of the change to FIFO was immaterial.
The merits of LIFO use (about which you will learn more in this chapter) are many. However, these benefits appear to be waning. We expect more companies to weigh a voluntary switch away from LIFO in the future.
Source: Adapted from L. Hughes, J. Livingstone, and D. Upton, “Switching from LIFO: Strategies for Change,” The CPA Journal (April 2011), pp. 26–29.
PREVIEW OF CHAPTER 8
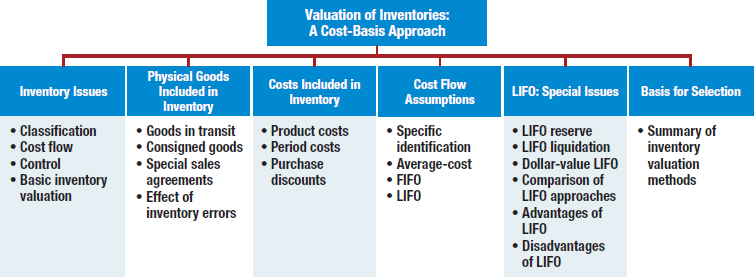
As our opening story indicates, the accounting choice related to inventory is affected by operating strategies, tax consequences, and is important for providing information that is useful for predicting financial performance. In this chapter, we discuss the basic issues related to accounting and reporting for inventory. The content and organization of the chapter are as follows.
INVENTORY ISSUES
Classification
Inventories are asset items that a company holds for sale in the ordinary course of business, or goods that it will use or consume in the production of goods to be sold. The description and measurement of inventory require careful attention. The investment in inventories is frequently the largest current asset of merchandising (retail) and manufacturing businesses.
A merchandising concern, such as Wal-Mart Stores, Inc., usually purchases its merchandise in a form ready for sale. It reports the cost assigned to unsold units left on hand as merchandise inventory. Only one inventory account, Inventory, appears in the financial statements.
Manufacturing concerns, on the other hand, produce goods to sell to merchandising firms. Many of the largest U.S. businesses are manufacturers, such as Boeing, IBM, ExxonMobil, Procter & Gamble, Ford, and Motorola. Although the products they produce may differ, manufacturers normally have three inventory accounts—Raw Materials, Work in Process, and Finished Goods.
A company reports the cost assigned to goods and materials on hand but not yet placed into production as raw materials inventory. Raw materials include the wood to make a baseball bat or the steel to make a car. These materials can be traced directly to the end product.
At any point in a continuous production process, some units are only partially processed. The cost of the raw material for these unfinished units, plus the direct labor cost applied specifically to this material and a ratable share of manufacturing overhead costs, constitute the work in process inventory.
Companies report the costs identified with the completed but unsold units on hand at the end of the fiscal period as finished goods inventory. Illustration 8-1 contrasts the financial statement presentation of inventories of Wal-Mart Stores, Inc. (a merchandising company) with those of Sherwin-Williams Company (a manufacturing company.) The remainder of the balance sheet is essentially similar for the two types of companies.
ILLUSTRATION 8-1 Comparison of Presentation of Current Assets for Merchandising and Manufacturing Companies
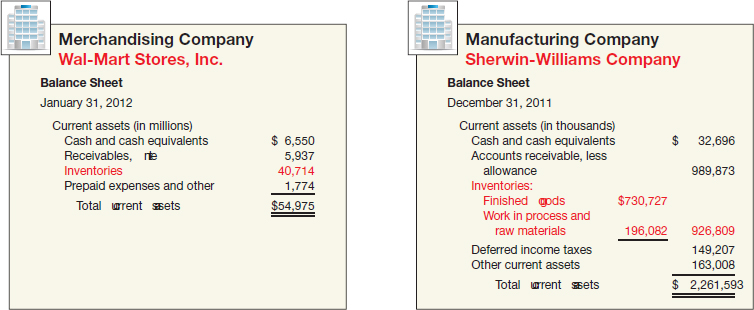
A manufacturing company like Sherwin-Williams also might include a Manufacturing or Factory Supplies Inventory account. In it, Sherwin-Williams would include such items as machine oils, nails, cleaning material, and the like—supplies that are used in production but are not the primary materials being processed.
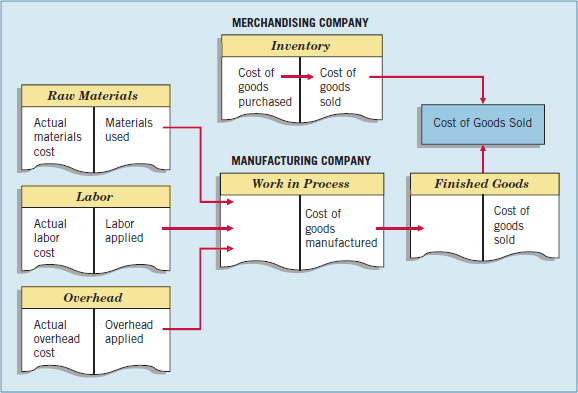
Illustration 8-2 shows the differences in the flow of costs through a merchandising company and a manufacturing company.
Inventory Cost Flow
LEARNING OBJECTIVE ![]()
Distinguish between perpetual and periodic inventory systems.
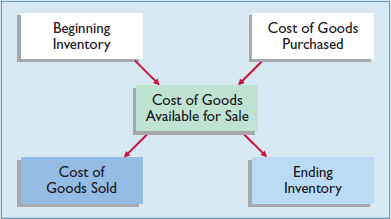
Companies that sell or produce goods report inventory and cost of goods sold at the end of each accounting period. The flow of costs for a company is as follows. Beginning inventory plus the cost of goods purchased is the cost of goods available for sale. As goods are sold, they are assigned to cost of goods sold. Those goods that are not sold by the end of the accounting period represent ending inventory. Illustration 8-3 describes these relationships.
Companies use one of two types of systems for maintaining accurate inventory records for these costs—the perpetual system or the periodic system.
Perpetual System
A perpetual inventory system continuously tracks changes in the Inventory account. That is, a company records all purchases and sales (issues) of goods directly in the Inventory account as they occur. The accounting features of a perpetual inventory system are as follows.
- Purchases of merchandise for resale or raw materials for production are debited to Inventory rather than to Purchases.
- Freight-in is debited to Inventory, not Purchases. Purchase returns and allowances and purchase discounts are credited to Inventory rather than to separate accounts.
- Cost of goods sold is recorded at the time of each sale by debiting Cost of Goods Sold and crediting Inventory.
- A subsidiary ledger of individual inventory records is maintained as a control measure. The subsidiary records show the quantity and cost of each type of inventory on hand.
The perpetual inventory system provides a continuous record of the balances in both the Inventory account and the Cost of Goods Sold account.
Periodic System
Under a periodic inventory system, a company determines the quantity of inventory on hand only periodically, as the name implies. It records all acquisitions of inventory during the accounting period by debiting the Purchases account. A company then adds the total in the Purchases account at the end of the accounting period to the cost of the inventory on hand at the beginning of the period. This sum determines the total cost of the goods available for sale during the period.
To compute the cost of goods sold, the company then subtracts the ending inventory from the cost of goods available for sale. Note that under a periodic inventory system, the cost of goods sold is a residual amount that depends on a physical count of ending inventory. This process is referred to as “taking a physical inventory.” Companies that use the periodic system take a physical inventory at least once a year.
Comparing Perpetual and Periodic Systems
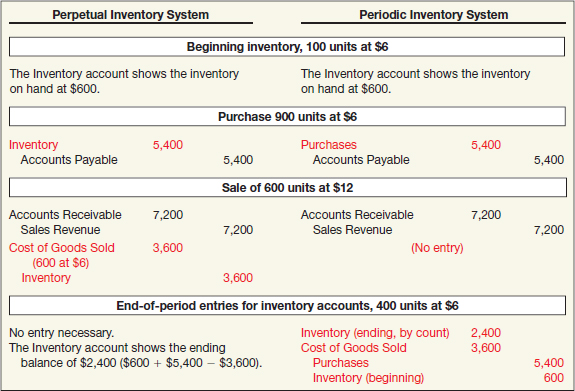
To illustrate the difference between a perpetual and a periodic system, assume that Fesmire Company had the following transactions during the current year.

Fesmire records these transactions during the current year as shown in Illustration 8-4.
When a company uses a perpetual inventory system and a difference exists between the perpetual inventory balance and the physical inventory count, it needs a separate entry to adjust the perpetual inventory account. To illustrate, assume that at the end of the reporting period, the perpetual inventory account reported an inventory balance of $4,000. However, a physical count indicates inventory of $3,800 is actually on hand. The entry to record the necessary write-down is as follows.
![]()
Perpetual inventory overages and shortages generally represent a misstatement of cost of goods sold. The difference results from normal and expected shrinkage, breakage, shoplifting, incorrect recordkeeping, and the like. Inventory Over and Short therefore adjusts Cost of Goods Sold. In practice, companies sometimes report Inventory Over and Short in the “Other revenues and gains” or “Other expenses and losses” section of the income statement.
Note that a company using the periodic inventory system does not report the account Inventory Over and Short. The reason: The periodic method does not have accounting records against which to compare the physical count. As a result, a company buries inventory overages and shortages in cost of goods sold.
Inventory Control
For various reasons, management is vitally interested in inventory planning and control. Whether a company manufactures or merchandises goods, it needs an accurate accounting system with up-to-date records. It may lose sales and customers if it does not stock products in the desired style, quality, and quantity. Further, companies must monitor inventory levels carefully to limit the financing costs of carrying large amounts of inventory.
In a perfect world, companies would like a continuous record of both their inventory levels and their cost of goods sold. The popularity and affordability of accounting software makes the perpetual system cost-effective for many kinds of businesses. Companies like Target, Best Buy, and Sears Holdings now incorporate the recording of sales with optical scanners at the cash register into perpetual inventory systems.
However, many companies cannot afford a complete perpetual system. But, most of these companies need current information regarding their inventory levels, to protect against stock-outs or overpurchasing, and to aid in preparation of monthly or quarterly financial data. As a result, these companies use a modified perpetual inventory system. This system provides detailed inventory records of increases and decreases in quantities only—not dollar amounts. It is merely a memorandum device outside the double-entry system, which helps in determining the level of inventory at any point in time.
Whether a company maintains a complete perpetual inventory in quantities and dollars or a modified perpetual inventory system, it probably takes a physical inventory once a year. No matter what type of inventory records companies use, they all face the danger of loss and error. Waste, breakage, theft, improper entry, failure to prepare or record requisitions, and other similar possibilities may cause the inventory records to differ from the actual inventory on hand. Thus, all companies need periodic verification of the inventory records by actual count, weight, or measurement, with the counts compared with the detailed inventory records. As indicated earlier, a company corrects the records to agree with the quantities actually on hand.
Insofar as possible, companies should take the physical inventory near the end of their fiscal year, to properly report inventory quantities in their annual accounting reports. Because this is not always possible, however, physical inventories taken within two or three months of the year's end are satisfactory if a company maintains detailed inventory records with a fair degree of accuracy.1
What do the numbers mean? STAYING LEAN
Wal-Mart Stores, Inc. uses its buying power in the supply chain to purchase an increasing proportion of its goods directly from manufacturers and on a combined basis across geographic borders. Wal-Mart estimates that it saves 5–15% across its supply chain by implementing direct purchasing on a combined basis for the 15 countries in which it operates. Thus, Wal-Mart has a good handle on what products it needs to stock, and it gets the best prices when it purchases.
Wal-Mart also provides a classic example of the use of tight inventory controls. Department managers use a scanner that when placed over the bar code corresponding to a particular item, will tell them how many of the items the store sold yesterday, last week, and over the same period last year. It will tell them how many of those items are in stock, how many are on the way, and how many the neighboring Walmart stores are carrying (in case one store runs out). Wal-Mart's inventory management practices have helped it become one of the top-ranked companies on the Fortune 500 in terms of sales.
Source: J. Birchall, “Walmart Aims to Cut Supply Chain Cost,” Financial Times (January 4, 2010).
Basic Issues in Inventory Valuation
Goods sold (or used) during an accounting period seldom correspond exactly to the goods bought (or produced) during that period. As a result, inventories either increase or decrease during the period. Companies must then allocate the cost of all the goods available for sale (or use) between the goods that were sold or used and those that are still on hand. The cost of goods available for sale or use is the sum of (1) the cost of the goods on hand at the beginning of the period, and (2) the cost of the goods acquired or produced during the period. The cost of goods sold is the difference between (1) the cost of goods available for sale during the period, and (2) the cost of goods on hand at the end of the period. Illustration 8-5 shows these calculations.

Valuing inventories can be complex. It requires determining the following.
![]() International Perspective
International Perspective
Who owns the goods, as well as the costs to include in inventory, are essentially accounted for the same under IFRS and GAAP.
- The physical goods to include in inventory (who owns the goods?—goods in transit, consigned goods, special sales agreements).
- The costs to include in inventory (product vs. period costs).
- The cost flow assumption to adopt (specific identification, average-cost, FIFO, LIFO, retail, etc.)
We explore these basic issues in the next three sections.
PHYSICAL GOODS INCLUDED IN INVENTORY
LEARNING OBJECTIVE ![]()
Determine the goods included in inventory and the effects of inventory errors on the financial statements.
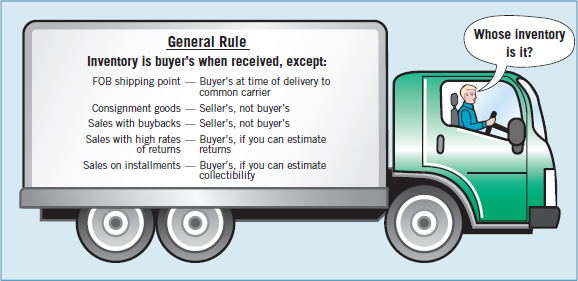
Technically, a company should record purchases when it obtains legal title to the goods. In practice, however, a company records acquisitions when it receives the goods. Why? Because it is difficult to determine the exact time of legal passage of title for every purchase. In addition, no material error likely results from such a practice if consistently applied. Illustration 8-6 indicates the general guidelines companies use in evaluating whether the seller or buyer reports an item as inventory. Exceptions to the general guidelines can arise for goods in transit and consigned goods.
Goods in Transit
Sometimes purchased merchandise remains in transit—not yet received—at the end of a fiscal period. The accounting for these shipped goods depends on who owns them. For example, a company like Walgreens determines ownership by applying the “passage of title” rule. If a supplier ships goods to Walgreens f.o.b. shipping point, title passes to Walgreens when the supplier delivers the goods to the common carrier, who acts as an agent for Walgreens. (The abbreviation f.o.b. stands for free on board.) If the supplier ships the goods f.o.b. destination, title passes to Walgreens only when it receives the goods from the common carrier. “Shipping point” and “destination” are often designated by a particular location, for example, f.o.b. Denver.
When Walgreens obtains legal title to goods, it must record them as purchases in that fiscal period, assuming a periodic inventory system. Thus, goods shipped to Walgreens f.o.b. shipping point, but in transit at the end of the period, belong to Walgreens. It should show the purchase in its records because legal title to these goods passed to Walgreens upon shipment of the goods. To disregard such purchases results in understating inventories and accounts payable in the balance sheet, and understating purchases and ending inventories in the income statement.
Consigned Goods
Companies market certain products through a consignment shipment. Under this arrangement, a company like Williams’ Art Gallery (the consignor) ships various art merchandise to Sotheby's Holdings (the consignee), who acts as Williams’ agent in selling the consigned goods. Sotheby's agrees to accept the goods without any liability, except to exercise due care and reasonable protection from loss or damage, until it sells the goods to a third party. When Sotheby's sells the goods, it remits the revenue, less a selling commission and expenses incurred in accomplishing the sale, to Williams.
Goods out on consignment remain the property of the consignor (Williams in the example above). Williams thus includes the goods in its inventory at purchase price or production cost. Occasionally, and only for a significant amount, the consignor shows the inventory out on consignment as a separate item. Sometimes a consignor reports the inventory on consignment in the notes to the financial statements. For example, Eagle Clothes, Inc. reported the following related to consigned goods: “Inventories consist of finished goods shipped on consignment to customers of the Company's subsidiary April-Marcus, Inc.”
The consignee makes no entry to the inventory account for goods received. Remember, these goods remain the property of the consignor until sold. In fact, the consignee should be extremely careful not to include any of the goods consigned as a part of inventory.
Special Sales Agreements
As we indicated earlier, transfer of legal title is the general guideline used to determine whether a company should include an item in inventory. Unfortunately, transfer of legal title and the underlying substance of the transaction often do not match. For example, legal title may have passed to the purchaser, but the seller of the goods retains the risks of ownership. Conversely, transfer of legal title may not occur, but the economic substance of the transaction is such that the seller no longer retains the risks of ownership.
Two special sales situations are illustrated here to indicate the types of problems companies encounter in practice:
- Sales with buyback agreement.
- Sales with high rates of return.
Sales with Buyback Agreement
Sometimes an enterprise finances its inventory without reporting either the liability or the inventory on its balance sheet. This approach, often referred to as a product financing arrangement, usually involves a “sale” with either an implicit or explicit “buyback” agreement.
![]() Underlying Concepts
Underlying Concepts
Recognizing revenue at the time the inventory is “parked” violates the revenue recognition principle. That is, a performance obligation is met when the risks and rewards of ownership are transferred to the buyer.
To illustrate, Hill Enterprises transfers (“sells”) inventory to Chase, Inc. and simultaneously agrees to repurchase this merchandise at a specified price over a specified period of time. Chase then uses the inventory as collateral and borrows against it. Chase uses the loan proceeds to pay Hill, which repurchases the inventory in the future. Chase employs the proceeds from repayment to meet its loan obligation.
The essence of this transaction is that Hill Enterprises is financing its inventory—and retaining risk of ownership—even though it transferred to Chase technical legal title to the merchandise. By structuring a transaction in this manner, Hill avoids personal property taxes in certain states. Other advantages of this transaction for Hill are the removal of the current liability from its balance sheet and the ability to manipulate income. For Chase, the purchase of the goods may solve a LIFO liquidation problem (discussed later), or Chase may enter into a similar reciprocal agreement at a later date.
![]() See the FASB Codification section (page 449).
See the FASB Codification section (page 449).
These arrangements are often described in practice as “parking transactions.” In this situation, Hill simply parks the inventory on Chase's balance sheet for a short period of time. Generally, when a repurchase agreement exists, Hill should report the inventory and related liability on its books. [1] The reason? Hill has retained the risks and rewards of ownership.
Sales with High Rates of Return
In industries such as publishing, music, toys, and sporting goods, formal or informal agreements often exist that permit purchasers to return inventory for a full or partial refund.
To illustrate, Quality Publishing Company sells textbooks to Campus Bookstores with an agreement that Campus may return for full credit any books not sold. Historically, Campus Bookstores returned approximately 25 percent of the textbooks from Quality Publishing. How should Quality Publishing report its sales transactions?
One alternative is to record the sale at the full amount and establish an estimated sales returns and allowances account until the return period has expired. A second possibility is to not record any sales until circumstances indicate the amount of inventory the buyer will return. The key question is: Under what circumstances should Quality Publishing consider the inventory sold? The answer is that when Quality Publishing can reasonably estimate the amount of returns, it should consider the goods sold but establish a return liability for the amount of the estimated returns. Conversely, if returns are unpredictable, Quality Publishing should not consider the goods sold and it should not remove the goods from its inventory. [2]
What do the numbers mean? NO PARKING!
In one of the more elaborate accounting frauds, employees at Kurzweil Applied Intelligence Inc. booked millions of dollars in phony inventory sales during a two-year period that straddled two audits and an initial public stock offering. They dummied up phony shipping documents and logbooks to support bogus sales transactions. Then they shipped high-tech equipment, not to customers, but to a public warehouse for “temporary” storage, where some of it sat for 17 months. (Kurzweil still had ownership.)
To foil auditors’ attempts to verify the existence of the inventory, Kurzweil employees moved the goods from warehouse to warehouse. To cover the fraudulently recorded sales transactions as auditors closed in, the employees brought back the still-hidden goods, under the pretense that the goods were returned by customers. When auditors uncovered the fraud, the bottom dropped out of Kurzweil's stock.
Similar inventory shenanigans occurred at Delphi, which used side-deals with third parties to get inventory off its books and to record sales. The overstatement in income eventually led to a bankruptcy filing for Delphi.
More recently and with an international twist, concerns about inventory shenanigans are surfacing in China. Following years of torrid growth, the global economic slowdown has resulted in a huge buildup of unsold goods that is cluttering shop floors, clogging car dealerships, and filling factory warehouses. The large inventory overhang is raising alarms about phantom profits and suspect economic data coming out of China.
Sources: Adapted from “Anatomy of a Fraud,” BusinessWeek (September 16, 1996), pp. 90–94; J. McCracken, “Delphi Executives Named in Suit over Inventory Practices,” Wall Street Journal (May 5, 2005), p. A3; and K. Bradsher, “China Confronts Mounting Piles of Unsold Goods,” New York Times (August 23, 2012).
Effect of Inventory Errors
Items incorrectly included or excluded in determining cost of goods sold through inventory misstatements will result in errors in the financial statements. Let's look at two cases, assuming a periodic inventory system.
Ending Inventory Misstated
What would happen if IBM correctly records its beginning inventory and purchases, but fails to include some items in ending inventory? In this situation, we would have the following effects on the financial statements at the end of the period.
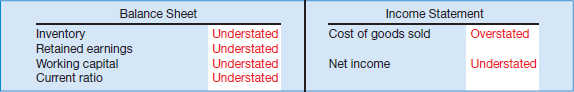
If ending inventory is understated, working capital (current assets less current liabilities) and the current ratio (current assets divided by current liabilities) are understated. If cost of goods sold is overstated, then net income is understated.
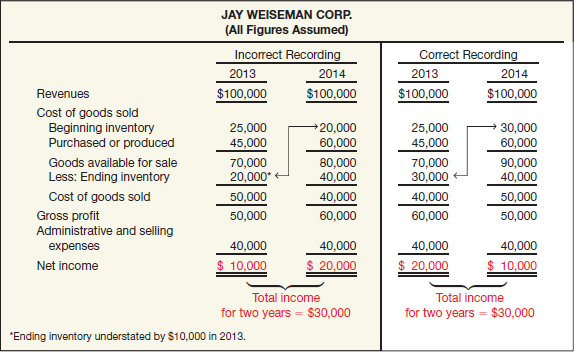
To illustrate the effect on net income over a two-year period (2013–2014), assume that Jay Weiseman Corp. understates its ending inventory by $10,000 in 2013; all other items are correctly stated. The effect of this error is to decrease net income in 2013 and to increase net income in 2014. The error is counterbalanced (offset) in 2014 because beginning inventory is understated and net income is overstated. As Illustration 8-8 shows, the income statement misstates the net income figures for both 2013 and 2014 although the total for the two years is correct.
If Weiseman overstates ending inventory in 2013, the reverse effect occurs. Inventory, working capital, current ratio, and net income are overstated, and cost of goods sold is understated. The effect of the error on net income will be counterbalanced in 2014, but the income statement misstates both years’ net income figures.
Purchases and Inventory Misstated
Suppose that Bishop Company does not record as a purchase certain goods that it owns and does not count them in ending inventory. The effect on the financial statements (assuming this is a purchase on account) is as follows.
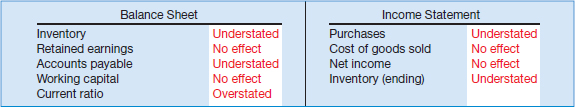
Omission of goods from purchases and inventory results in an understatement of inventory and accounts payable in the balance sheet. It also results in an understatement of purchases and ending inventory in the income statement. However, the omission of such goods does not affect net income for the period. Why not? Because Bishop understates both purchases and ending inventory by the same amount—the error is thereby offset in cost of goods sold. Total working capital is unchanged, but the current ratio is overstated because of the omission of equal amounts from inventory and accounts payable.
To illustrate the effect on the current ratio, assume that Bishop understated accounts payable and ending inventory by $40,000. Illustration 8-10 shows the understated and correct data.
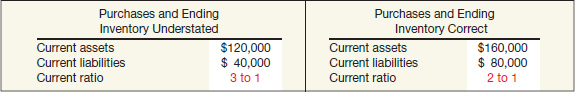
The understated data indicate a current ratio of 3 to 1, whereas the correct ratio is 2 to 1. Thus, understatement of accounts payable and ending inventory can lead to a “window-dressing” of the current ratio. That is, Bishop can make the current ratio appear better than it is.
![]() Underlying Concepts
Underlying Concepts
When inventory is misstated, its presentation is not representationally faithful.
If Bishop overstates both purchases (on account) and ending inventory, then the effects on the balance sheet are exactly the reverse. The financial statements overstate inventory and accounts payable, and understate the current ratio. The overstatement does not affect cost of goods sold and net income because the errors offset one another. Similarly, working capital is not affected.
We cannot overemphasize the importance of proper inventory measurement in presenting accurate financial statements. For example, Leslie Fay, a women's apparel maker, had accounting irregularities that wiped out one year's net income and caused a restatement of the prior year's earnings. One reason: It inflated inventory and deflated cost of goods sold. Anixter Bros. Inc. had to restate its income by $1.7 million because an accountant in the antenna manufacturing division overstated the ending inventory, thereby reducing its cost of sales. Similarly, AM International allegedly recorded as sold products that were only being rented. As a result, inaccurate inventory and sales figures inappropriately added $7.9 million to pretax income.
COSTS INCLUDED IN INVENTORY
LEARNING OBJECTIVE ![]()
Understand the items to include as inventory cost.
One of the most important problems in dealing with inventories concerns the dollar amount at which to carry the inventory in the accounts. Companies generally account for the acquisition of inventories, like other assets, on a cost basis.
Product Costs
Product costs are those costs that “attach” to the inventory. As a result, a company records product costs in the inventory account. These costs are directly connected with bringing the goods to the buyer's place of business and converting such goods to a salable condition. Such charges include freight charges on goods purchased, other direct costs of acquisition, and labor and other production costs incurred in processing the goods up to the time of sale.
It seems proper also to allocate to inventories a share of any buying costs or expenses of a purchasing department, storage costs, and other costs incurred in storing or handling the goods before their sale. However, because of the practical difficulties involved in allocating such costs and expenses, companies usually exclude these items in valuing inventories.
A manufacturing company's costs include direct materials, direct labor, and manufacturing overhead costs. Manufacturing overhead costs include indirect materials, indirect labor, and various costs, such as depreciation, taxes, insurance, and heat and electricity.
Period Costs
Period costs are those costs that are indirectly related to the acquisition or production of goods. Period costs such as selling expenses and, under ordinary circumstances, general and administrative expenses are therefore not included as part of inventory cost.
![]() International Perspective
International Perspective
GAAP has more detailed rules related to the accounting for inventories, compared to IFRS.
Yet, conceptually, these expenses are as much a cost of the product as the initial purchase price and related freight charges attached to the product. Why then do companies exclude these costs from inventoriable items? Because companies generally consider selling expenses as more directly related to the cost of goods sold than to the unsold inventory. In addition, period costs, especially administrative expenses, are so unrelated or indirectly related to the immediate production process that any allocation is purely arbitrary.2
Interest is another period cost. Companies usually expense interest costs associated with getting inventories ready for sale. Supporters of this approach argue that interest costs are really a cost of financing. Others contend that interest costs incurred to finance activities associated with readying inventories for sale are as much a cost of the asset as materials, labor, and overhead. Therefore, they reason, companies should capitalize interest costs.
The FASB ruled that companies should capitalize interest costs related to assets constructed for internal use or assets produced as discrete projects (such as ships or real estate projects) for sale or lease [4].3 The FASB emphasized that these discrete projects should take considerable time, entail substantial expenditures, and be likely to involve significant amounts of interest cost. A company should not capitalize interest costs for inventories that it routinely manufactures or otherwise produces in large quantities on a repetitive basis. In this case, the informational benefit does not justify the cost.
Treatment of Purchase Discounts
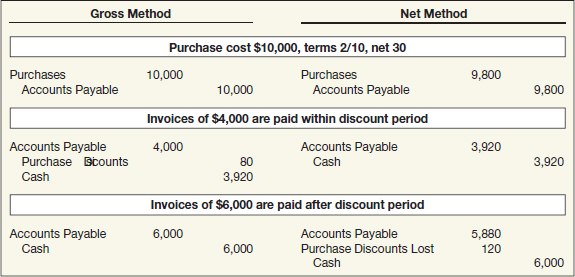
The use of a Purchase Discounts account in a periodic inventory system indicates that the company is reporting its purchases and accounts payable at the gross amount. If a company uses this gross method, it reports purchase discounts as a deduction from purchases on the income statement.
Another approach is to record the purchases and accounts payable at an amount net of the cash discounts. In this approach, the company records failure to take a purchase discount within the discount period in a Purchase Discounts Lost account. If a company uses this net method, it considers purchase discounts lost as a financial expense and reports it in the “Other expenses and losses” section of the income statement. This treatment is considered better for two reasons. (1) It provides a correct reporting of the cost of the asset and related liability. (2) It can measure management inefficiency by holding management responsible for discounts not taken.
To illustrate the difference between the gross and net methods, assume the following transactions.
![]() Underlying Concepts
Underlying Concepts
Not using the net method because of resultant difficulties is an example of the application of the cost constraint.
Many believe that the somewhat more complicated net method is not justified by the resulting benefits. This could account for the widespread use of the less logical but simpler gross method. In addition, some contend that management is reluctant to report in the financial statements the amount of purchase discounts lost.
What do the numbers mean? YOU MAY NEED A MAP
Does it really matter where a company reports certain costs in its income statement as long as it includes them all as expenses in computing income?
For e-tailers, such as Amazon.com or Drugstore.com, where they report certain selling costs does appear to be important. Contrary to well-established retailer practices, these companies insist on reporting some selling costs—fulfillment costs related to inventory shipping and warehousing—as part of administrative expenses, instead of as cost of goods sold. This practice is allowable within GAAP, if applied consistently and adequately disclosed. Although the practice doesn't affect the bottom line, it does make the e-tailers’ gross margins look better. For example, at one time Amazon reported $265 million of these costs in one quarter. Some experts thought Amazon should include those charges in costs of goods sold, which would substantially lower its gross profit, as shown below (in millions).
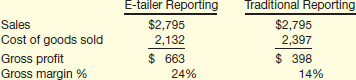
Similarly, if Drugstore.com and eToys.com made similar adjustments, their gross margins would go from positive to negative.
Thus, if you want to be able to compare the operating results of e-tailers to other traditional retailers, it might be a good idea to have a good accounting map in order to navigate their income statements and how they report certain selling costs.
Source: Adapted from P. Elstrom, “The End of Fuzzy Math?” BusinessWeek, e.Biz—Net Worth (December 11, 2000). According to GAAP [5], companies must disclose the accounting policy for classifying these selling costs in income.
WHICH COST FLOW ASSUMPTION TO ADOPT?
LEARNING OBJECTIVE ![]()
Describe and compare the cost flow assumptions used to account for inventories.
During any given fiscal period, companies typically purchase merchandise at several different prices. If a company prices inventories at cost and it made numerous purchases at different unit costs, which cost price should it use? Conceptually, a specific identification of the given items sold and unsold seems optimal. But this measure often proves both expensive and impossible to achieve. Consequently, companies use one of several systematic inventory cost flow assumptions.
Indeed, the actual physical flow of goods and the cost flow assumption often greatly differ. There is no requirement that the cost flow assumption adopted be consistent with the physical movement of goods. A company's major objective in selecting a method should be to choose the one that, under the circumstances, most clearly reflects periodic income. [6]
To illustrate, assume that Call-Mart Inc. had the following transactions in its first month of operations.
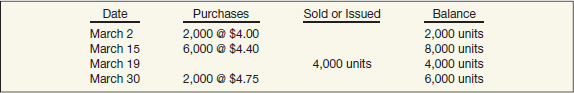
From this information, Call-Mart computes the ending inventory of 6,000 units and the cost of goods available for sale (beginning inventory + purchases) of $43,900 [(2,000 at $4.00) + (6,000 at $4.40) + (2,000 at $4.75)]. The question is, which price or prices should it assign to the 6,000 units of ending inventory? The answer depends on which cost flow assumption it uses.
Specific Identification
Specific identification calls for identifying each item sold and each item in inventory. A company includes in cost of goods sold the costs of the specific items sold. It includes in inventory the costs of the specific items on hand. This method may be used only in instances where it is practical to separate physically the different purchases made. As a result, most companies only use this method when handling a relatively small number of costly, easily distinguishable items. In the retail trade, this includes some types of jewelry, fur coats, automobiles, and some furniture. In manufacturing, it includes special orders and many products manufactured under a job cost system.
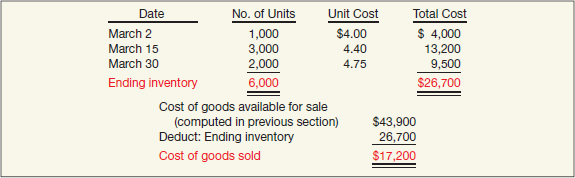
To illustrate, assume that Call-Mart Inc.'s 6,000 units of inventory consists of 1,000 units from the March 2 purchase, 3,000 from the March 15 purchase, and 2,000 from the March 30 purchase. Illustration 8-12 shows how Call-Mart computes the ending inventory and cost of goods sold.
This method appears ideal. Specific identification matches actual costs against actual revenue. Thus, a company reports ending inventory at actual cost. In other words, under specific identification the cost flow matches the physical flow of the goods. On closer observation, however, this method has certain deficiencies.
![]() International Perspective
International Perspective
IFRS indicates specific identification is the preferred inventory method, unless it is impracticable to use.
Some argue that specific identification allows a company to manipulate net income. For example, assume that a wholesaler purchases identical plywood early in the year at three different prices. When it sells the plywood, the wholesaler can select either the lowest or the highest price to charge to expense. It simply selects the plywood from a specific lot for delivery to the customer. A business manager, therefore, can manipulate net income by delivering to the customer the higher- or lower-priced item, depending on whether the company seeks lower or higher reported earnings for the period.
Another problem relates to the arbitrary allocation of costs that sometimes occurs with specific inventory items. For example, a company often faces difficulty in relating shipping charges, storage costs, and discounts directly to a given inventory item. This results in allocating these costs somewhat arbitrarily, leading to a “breakdown” in the precision of the specific identification method.4
Average-Cost
As the name implies, the average-cost method prices items in the inventory on the basis of the average cost of all similar goods available during the period. To illustrate use of the periodic inventory method (amount of inventory computed at the end of the period), Call-Mart computes the ending inventory and cost of goods sold using a weighted-average method as follows.
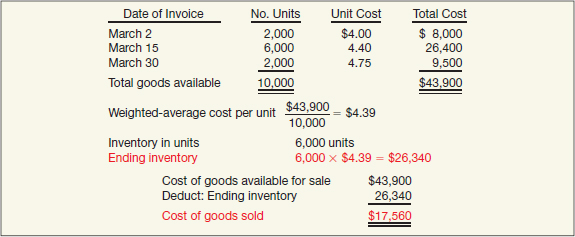
In computing the average cost per unit, Call-Mart includes the beginning inventory, if any, both in the total units available and in the total cost of goods available.
Companies use the moving-average method with perpetual inventory records. Illustration 8-14 shows the application of the average-cost method for perpetual records.
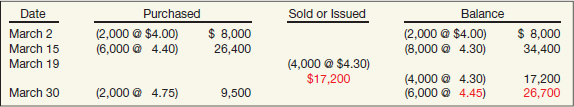
In this method, Call-Mart computes a new average unit cost each time it makes a purchase. For example, on March 15, after purchasing 6,000 units for $26,400, Call-Mart has 8,000 units costing $34,400 ($8,000 plus $26,400) on hand. The average unit cost is $34,400 divided by 8,000, or $4.30. Call-Mart uses this unit cost in costing withdrawals until it makes another purchase. At that point, Call-Mart computes a new average unit cost. Accordingly, the company shows the cost of the 4,000 units withdrawn on March 19 at $4.30, for a total cost of goods sold of $17,200. On March 30, following the purchase of 2,000 units for $9,500, Call-Mart determines a new unit cost of $4.45, for an ending inventory of $26,700.
Companies often use average-cost methods for practical rather than conceptual reasons. These methods are both simple to apply and objective. They are not as subject to income manipulation as some of the other inventory pricing methods. In addition, proponents of the average-cost methods reason that measuring a specific physical flow of inventory is often impossible. Therefore, it is better to cost items on an average-price basis. This argument is particularly persuasive when dealing with similar inventory items.
First-In, First-Out (FIFO)
The FIFO (first-in, first-out) method assumes that a company uses goods in the order in which it purchases them. In other words, the FIFO method assumes that the first goods purchased are the first used (in a manufacturing concern) or the first sold (in a merchandising concern). The inventory remaining must therefore represent the most recent purchases.
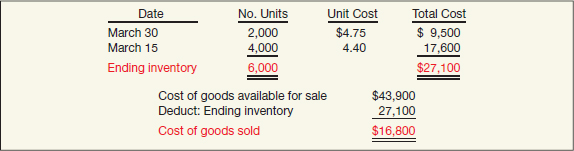
To illustrate, assume that Call-Mart uses the periodic inventory system. It determines its cost of the ending inventory by taking the cost of the most recent purchase and working back until it accounts for all units in the inventory. Call-Mart determines its ending inventory and cost of goods sold as shown in Illustration 8-15.
If Call-Mart instead uses a perpetual inventory system in quantities and dollars, it attaches a cost figure to each withdrawal. Then the cost of the 4,000 units removed on March 19 consists of the cost of the items purchased on March 2 and March 15. Illustration 8-16 shows the inventory on a FIFO basis perpetual system for Call-Mart.
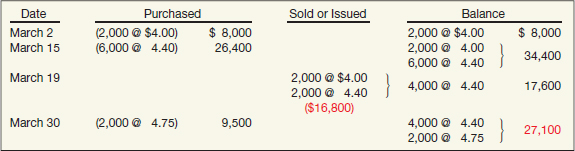
Here, the ending inventory is $27,100, and the cost of goods sold is $16,800 [(2,000 @ $4.00) + (2,000 @ $4.40)].
Notice that in these two FIFO examples, the cost of goods sold ($16,800) and ending inventory ($27,100) are the same. In all cases where FIFO is used, the inventory and cost of goods sold would be the same at the end of the month whether a perpetual or periodic system is used. Why? Because the same costs will always be first in and, therefore, first out. This is true whether a company computes cost of goods sold as it sells goods throughout the accounting period (the perpetual system) or as a residual at the end of the accounting period (the periodic system).
One objective of FIFO is to approximate the physical flow of goods. When the physical flow of goods is actually first-in, first-out, the FIFO method closely approximates specific identification. At the same time, it prevents manipulation of income. With FIFO, a company cannot pick a certain cost item to charge to expense.
Another advantage of the FIFO method is that the ending inventory is close to current cost. Because the first goods in are the first goods out, the ending inventory amount consists of the most recent purchases. This is particularly true with rapid inventory turnover. This approach generally approximates replacement cost on the balance sheet when price changes have not occurred since the most recent purchases.
However, the FIFO method fails to match current costs against current revenues on the income statement. A company charges the oldest costs against the more current revenue, possibly distorting gross profit and net income.
Last-In, First-Out (LIFO)
![]() International Perspective
International Perspective
IFRS does not permit LIFO.
The LIFO (last-in, first-out) method matches the cost of the last goods purchased against revenue. If Call-Mart Inc. uses a periodic inventory system, it assumes that the cost of the total quantity sold or issued during the month comes from the most recent purchases. Call-Mart prices the ending inventory by using the total units as a basis of computation and disregards the exact dates of sales or issuances. For example, Call-Mart would assume that the cost of the 4,000 units withdrawn absorbed the 2,000 units purchased on March 30 and 2,000 of the 6,000 units purchased on March 15. Illustration 8-17 (page 432) shows how Call-Mart computes the inventory and related cost of goods sold, using the periodic inventory method.
If Call-Mart keeps a perpetual inventory record in quantities and dollars, use of the LIFO method results in different ending inventory and cost of goods sold amounts than the amounts calculated under the periodic method. Illustration 8-18 shows these differences under the perpetual method.
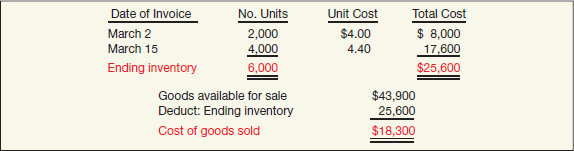
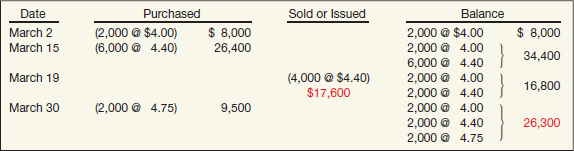

The month-end periodic inventory computation presented in Illustration 8-17 (inventory $25,600 and cost of goods sold $18,300) shows a different amount from the perpetual inventory computation (inventory $26,300 and cost of goods sold $17,600). The periodic system matches the total withdrawals for the month with the total purchases for the month in applying the last-in, first-out method. In contrast, the perpetual system matches each withdrawal with the immediately preceding purchases. In effect, the periodic computation assumed that Call-Mart included the cost of the goods that it purchased on March 30 in the sale or issue on March 19.
SPECIAL ISSUES RELATED TO LIFO
LIFO Reserve
LEARNING OBJECTIVE ![]()
Explain the significance and use of a LIFO reserve.
Many companies use LIFO for tax and external reporting purposes. However, they maintain a FIFO, average-cost, or standard cost system for internal reporting purposes. There are several reasons to do so. (1) Companies often base their pricing decisions on a FIFO, average, or standard cost assumption, rather than on a LIFO basis. (2) Recordkeeping on some other basis is easier because the LIFO assumption usually does not approximate the physical flow of the product. (3) Profit-sharing and other bonus arrangements often depend on a non-LIFO inventory assumption. (4) The use of a pure LIFO system is troublesome for interim periods, which require estimates of year-end quantities and prices.
The difference between the inventory method used for internal reporting purposes and LIFO is the Allowance to Reduce Inventory to LIFO account or the LIFO reserve. The change in the allowance balance from one period to the next is the LIFO effect. The LIFO effect is the adjustment that companies must make to the accounting records in a given year.
To illustrate, assume that Acme Boot Company uses the FIFO method for internal reporting purposes and LIFO for external reporting purposes. At January 1, 2014, the Allowance to Reduce Inventory to LIFO balance is $20,000. At December 31, 2014, the balance should be $50,000. As a result, Acme Boot realizes a LIFO effect of $30,000 and makes the following entry at year-end.
![]()
Acme Boot deducts Allowance to Reduce Inventory to LIFO from inventory to ensure that it states the inventory on a LIFO basis at year-end.
Companies should disclose either the LIFO reserve or the replacement cost of the inventory, as shown in Illustration 8-19. [7]
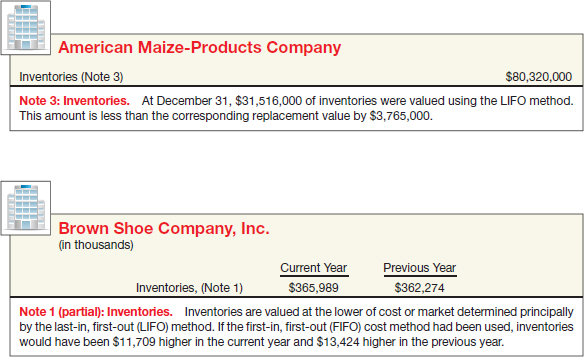
What do the numbers mean? COMPARING APPLES TO APPLES
Investors commonly use the current ratio to evaluate a company's liquidity. They compute the current ratio as current assets divided by current liabilities. A higher current ratio indicates that a company is better able to meet its current obligations when they come due. However, it is not meaningful to compare the current ratio for a company using LIFO to one for a company using FIFO. It would be like comparing apples to oranges since the two companies measure inventory (and cost of goods sold) differently.
To make the current ratio comparable on an apples-to-apples basis, analysts use the LIFO reserve. The following adjustments should do the trick:
![]()
(For cost of goods sold, deduct the change in the LIFO reserve from LIFO cost of goods sold to yield the comparable FIFO amount.)
For Brown Shoe, Inc. (see Illustration 8-19), with current assets of $487.8 million and current liabilities of $217.8 million, the current ratio using LIFO is $487.8 ÷ $217.8 = 2.2. After adjusting for the LIFO effect, Brown Shoe's current ratio under FIFO would be ($487.8 + $11.7) ÷ $217.8 = 2.3.
Thus, without the LIFO adjustment, the Brown Shoe current ratio is understated.
LIFO Liquidation
Up to this point, we have emphasized a specific-goods approach to costing LIFO inventories (also called traditional LIFO or unit LIFO). This approach is often unrealistic for two reasons:
- When a company has many different inventory items, the accounting cost of tracking each inventory item is expensive.
- Erosion of the LIFO inventory can easily occur. Referred to as LIFO liquidation, this often distorts net income and leads to substantial tax payments.
To understand the LIFO liquidation problem, assume that Basler Co. has 30,000 pounds of steel in its inventory on December 31, 2014, with cost determined on a specific-goods LIFO approach.
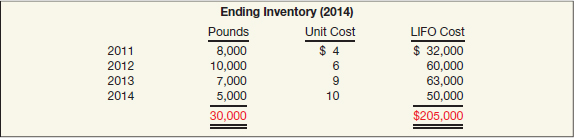
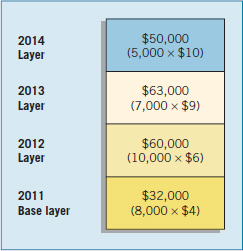
As indicated, the ending 2014 inventory for Basler comprises costs from past periods. These costs are called layers (increases from period to period). The first layer is identified as the base layer. Illustration 8-20 shows the layers for Basler.
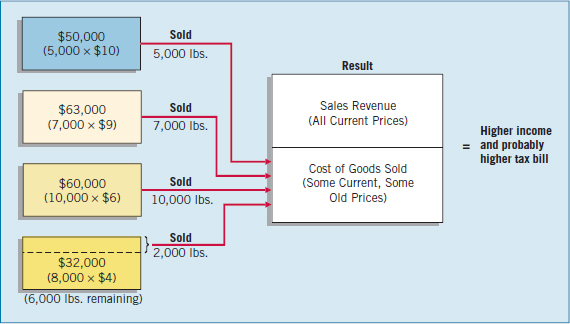
Note the increased price of steel over the four-year period. In 2015, due to metal shortages, Basler had to liquidate much of its inventory (a LIFO liquidation). At the end of 2015, only 6,000 pounds of steel remained in inventory. Because the company uses LIFO, Basler liquidates the most recent layer, 2014, first, followed by the 2013 layer, and so on. The result: Basler matches costs from preceding periods against sales revenues reported in current dollars. As Illustration 8-21 shows, this leads to a distortion in net income and increased taxable income in the current period. Unfortunately, LIFO liquidations can occur frequently when using a specific-goods LIFO approach.
To alleviate the LIFO liquidation problems and to simplify the accounting, companies can combine goods into pools. A pool groups items of a similar nature. Thus, instead of only identical units, a company combines, and counts as a group, a number of similar units or products. This method, the specific-goods pooled LIFO approach, usually results in fewer LIFO liquidations. Why? Because the reduction of one quantity in the pool may be offset by an increase in another.
The specific-goods pooled LIFO approach eliminates some of the disadvantages of the specific-goods (traditional) accounting for LIFO inventories. This pooled approach, using quantities as its measurement basis, however, creates other problems.
First, most companies continually change the mix of their products, materials, and production methods. As a result, in employing a pooled approach using quantities, companies must continually redefine the pools. This can be time-consuming and costly. Second, even when practical, the approach often results in an erosion (“LIFO liquidation”) of the layers, thereby losing much of the LIFO costing benefit. Erosion of the layers occurs when a specific good or material in the pool is replaced with another good or material. The new item may not be similar enough to be treated as part of the old pool. Therefore, a company may need to recognize any inflationary profit deferred on the old goods as it replaces them.
Dollar-Value LIFO
LEARNING OBJECTIVE ![]()
Explain the dollar-value LIFO method.
The dollar-value LIFO method overcomes the problems of redefining pools and eroding layers. The dollar-value LIFO method determines and measures any increases and decreases in a pool in terms of total dollar value, not the physical quantity of the goods in the inventory pool.
Such an approach has two important advantages over the specific-goods pooled approach. First, companies may include a broader range of goods in a dollar-value LIFO pool. Second, a dollar-value LIFO pool permits replacement of goods that are similar items, similar in use, or interchangeable. (In contrast, a specific-goods LIFO pool only allows replacement of items that are substantially identical.)
Thus, dollar-value LIFO techniques help protect LIFO layers from erosion. Because of this advantage, companies frequently use the dollar-value LIFO method in practice.5 Companies use the more traditional LIFO approaches only when dealing with few goods and expecting little change in product mix.
Under the dollar-value LIFO method, one pool may contain the entire inventory. However, companies generally use several pools.6 In general, the more goods included in a pool, the more likely that increases in the quantities of some goods will offset decreases in other goods in the same pool. Thus, companies avoid liquidation of the LIFO layers. It follows that having fewer pools means less cost and less chance of a reduction of a LIFO layer.7
Dollar-Value LIFO Example
To illustrate how the dollar-value LIFO method works, assume that Enrico Company first adopts dollar-value LIFO on December 31, 2013 (base period). The inventory at current prices on that date was $20,000. The inventory on December 31, 2014, at current prices is $26,400.
Can we conclude that Enrico's inventory quantities increased 32 percent during the year ($26,400 ÷ $20,000 = 132%)? First, we need to ask: What is the value of the ending inventory in terms of beginning-of-the-year prices? Assuming that prices have increased 20 percent during the year, the ending inventory at beginning-of-the-year prices amounts to $22,000 ($26,400 ÷ 120%). Therefore, the inventory quantity has increased only 10 percent, or from $20,000 to $22,000 in terms of beginning-of-the-year prices.
The next step is to price this real-dollar quantity increase. This real-dollar quantity increase of $2,000 valued at year-end prices is $2,400 (120% × $2,000). This increment (layer) of $2,400, when added to the beginning inventory of $20,000, totals $22,400 for the December 31, 2014, inventory, as shown below.

Note that a layer forms only when the ending inventory at base-year prices exceeds the beginning inventory at base-year prices. And only when a new layer forms must Enrico compute a new index.
Comprehensive Dollar-Value LIFO Example
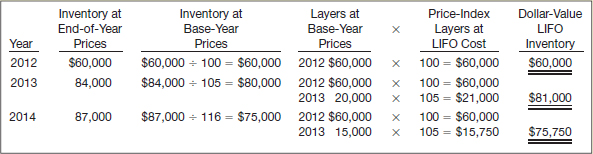
To illustrate the use of the dollar-value LIFO method in a more complex situation, assume that Bismark Company develops the following information.
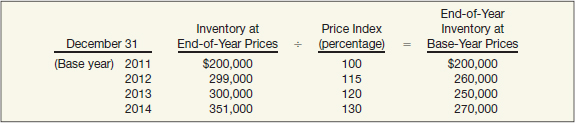
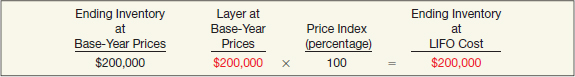
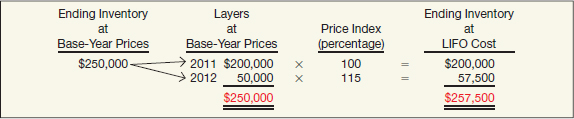
At December 31, 2011, Bismark computes the ending inventory under dollar-value LIFO as $200,000, as Illustration 8-22 shows.
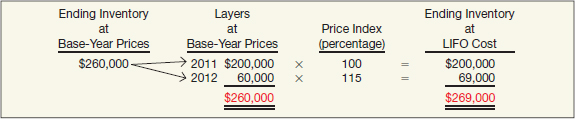
At December 31, 2012, a comparison of the ending inventory at base-year prices ($260,000) with the beginning inventory at base-year prices ($200,000) indicates that the quantity of goods (in base-year prices) increased $60,000 ($260,000 − $200,000). Bismark prices this increment (layer) at the 2012 index of 115 percent to arrive at a new layer of $69,000. Ending inventory for 2012 is $269,000, composed of the beginning inventory of $200,000 and the new layer of $69,000. Illustration 8-23 shows the computations.
At December 31, 2013, a comparison of the ending inventory at base-year prices ($250,000) with the beginning inventory at base-year prices ($260,000) indicates a decrease in the quantity of goods of $10,000 ($250,000 − $260,000). If the ending inventory at base-year prices is less than the beginning inventory at base-year prices, a company must subtract the decrease from the most recently added layer. When a decrease occurs, the company “peels off” previous layers at the prices in existence when it added the layers. In Bismark's situation, this means that it removes $10,000 in base-year prices from the 2012 layer of $60,000 at base-year prices. It values the balance of $50,000 ($60,000 − $10,000) at base-year prices at the 2012 price index of 115 percent. As a result, it now values this 2012 layer at $57,500 ($50,000 × 115%). Therefore, Bismark computes the ending inventory at $257,500, consisting of the beginning inventory of $200,000 and the second layer of $57,500. Illustration 8-24 (page 438) shows the computations for 2013.
Note that if Bismark eliminates a layer or base (or portion thereof), it cannot rebuild it in future periods. That is, the layer is gone forever.
At December 31, 2014, a comparison of the ending inventory at base-year prices ($270,000) with the beginning inventory at base-year prices ($250,000) indicates an increase in the quantity of goods (in base-year prices) of $20,000 ($270,000 − $250,000). After converting the $20,000 increase, using the 2014 price index, the ending inventory is $283,500, composed of the beginning layer of $200,000, a 2012 layer of $57,500, and a 2014 layer of $26,000 ($20,000 × 130%). Illustration 8-25 shows this computation.
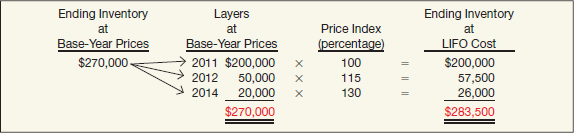
The ending inventory at base-year prices must always equal the total of the layers at base-year prices. Checking that this situation exists will help to ensure correct dollar-value computations.
Selecting a Price Index
Obviously, price changes are critical in dollar-value LIFO. How do companies determine the price indexes? Many companies use the general price-level index that the federal government prepares and publishes each month. The most popular general external price-level index is the Consumer Price Index for Urban Consumers (CPI-U).8 Companies also use more-specific external price indexes. For instance, various organizations compute and publish daily indexes for most commodities (gold, silver, other metals, corn, wheat, and other farm products). Many trade associations prepare indexes for specific product lines or industries. Any of these indexes may be used for dollar-value LIFO purposes.
When a relevant specific external price index is not readily available, a company may compute its own specific internal price index. The desired approach is to price ending inventory at the most current cost. Therefore, a company that chose to compute its own specific internal price index would ordinarily determine current cost by referring to the actual cost of the goods it most recently had purchased. The price index provides a measure of the change in price or cost levels between the base year and the current year. The company then computes the index for each year after the base year. The general formula for computing the index is as follows.
This approach is generally referred to as the double-extension method. As its name implies, the value of the units in inventory is extended at both base-year prices and current-year prices.
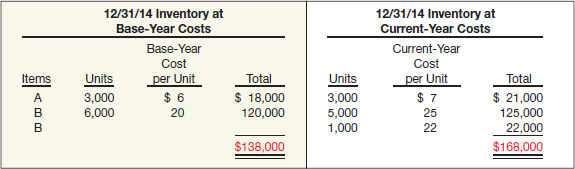
To illustrate this computation, assume that Toledo Company's base-year inventory (January 1, 2014) consisted of the following.

Examination of the ending inventory indicates that the company holds 3,000 units of Item A and 6,000 units of Item B on December 31, 2014. The most recent actual purchases related to these items were as follows.

Toledo double-extends the inventory as shown in Illustration 8-27.
After the inventories are double-extended, Toledo uses the formula in Illustration 8-26 to develop the index for the current year (2014), as follows.
Toledo then applies this index (121.74%) to the layer added in 2014. Note in this illustration that Toledo used the most recent actual purchases to determine current cost. Alternatively, it could have used other approaches such as FIFO and average-cost. Whichever flow assumption is adopted, a company must use it consistently from one period to another.
Use of the double-extension method is time-consuming and difficult where substantial technological change has occurred or where many items are involved. That is, as time passes, the company must determine a new base-year cost for new products, and must keep a base-year cost for each inventory item.9
What do the numbers mean? QUITE A DIFFERENCE
As indicated, significant differences can arise in inventory measured according to current cost and dollar-value LIFO. Let's look at an additional summary example.
Truman Company uses the dollar-value LIFO method of computing its inventory. Inventory for the last three years is as shown below.
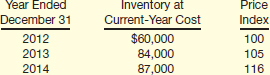
The values of the 2012, 2013, and 2014 inventories using the dollar-value LIFO method are presented in the table below.
As indicated, consistent with LIFO costing in times of rising prices, the dollar-value LIFO inventory amount is less than inventory stated at end-of-year prices. The company did not add layers at the 2014 prices. This is because the increase in inventory at end-of-year (current) prices was primarily due to higher prices. Also, establishing the LIFO layers based on price-adjusted dollars relative to base-year layers reduces the likelihood of a LIFO liquidation.
Comparison of LIFO Approaches
We present three different approaches to computing LIFO inventories in this chapter—specific-goods LIFO, specific-goods pooled LIFO, and dollar-value LIFO. As we indicated earlier, the use of the specific-goods LIFO is unrealistic. Most companies have numerous goods in inventory at the end of a period. Costing (pricing) them on a unit basis is extremely expensive and time-consuming.
The specific-goods pooled LIFO approach reduces recordkeeping and clerical costs. In addition, it is more difficult to erode the layers because the reduction of one quantity in the pool may be offset by an increase in another. Nonetheless, the pooled approach using quantities as its measurement basis can lead to untimely LIFO liquidations.
As a result, most companies using a LIFO system employ dollar-value LIFO. Although the approach appears complex, the logic and the computations are actually quite simple, after determining an appropriate index.
However, problems do exist with the dollar-value LIFO method. The selection of the items to be put in a pool can be subjective.10 Such a determination, however, is extremely important because manipulation of the items in a pool without conceptual justification can affect reported net income. For example, the SEC noted that some companies have set up pools that are easy to liquidate. As a result, to increase income, a company simply decreases inventory, thereby matching low-cost inventory items to current revenues.
To curb this practice, the SEC has taken a much harder line on the number of pools that companies may establish. In a well-publicized case, Stauffer Chemical Company increased the number of LIFO pools from 8 to 280, boosting its net income by $16,515,000 or approximately 13 percent. Stauffer justified the change in its annual report on the basis of “achieving a better matching of cost and revenue.” The SEC required Stauffer to reduce the number of its inventory pools, contending that some pools were inappropriate and alleging income manipulation.
Major Advantages of LIFO
LEARNING OBJECTIVE ![]()
Identify the major advantages and disadvantages of LIFO.
One obvious advantage of LIFO approaches is that the LIFO cost flow often approximates the physical flow of the goods in and out of inventory. For instance, in a coal pile, the last coal in is the first coal out because it is on the top of the pile. The coal remover is not going to take the coal from the bottom of the pile! The coal taken first is the coal placed on the pile last.
However, this is one of only a few situations where the actual physical flow corresponds to LIFO. Therefore, most adherents of LIFO use other arguments for its widespread use, as follows.
Matching
LIFO matches the more recent costs against current revenues to provide a better measure of current earnings. During periods of inflation, many challenge the quality of non-LIFO earnings, noting that failing to match current costs against current revenues creates transitory or “paper” profits (“inventory profits”). Inventory profits occur when the inventory costs matched against sales are less than the inventory replacement cost. This results in understating the cost of goods sold and overstating profit. Using LIFO (rather than a method such as FIFO) matches current costs against revenues, thereby reducing inventory profits.
Tax Benefits/Improved Cash Flow
LIFO's popularity mainly stems from its tax benefits. As long as the price level increases and inventory quantities do not decrease, a deferral of income tax occurs. Why? Because a company matches the items it most recently purchased (at the higher price level) against revenues. For example, when Fuqua Industries switched to LIFO, it realized a tax savings of about $4 million. Even if the price level decreases later, the company still temporarily deferred its income taxes. Thus, use of LIFO in such situations improves a company's cash flow.11
The tax law requires that if a company uses LIFO for tax purposes, it must also use LIFO for financial accounting purposes12 (although neither tax law nor GAAP requires a company to pool its inventories in the same manner for book and tax purposes). This requirement is often referred to as the LIFO conformity rule. Other inventory valuation methods do not have this requirement.
Future Earnings Hedge
With LIFO, future price declines will not substantially affect a company's future reported earnings. The reason: Since the company records the most recent inventory as sold first, there is not much ending inventory at high prices vulnerable to a price decline. Thus LIFO eliminates or substantially minimizes write-downs to market as a result of price decreases. In contrast, inventory costed under FIFO is more vulnerable to price declines, which can reduce net income substantially.
Major Disadvantages of LIFO
Despite its advantages, LIFO has the following drawbacks.
Reduced Earnings
Many corporate managers view the lower profits reported under the LIFO method in inflationary times as a distinct disadvantage. They would rather have higher reported profits than lower taxes. Some fear that investors may misunderstand an accounting change to LIFO, and that the lower profits may cause the price of the company's stock to fall.
Inventory Understated
LIFO may have a distorting effect on a company's balance sheet. The inventory valuation is normally outdated because the oldest costs remain in inventory. This understatement makes the working capital position of the company appear worse than it really is. A good example is Caterpillar, which uses LIFO costing for most of its inventory, valued at $14.5 billion at year-end 2011. Under FIFO costing, Caterpillar's inventories have a value of $16.7 billion—approximately 5 percent higher than the LIFO amount.
The magnitude and direction of this variation between the carrying amount of inventory and its current price depend on the degree and direction of the price changes and the amount of inventory turnover. The combined effect of rising product prices and avoidance of inventory liquidations increases the difference between the inventory carrying value at LIFO and current prices of that inventory. This magnifies the balance sheet distortion attributed to the use of LIFO.
Physical Flow
LIFO does not approximate the physical flow of the items except in specific situations (such as the coal pile discussed earlier). Originally, companies could use LIFO only in certain circumstances. This situation has changed over the years. Now, physical flow characteristics no longer determine whether a company may employ LIFO.
Involuntary Liquidation/Poor Buying Habits
If a company eliminates the base or layers of old costs, it may match old, irrelevant costs against current revenues. A distortion in reported income for a given period may result, as well as detrimental income tax consequences. For example, Caterpillar recently experienced a LIFO liquidation, resulting in an increased tax bill of $60 million.13
Because of the liquidation problem, LIFO may cause poor buying habits. A company may simply purchase more goods and match these goods against revenue to avoid charging the old costs to expense. Furthermore, recall that with LIFO, a company may attempt to manipulate its net income at the end of the year simply by altering its pattern of purchases.14
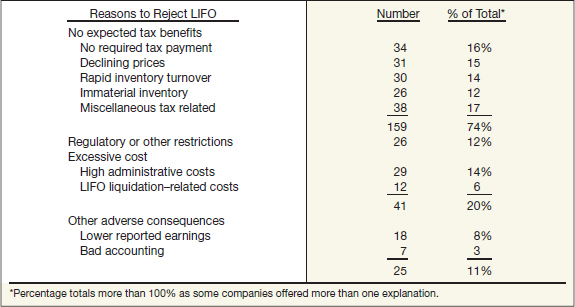
One survey uncovered the following reasons why companies reject LIFO.15
BASIS FOR SELECTION OF INVENTORY METHOD
LEARNING OBJECTIVE ![]()
Understand why companies select given inventory methods.
How does a company choose among the various inventory methods? Although no absolute rules can be stated, preferability for LIFO usually occurs in either of the following circumstances: (1) if selling prices and revenues have been increasing faster than costs, thereby distorting income, and (2) in situations where LIFO has been traditional, such as department stores and industries where a fairly constant “base stock” is present (such as refining, chemicals, and glass).16
Conversely, LIFO is probably inappropriate in the following circumstances: (1) where prices tend to lag behind costs; (2) in situations where specific identification is traditional, such as in the sale of automobiles, farm equipment, art, and antique jewelry; or (3) where unit costs tend to decrease as production increases, thereby nullifying the tax benefit that LIFO might provide.17
Tax consequences are another consideration. Switching from FIFO to LIFO usually results in an immediate tax benefit. However, switching from LIFO to FIFO can result in a substantial tax burden. For example, when Chrysler changed from LIFO to FIFO, it became responsible for an additional $53 million in taxes that the company had deferred over 14 years of LIFO inventory valuation. Why, then, would Chrysler, and other companies, change to FIFO? The major reason was the profit crunch of that era. Although Chrysler showed a loss of $7.6 million after the switch, the loss would have been $20 million more if the company had not changed its inventory valuation from LIFO to FIFO.
It is questionable whether companies should switch from LIFO to FIFO for the sole purpose of increasing reported earnings. Intuitively, we would assume that companies with higher reported earnings would have a higher share valuation (common stock price). However, some studies have indicated that the users of financial data exhibit a much higher sophistication than might be expected. Share prices are the same and, in some cases, even higher under LIFO in spite of lower reported earnings.18
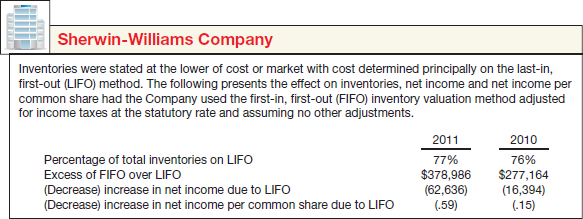
The concern about reduced income resulting from adoption of LIFO has even less substance now because the IRS has also relaxed the LIFO conformity rule which requires a company employing LIFO for tax purposes to use it for book purposes as well. The IRS has also relaxed restrictions against providing non-LIFO income numbers as supplementary information. As a result, companies now provide supplemental non-LIFO disclosures. While not intended to override the basic LIFO method adopted for financial reporting, these disclosures may be useful in comparing operating income and working capital with companies not on LIFO.
For example, Sherwin-Williams Company, a LIFO user, presented the information in its annual report as shown in Illustration 8-30.
![]() International Perspective
International Perspective
Many U.S. companies that have international operations use LIFO for U.S. purposes but use FIFO for their foreign subsidiaries.
Relaxation of the LIFO conformity rule has led some companies to select LIFO as their inventory valuation method because they will be able to disclose FIFO income numbers in the financial reports if they so desire.19
Companies often combine inventory methods. For example, John Deere uses LIFO for most of its inventories, and prices the remainder using FIFO. The Hershey Company follows the same practice. One reason for these practices is that certain product lines can be highly susceptible to deflation instead of inflation. In addition, if the level of inventory is unstable, unwanted involuntary liquidations may result in certain product lines if using LIFO. Finally, for high inventory turnover in certain product lines, a company cannot justify LIFO's additional recordkeeping and expense. In such cases, a company often uses average-cost because it is easy to compute.20
Although a company may use a variety of inventory methods to assist in accurate computation of net income, once it selects a pricing method, it must apply it consistently thereafter. If conditions indicate that the inventory pricing method in use is unsuitable, the company must seriously consider all other possibilities before selecting another method. It should clearly explain any change and disclose its effect in the financial statements.
 Evolving Issue REPEAL LIFO!
In some situations, use of LIFO can result in significant tax savings for companies. For example, Sherwin-Williams Company estimates its tax bill would increase by $16 million if it were to change from LIFO to FIFO. The option to use LIFO to reduce taxes has become a political issue because of the growing federal deficit. Some are proposing elimination of LIFO (and other tax law changes) to help reduce the federal deficit. Why pick on LIFO? Well, one recent budget estimate indicates that repeal of LIFO would help plug the budget deficit with over $61 billion in additional tax collections. In addition, since IFRS does not permit LIFO, its repeal will contribute to international accounting convergence.
Source: R. Bloom and W. Cenker, “The Death of LIFO?” Journal of Accountancy (January 2009), pp. 44–49.
Inventory Valuation Methods—Summary Analysis
The preceding sections of this chapter described a number of inventory valuation methods. Here we present a brief summary of the three major inventory methods to show the effects these valuation methods have on the financial statements. This comparison assumes periodic inventory procedures and the following selected data.
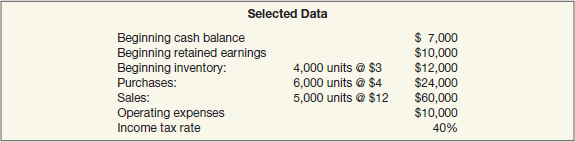
Illustration 8-31 (page 446) shows the comparative results on net income of the use of average-cost, FIFO, and LIFO. Notice that gross profit and net income are lowest under LIFO, highest under FIFO, and somewhere in the middle under average-cost.
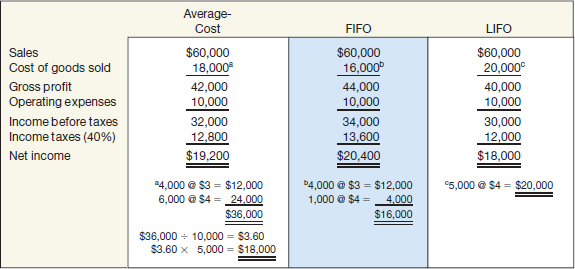
Illustration 8-32 shows the final balances of selected items at the end of the period.
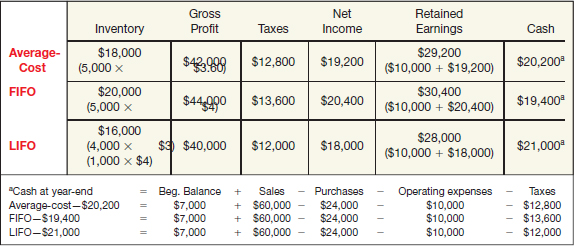
LIFO results in the highest cash balance at year-end (because taxes are lower). This example assumes that prices are rising. The opposite result occurs if prices are declining.
KEY TERMS
average-cost method, 429
consigned goods, 422
cost flow assumptions, 428
dollar-value LIFO, 435
double-extension method, 439
finished goods inventory, 416
first-in, first-out (FIFO) method, 430
f.o.b. destination, 421
f.o.b. shipping point, 421
gross method, 427
inventories, 416
last-in, first-out (LIFO) method, 431
LIFO effect, 432
LIFO liquidation, 434
LIFO reserve, 432
merchandise inventory, 416
modified perpetual inventory system, 419
moving-average method, 430
net method, 427
net of the cash discounts, 427
period costs, 426
periodic inventory system, 418
perpetual inventory system, 418
product costs, 426
Purchase Discounts, 426
raw materials inventory, 416
specific-goods pooled LIFO approach, 435
specific identification, 428
weighted-average method, 429
work in process inventory, 416
SUMMARY OF LEARNING OBJECTIVES
![]() Identify major classifications of inventory. Only one inventory account, Inventory, appears in the financial statements of a merchandising concern. A manufacturer normally has three inventory accounts: Raw Materials, Work in Process, and Finished Goods. Companies report the cost assigned to goods and materials on hand but not yet placed into production as raw materials inventory. They report the cost of the raw materials on which production has been started but not completed, plus the direct labor cost applied specifically to this material and a ratable share of manufacturing overhead costs, as work in process inventory. Finally, they report the costs identified with the completed but unsold units on hand at the end of the fiscal period as finished goods inventory.
Identify major classifications of inventory. Only one inventory account, Inventory, appears in the financial statements of a merchandising concern. A manufacturer normally has three inventory accounts: Raw Materials, Work in Process, and Finished Goods. Companies report the cost assigned to goods and materials on hand but not yet placed into production as raw materials inventory. They report the cost of the raw materials on which production has been started but not completed, plus the direct labor cost applied specifically to this material and a ratable share of manufacturing overhead costs, as work in process inventory. Finally, they report the costs identified with the completed but unsold units on hand at the end of the fiscal period as finished goods inventory.
![]() Distinguish between perpetual and periodic inventory systems. A perpetual inventory system maintains a continuous record of inventory changes in the Inventory account. That is, a company records all purchases and sales (issues) of goods directly in the Inventory account as they occur. Under a periodic inventory system, companies determine the quantity of inventory on hand only periodically. A company debits a Purchases account, but the Inventory account remains the same. It determines cost of goods sold at the end of the period by subtracting ending inventory from cost of goods available for sale. A company ascertains ending inventory by physical count.
Distinguish between perpetual and periodic inventory systems. A perpetual inventory system maintains a continuous record of inventory changes in the Inventory account. That is, a company records all purchases and sales (issues) of goods directly in the Inventory account as they occur. Under a periodic inventory system, companies determine the quantity of inventory on hand only periodically. A company debits a Purchases account, but the Inventory account remains the same. It determines cost of goods sold at the end of the period by subtracting ending inventory from cost of goods available for sale. A company ascertains ending inventory by physical count.
![]() Determine the goods included in inventory and the effects of inventory errors on the financial statements. Companies record purchases of inventory when they obtain legal title to the goods (generally when they receive the goods). Shipping terms must be evaluated to determine when legal title passes, and careful consideration must be made for cost of goods sold on consignment and sales with buy-back agreements and high rates of return. If the company misstates ending inventory: (1) In the balance sheet, the inventory and retained earnings will be misstated, which will lead to miscalculation of the working capital and current ratio, and (2) in the income statement, the cost of goods sold and net income will be misstated. If the company misstates purchases (and related accounts payable) and inventory: (1) In the balance sheet, the inventory and accounts payable will be misstated, which will lead to miscalculation of the current ratio, and (2) in the income statement, purchases and ending inventory will be misstated.
Determine the goods included in inventory and the effects of inventory errors on the financial statements. Companies record purchases of inventory when they obtain legal title to the goods (generally when they receive the goods). Shipping terms must be evaluated to determine when legal title passes, and careful consideration must be made for cost of goods sold on consignment and sales with buy-back agreements and high rates of return. If the company misstates ending inventory: (1) In the balance sheet, the inventory and retained earnings will be misstated, which will lead to miscalculation of the working capital and current ratio, and (2) in the income statement, the cost of goods sold and net income will be misstated. If the company misstates purchases (and related accounts payable) and inventory: (1) In the balance sheet, the inventory and accounts payable will be misstated, which will lead to miscalculation of the current ratio, and (2) in the income statement, purchases and ending inventory will be misstated.
![]() Understand the items to include as inventory cost. Product costs are those costs that attach to the inventory and are recorded in the Inventory account. Such charges include freight charges on goods purchased, other direct costs of acquisition, and labor and other production costs incurred in processing the goods up to the time of sale. Period costs are those costs that are indirectly related to the acquisition or production of goods. These changes, such as selling expense and general and administrative expenses, are therefore not included as part of inventory cost.
Understand the items to include as inventory cost. Product costs are those costs that attach to the inventory and are recorded in the Inventory account. Such charges include freight charges on goods purchased, other direct costs of acquisition, and labor and other production costs incurred in processing the goods up to the time of sale. Period costs are those costs that are indirectly related to the acquisition or production of goods. These changes, such as selling expense and general and administrative expenses, are therefore not included as part of inventory cost.
![]() Describe and compare the cost flow assumptions used to account for inventories. (1) Average-cost prices items in the inventory on the basis of the average cost of all similar goods available during the period. (2) First-in, first-out (FIFO) assumes that a company uses goods in the order in which it purchases them. The inventory remaining must therefore represent the most recent purchases. (3) Last-in, first-out (LIFO) matches the cost of the last goods purchased against revenue.
Describe and compare the cost flow assumptions used to account for inventories. (1) Average-cost prices items in the inventory on the basis of the average cost of all similar goods available during the period. (2) First-in, first-out (FIFO) assumes that a company uses goods in the order in which it purchases them. The inventory remaining must therefore represent the most recent purchases. (3) Last-in, first-out (LIFO) matches the cost of the last goods purchased against revenue.
![]() Explain the significance and use of a LIFO reserve. The difference between the inventory method used for internal reporting purposes and LIFO is referred to as Allowance to Reduce Inventory to LIFO, or the LIFO reserve. The change in LIFO reserve is referred to as the LIFO effect. Companies should disclose either the LIFO reserve or the replacement cost of the inventory in the financial statements.
Explain the significance and use of a LIFO reserve. The difference between the inventory method used for internal reporting purposes and LIFO is referred to as Allowance to Reduce Inventory to LIFO, or the LIFO reserve. The change in LIFO reserve is referred to as the LIFO effect. Companies should disclose either the LIFO reserve or the replacement cost of the inventory in the financial statements.
![]() Understand the effect of LIFO liquidations. LIFO liquidations match costs from preceding periods against sales revenues reported in current dollars. This distorts net income and results in increased taxable income in the current period. LIFO liquidations can occur frequently when using a specific-goods LIFO approach.
Understand the effect of LIFO liquidations. LIFO liquidations match costs from preceding periods against sales revenues reported in current dollars. This distorts net income and results in increased taxable income in the current period. LIFO liquidations can occur frequently when using a specific-goods LIFO approach.
![]() Explain the dollar-value LIFO method. For the dollar-value LIFO method, companies determine and measure increases and decreases in a pool in terms of total dollar value, not the physical quantity of the goods in the inventory pool.
Explain the dollar-value LIFO method. For the dollar-value LIFO method, companies determine and measure increases and decreases in a pool in terms of total dollar value, not the physical quantity of the goods in the inventory pool.
![]() Identify the major advantages and disadvantages of LIFO. The major advantages of LIFO are the following. (1) It matches recent costs against current revenues to provide a better measure of current earnings. (2) As long as the price level increases and inventory quantities do not decrease, a deferral of income tax occurs in LIFO. (3) Because of the deferral of income tax, cash flow improves. Major disadvantages are (1) reduced earnings, (2) understated inventory, (3) does not approximate physical flow of the items except in peculiar situations, and (4) involuntary liquidation issues.
Identify the major advantages and disadvantages of LIFO. The major advantages of LIFO are the following. (1) It matches recent costs against current revenues to provide a better measure of current earnings. (2) As long as the price level increases and inventory quantities do not decrease, a deferral of income tax occurs in LIFO. (3) Because of the deferral of income tax, cash flow improves. Major disadvantages are (1) reduced earnings, (2) understated inventory, (3) does not approximate physical flow of the items except in peculiar situations, and (4) involuntary liquidation issues.
![]() Understand why companies select given inventory methods. Companies ordinarily prefer LIFO in the following circumstances: (1) if selling prices and revenues have been increasing faster than costs and (2) if a company has a fairly constant “base stock.” Conversely, LIFO would probably not be appropriate in the following circumstances: (1) if sale prices tend to lag behind costs, (2) if specific identification is traditional, and (3) when unit costs tend to decrease as production increases, thereby nullifying the tax benefit that LIFO might provide.
Understand why companies select given inventory methods. Companies ordinarily prefer LIFO in the following circumstances: (1) if selling prices and revenues have been increasing faster than costs and (2) if a company has a fairly constant “base stock.” Conversely, LIFO would probably not be appropriate in the following circumstances: (1) if sale prices tend to lag behind costs, (2) if specific identification is traditional, and (3) when unit costs tend to decrease as production increases, thereby nullifying the tax benefit that LIFO might provide.
DEMONSTRATION PROBLEM
Clinton Company makes specialty cases for smart phones and other handheld devices. The company has experienced strong growth, and you are especially interested in how well Clinton is managing its inventory balances. You have collected the following information for the current year.
![]()
The company values inventory at lower-of-cost (using LIFO cost flow assumption)-or-market.
Instructions
Prepare a schedule (a computer worksheet would serve well) showing the impact of the following items on Clinton's inventory turnover.
(a) Shipping contracts changed 2 months ago from f.o.b. shipping point to f.o.b. destination. At the end of the year, $5 million of products are en route to China (and will not arrive until after financial statements are released). Current inventory balances do not reflect this change in policy.
(b) During the year, Clinton recorded sales and costs of goods sold on $2 million of units shipped to various wholesalers on consignment. At year-end, none of these units have been sold by wholesalers.
(c) To be more consistent with industry inventory valuation practices, Clinton changed from LIFO to FIFO for its inventory of iPad cases. This inventory is currently carried at $724 million. Data for this item of inventory for the year are as follows.
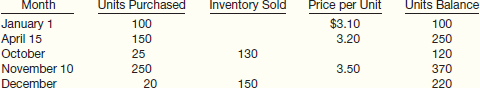
(d) Explain to Clinton management the advantages of adopting the LIFO cost flow assumption. Are there any drawbacks? Explain.
Solution
(a)–(c)
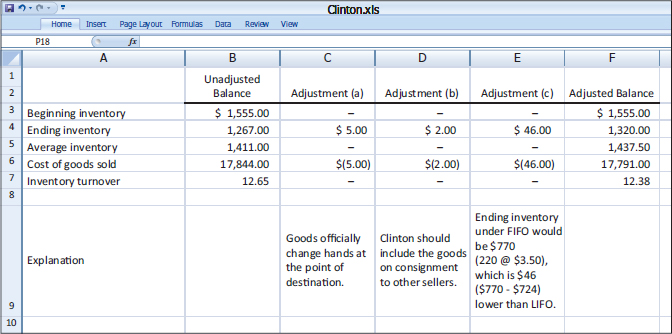
(d) The major advantages of the LIFO inventory method include better matching of costs with revenues, deferral of income taxes, improved cash flow, and minimization of the impact of future price declines on future earnings. Better matching arises in the use of LIFO because the most recent costs are matched with current revenues. In times of rising prices, this matching will result in lower taxable income, which in turn will reduce current taxes. The deferral of taxes under LIFO contributes to a higher cash flow. As illustrated in the analysis above, the switch to FIFO resulted in a higher ending inventory, which leads to a lower cost of goods sold and higher income. Thus, Clinton's reported income will be higher but so will its taxes. Note that under LIFO, future taxes may be higher when lower cost items of inventory are sold in future periods and matched with higher sales prices.
 FASB CODIFICATION
FASB Codification References
[1] FASB ASC 470-40-05. [Predecessor literature: “Accounting for Product Financing Arrangements,” Statement of Financial Accounting Standards No. 49 (Stamford, Conn.: FASB, 1981).]
[2] FASB ASC 605-15-15. [Predecessor literature: “Revenue Recognition When Right of Return Exists,” Statement of Financial Accounting Standards No. 48 (Stamford, Conn.: FASB, 1981).]
[3] FASB ASC 330-10-30-7. [Predecessor literature: “Inventory Costs: An Amendment of ARB No. 43, Chapter 4,” Statement of Financial Accounting Standards No. 151 (Norwalk, Conn.: FASB 2004).]
[4] FASB ASC 835-20-05. [Predecessor literature: “Capitalization of Interest Cost,” Statement of Financial Accounting Standards No. 34 (Stamford, Conn.: FASB, 1979).]
[5] FASB ASC 645-45-05. [Predecessor literature: “Accounting for Shipping and Handling Fees and Costs,” EITF No. 00–10 (2000).]
[6] FASB ASC 330-10-30. [Predecessor literature: “Restatement and Revision of Accounting Research Bulletins,” Accounting Research Bulletin No. 43 (New York: AICPA, 1953), Ch. 4, Statement 4.]
[7] FASB ASC 330-10-S99-1. [Predecessor literature: “AICPA Task Force on LIFO Inventory Problems, Issues Paper (New York: AICPA, November 30, 1984), pp. 2–24.]
[8] FASB ASC 330-10-S99-3. [Predecessor literature: “AICPA Task Force on LIFO Inventory Problems, Issues Paper (New York: AICPA, November 30, 1984), pp. 36–37.]
Exercises
If your school has a subscription to the FASB Codification, go to http://aaahq.org/asclogin.cfm to log in and prepare responses to the following. Provide Codification references for your responses.
| CE8-1 | Access the glossary (“Master Glossary”) to answer the following.
(a) What is the definition provided for inventory? (b) What is a customer? (c) Under what conditions is a distributor considered a customer? (d) What is a product financing arrangement? What inventory measurement issues are raised through these arrangements? |
| CE8-2 | Due to rising fuel costs, your client, Overstock.com, is considering adding a charge for shipping and handling costs on products sold through its website. What is the authoritative guidance for reporting these costs? |
| CE8-3 | What guidance does the Codification provide concerning reporting inventories above cost? |
| CE8-4 | What is the nature of the SEC guidance concerning the reporting of LIFO liquidations? |
An additional Codification case can be found in the Using Your Judgment section, on page 471.
Be sure to check the book's companion website for a Review and Analysis Exercise, with solution.
![]() Brief Exercises, Exercises, Problems, and many more learning and assessment tools and resources are available for practice in WileyPLUS.
Brief Exercises, Exercises, Problems, and many more learning and assessment tools and resources are available for practice in WileyPLUS.
QUESTIONS
- In what ways are the inventory accounts of a retailing company different from those of a manufacturing company?
- Why should inventories be included in (a) a statement of financial position and (b) the computation of net income?
- What is the difference between a perpetual inventory and a physical inventory? If a company maintains a perpetual inventory, should its physical inventory at any date be equal to the amount indicated by the perpetual inventory records? Why?
- Mishima, Inc. indicated in a recent annual report that approximately $19 million of merchandise was received on consignment. Should Mishima, Inc. report this amount on its balance sheet? Explain.
- What is a product financing arrangement? How should product financing arrangements be reported in the financial statements?
- Where, if at all, should the following items be classified on a balance sheet?
(a) Goods out on approval to customers.
(b) Goods in transit that were recently purchased f.o.b. destination.
(c) Land held by a realty firm for sale.
(d) Raw materials.
(e) Goods received on consignment.
(f) Manufacturing supplies.
- At the balance sheet date, Clarkson Company held title to goods in transit amounting to $214,000. This amount was omitted from the purchases figure for the year and also from the ending inventory. What is the effect of this omission on the net income for the year as calculated when the books are closed? What is the effect on the company's financial position as shown in its balance sheet? Is materiality a factor in determining whether an adjustment for this item should be made?
- Define “cost” as applied to the valuation of inventories.
- Distinguish between product costs and period costs as they relate to inventory.
- Ford Motor Co. is considering alternate methods of accounting for the cash discounts it takes when paying suppliers promptly. One method suggested was to report these discounts as financial income when payments are made. Comment on the propriety of this approach.
- Zonker Inc. purchases 500 units of an item at an invoice cost of $30,000. What is the cost per unit? If the goods are shipped f.o.b. shipping point and the freight bill was $1,500, what is the cost per unit if Zonker Inc. pays the freight charges? If these items were bought on 2/10, n/30 terms and the invoice and the freight bill were paid within the 10-day period, what would be the cost per unit?
- Specific identification is sometimes said to be the ideal method of assigning cost to inventory and to cost of goods sold. Briefly indicate the arguments for and against this method of inventory valuation.
- FIFO, average-cost, and LIFO methods are often used instead of specific identification for inventory valuation purposes. Compare these methods with the specific identification method, discussing the theoretical propriety of each method in the determination of income and asset valuation.
- How might a company obtain a price index in order to apply dollar-value LIFO?
- Describe the LIFO double-extension method. Using the following information, compute the index at December 31, 2014, applying the double-extension method to a LIFO pool consisting of 25,500 units of product A and 10,350 units of product B. The base-year cost of product A is $10.20 and of product B is $37.00. The price at December 31, 2014, for product A is $21.00 and for product B is $45.60. (Round to two decimal places.)
- As compared with the FIFO method of costing inventories, does the LIFO method result in a larger or smaller net income in a period of rising prices? What is the comparative effect on net income in a period of falling prices?
- What is the dollar-value method of LIFO inventory valuation? What advantage does the dollar-value method have over the specific goods approach of LIFO inventory valuation? Why will the traditional LIFO inventory costing method and the dollar-value LIFO inventory costing method produce different inventory valuations if the composition of the inventory base changes?
- Explain the following terms.
(a) LIFO layer.
(b) LIFO reserve.
(c) LIFO effect.
- On December 31, 2013, the inventory of Powhattan Company amounts to $800,000. During 2014, the company decides to use the dollar-value LIFO method of costing inventories. On December 31, 2014, the inventory is $1,053,000 at December 31, 2014, prices. Using the December 31, 2013, price level of 100 and the December 31, 2014, price level of 108, compute the inventory value at December 31, 2014, under the dollar-value LIFO method.
- In an article that appeared in the Wall Street Journal, the phrases “phantom (paper) profits” and “high LIFO profits” through involuntary liquidation were used. Explain these phrases.
BRIEF EXERCISES
BE8-1 Included in the December 31 trial balance of Rivera Company are the following assets.
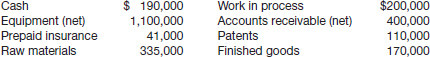
Prepare the current assets section of the December 31 balance sheet.
![]()
BE8-2 Matlock Company uses a perpetual inventory system. Its beginning inventory consists of 50 units that cost $34 each. During June, the company purchased 150 units at $34 each, returned 6 units for credit, and sold 125 units at $50 each. Journalize the June transactions.
![]()
BE8-3 Stallman Company took a physical inventory on December 31 and determined that goods costing $200,000 were on hand. Not included in the physical count were $25,000 of goods purchased from Pelzer Corporation, f.o.b. shipping point, and $22,000 of goods sold to Alvarez Company for $30,000, f.o.b. destination. Both the Pelzer purchase and the Alvarez sale were in transit at year-end. What amount should Stallman report as its December 31 inventory?
![]()
BE8-4 Bienvenu Enterprises reported cost of goods sold for 2014 of $1,400,000 and retained earnings of $5,200,000 at December 31, 2014. Bienvenu later discovered that its ending inventories at December 31, 2013 and 2014, were overstated by $110,000 and $35,000, respectively. Determine the corrected amounts for 2014 cost of goods sold and December 31, 2014, retained earnings.
![]()
BE8-5 Amsterdam Company uses a periodic inventory system. For April, when the company sold 600 units, the following information is available.
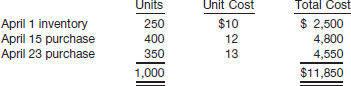
Compute the April 30 inventory and the April cost of goods sold using the average-cost method.
![]()
BE8-6 Data for Amsterdam Company are presented in BE8-5. Compute the April 30 inventory and the April cost of goods sold using the FIFO method.
![]()
BE8-7 Data for Amsterdam Company are presented in BE8-5. Compute the April 30 inventory and the April cost of goods sold using the LIFO method.
![]()
BE8-8 Midori Company had ending inventory at end-of-year prices of $100,000 at December 31, 2013; $119,900 at December 31, 2014; and $134,560 at December 31, 2015. The year-end price indexes were 100 at 12/31/13, 110 at 12/31/14, and 116 at 12/31/15. Compute the ending inventory for Midori Company for 2013 through 2015 using the dollar-value LIFO method.
![]()
BE8-9 Arna, Inc. uses the dollar-value LIFO method of computing its inventory. Data for the past 3 years follow.
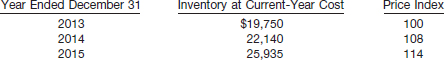
Instructions
Compute the value of the 2014 and 2015 inventories using the dollar-value LIFO method.
EXERCISES
E8-1 (Inventoriable Costs) Presented below is a list of items that may or may not be reported as inventory in a company's December 31 balance sheet.
- Goods out on consignment at another company's store.
- Goods sold on an installment basis (bad debts can be reasonably estimated).
- Goods purchased f.o.b. shipping point that are in transit at December 31.
- Goods purchased f.o.b. destination that are in transit at December 31.
- Goods sold to another company, for which our company has signed an agreement to repurchase at a set price that covers all costs related to the inventory.
- Goods sold where large returns are predictable.
- Goods sold f.o.b. shipping point that are in transit at December 31.
- Freight charges on goods purchased.
- Interest costs incurred for inventories that are routinely manufactured.
- Costs incurred to advertise goods held for resale.
- Materials on hand not yet placed into production by a manufacturing firm.
- Office supplies.
- Raw materials on which a manufacturing firm has started production but which are not completely processed.
- Factory supplies.
- Goods held on consignment from another company.
- Costs identified with units completed by a manufacturing firm but not yet sold.
- Goods sold f.o.b. destination that are in transit at December 31.
- Short-term investments in stocks and bonds that will be resold in the near future.
Instructions
Indicate which of these items would typically be reported as inventory in the financial statements. If an item should not be reported as inventory, indicate how it should be reported in the financial statements.
![]()

E8-2 (Inventoriable Costs) In your audit of Jose Oliva Company, you find that a physical inventory on December 31, 2014, showed merchandise with a cost of $441,000 was on hand at that date. You also discover the following items were all excluded from the $441,000.
- Merchandise of $61,000 which is held by Oliva on consignment. The consignor is the Max Suzuki Company.
- Merchandise costing $38,000 which was shipped by Oliva f.o.b. destination to a customer on December 31, 2014. The customer was expected to receive the merchandise on January 6, 2015.
- Merchandise costing $46,000 which was shipped by Oliva f.o.b. shipping point to a customer on December 29, 2014. The customer was scheduled to receive the merchandise on January 2, 2015.
- Merchandise costing $83,000 shipped by a vendor f.o.b. destination on December 30, 2014, and received by Oliva on January 4, 2015.
- Merchandise costing $51,000 shipped by a vendor f.o.b. shipping point on December 31, 2014, and received by Oliva on January 5, 2015.
Instructions
Based on the above information, calculate the amount that should appear on Oliva's balance sheet at December 31, 2014, for inventory.
![]()
E8-3 (Inventoriable Costs) Assume that in an annual audit of Harlowe Inc. at December 31, 2014, you find the following transactions near the closing date.
- A special machine, fabricated to order for a customer, was finished and specifically segregated in the back part of the shipping room on December 31, 2014. The customer was billed on that date and the machine excluded from inventory although it was shipped on January 4, 2015.
- Merchandise costing $2,800 was received on January 3, 2015, and the related purchase invoice recorded January 5. The invoice showed the shipment was made on December 29, 2014, f.o.b. destination.
- A packing case containing a product costing $3,400 was standing in the shipping room when the physical inventory was taken. It was not included in the inventory because it was marked “Hold for shipping instructions.” Your investigation revealed that the customer's order was dated December 18, 2014, but that the case was shipped and the customer billed on January 10, 2015. The product was a stock item of your client.
- Merchandise received on January 6, 2015, costing $680 was entered in the purchase journal on January 7, 2015. The invoice showed shipment was made f.o.b. supplier's warehouse on December 31, 2014. Because it was not on hand at December 31, it was not included in inventory.
- Merchandise costing $720 was received on December 28, 2014, and the invoice was not recorded. You located it in the hands of the purchasing agent; it was marked “on consignment.”
Instructions
Assuming that each of the amounts is material, state whether the merchandise should be included in the client's inventory, and give your reason for your decision on each item.
![]()
![]()
E8-4 (Inventoriable Costs—Perpetual) Colin Davis Machine Company maintains a general ledger account for each class of inventory, debiting such accounts for increases during the period and crediting them for decreases. The transactions below relate to the Raw Materials inventory account, which is debited for materials purchased and credited for materials requisitioned for use.
- An invoice for $8,100, terms f.o.b. destination, was received and entered January 2, 2014. The receiving report shows that the materials were received December 28, 2013.
- Materials costing $28,000, shipped f.o.b. destination, were not entered by December 31, 2013, “because they were in a railroad car on the company's siding on that date and had not been unloaded.”
- Materials costing $7,300 were returned to the supplier on December 29, 2013, and were shipped f.o.b. shipping point. The return was entered on that date, even though the materials are not expected to reach the supplier's place of business until January 6, 2014.
- An invoice for $7,500, terms f.o.b. shipping point, was received and entered December 30, 2013. The receiving report shows that the materials were received January 4, 2014, and the bill of lading shows that they were shipped January 2, 2014.
- Materials costing $19,800 were received December 30, 2013, but no entry was made for them because “they were ordered with a specified delivery of no earlier than January 10, 2014.”
Instructions
Prepare correcting general journal entries required at December 31, 2013, assuming that the books have not been closed.
![]()
![]()
E8-5 (Inventoriable Costs—Error Adjustments) Craig Company asks you to review its December 31, 2014, inventory values and prepare the necessary adjustments to the books. The following information is given to you.
- Craig uses the periodic method of recording inventory. A physical count reveals $234,890 of inventory on hand at December 31, 2014.
- Not included in the physical count of inventory is $13,420 of merchandise purchased on December 15 from Browser. This merchandise was shipped f.o.b. shipping point on December 29 and arrived in January. The invoice arrived and was recorded on December 31.
- Included in inventory is merchandise sold to Champy on December 30, f.o.b. destination. This merchandise was shipped after it was counted. The invoice was prepared and recorded as a sale on account for $12,800 on December 31. The merchandise cost $7,350, and Champy received it on January 3.
- Included in inventory was merchandise received from Dudley on December 31 with an invoice price of $15,630. The merchandise was shipped f.o.b. destination. The invoice, which has not yet arrived, has not been recorded.
- Not included in inventory is $8,540 of merchandise purchased from Glowser Industries. This merchandise was received on December 31 after the inventory had been counted. The invoice was received and recorded on December 30.
- Included in inventory was $10,438 of inventory held by Craig on consignment from Jackel Industries.
- Included in inventory is merchandise sold to Kemp f.o.b. shipping point. This merchandise was shipped after it was counted. The invoice was prepared and recorded as a sale for $18,900 on December 31. The cost of this merchandise was $10,520, and Kemp received the merchandise on January 5.
- Excluded from inventory was a carton labeled “Please accept for credit.” This carton contains merchandise costing $1,500 which had been sold to a customer for $2,600. No entry had been made to the books to reflect the return, but none of the returned merchandise seemed damaged.
Instructions
(a) Determine the proper inventory balance for Craig Company at December 31, 2014.
(b) Prepare any correcting entries to adjust inventory to its proper amount at December 31, 2014. Assume the books have not been closed.
E8-6 (Determining Merchandise Amounts—Periodic) Two or more items are omitted in each of the following tabulations of income statement data. Fill in the amounts that are missing.
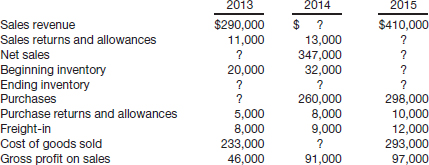
![]()
E8-7 (Purchases Recorded Net) Presented below are transactions related to Tom Brokaw, Inc.
| May 10 | Purchased goods billed at $15,000 subject to cash discount terms of 2/10, n/60. |
| 11 | Purchased goods billed at $13,200 subject to terms of 1/15, n/30. |
| 19 | Paid invoice of May 10. |
| 24 | Purchased goods billed at $11,500 subject to cash discount terms of 2/10, n/30. |
Instructions
(a) Prepare general journal entries for the transactions above under the assumption that purchases are to be recorded at net amounts after cash discounts and that discounts lost are to be treated as financial expense.
(b) Assuming no purchase or payment transactions other than those given above, prepare the adjusting entry required on May 31 if financial statements are to be prepared as of that date.
![]()
E8-8 (Purchases Recorded, Gross Method) Cruise Industries purchased $10,800 of merchandise on February 1, 2014, subject to a trade discount of 10% and with credit terms of 3/15, n/60. It returned $2,500 (gross price before trade or cash discount) on February 4. The invoice was paid on February 13.
Instructions
(a) Assuming that Cruise uses the perpetual method for recording merchandise transactions, record the purchase, return, and payment using the gross method.
(b) Assuming that Cruise uses the periodic method for recording merchandise transactions, record the purchase, return, and payment using the gross method.
(c) At what amount would the purchase on February 1 be recorded if the net method were used?
![]()
E8-9 (Periodic versus Perpetual Entries) Fong Sai-Yuk Company sells one product. Presented below is information for January for Fong Sai-Yuk Company.
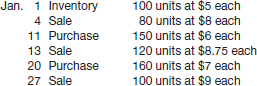
Fong Sai-Yuk uses the FIFO cost flow assumption. All purchases and sales are on account.
Instructions
(a) Assume Fong Sai-Yuk uses a periodic system. Prepare all necessary journal entries, including the end-of-month closing entry to record cost of goods sold. A physical count indicates that the ending inventory for January is 110 units.
(b) Compute gross profit using the periodic system.
(c) Assume Fong Sai-Yuk uses a perpetual system. Prepare all necessary journal entries.
(d) Compute gross profit using the perpetual system.
![]()
E8-10 (Inventory Errors—Periodic) Ann M. Martin Company makes the following errors during the current year. (Evaluate each case independently and assume ending inventory in the following year is correctly stated.)
- Ending inventory is overstated, but purchases and related accounts payable are recorded correctly.
- Both ending inventory and purchases and related accounts payable are understated. (Assume this purchase was recorded and paid for in the following year.)
- Ending inventory is correct, but a purchase on account was not recorded. (Assume this purchase was recorded and paid for in the following year.)
Indicate the effect of each of these errors on working capital, current ratio (assume that the current ratio is greater than 1), retained earnings, and net income for the current year and the subsequent year.
![]()
E8-11 (Inventory Errors) At December 31, 2013, Stacy McGill Corporation reported current assets of $370,000 and current liabilities of $200,000. The following items may have been recorded incorrectly.
- Goods purchased costing $22,000 were shipped f.o.b. shipping point by a supplier on December 28. McGill received and recorded the invoice on December 29, 2013, but the goods were not included in McGill's physical count of inventory because they were not received until January 4, 2014.
- Goods purchased costing $15,000 were shipped f.o.b. destination by a supplier on December 26. McGill received and recorded the invoice on December 31, but the goods were not included in McGill's 2013 physical count of inventory because they were not received until January 2, 2014.
- Goods held on consignment from Claudia Kishi Company were included in McGill's December 31, 2013, physical count of inventory at $13,000.
- Freight-in of $3,000 was debited to advertising expense on December 28, 2013.
Instructions
(a) Compute the current ratio based on McGill's balance sheet.
(b) Recompute the current ratio after corrections are made.
(c) By what amount will income (before taxes) be adjusted up or down as a result of the corrections?
![]()
E8-12 (Inventory Errors) The net income per books of Linda Patrick Company was determined without knowledge of the errors indicated.
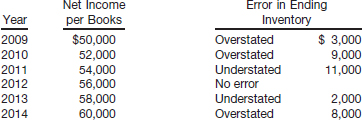
Instructions
Prepare a worksheet to show the adjusted net income figure for each of the 6 years after taking into account the inventory errors.
![]()
![]()
E8-13 (FIFO and LIFO—Periodic and Perpetual) Inventory information for Part 311 of Monique Aaron Corp. discloses the following information for the month of June.
![]()
Instructions
(a) Assuming that the periodic inventory method is used, compute the cost of goods sold and ending inventory under (1) LIFO and (2) FIFO.
(b) Assuming that the perpetual inventory method is used and costs are computed at the time of each withdrawal, what is the value of the ending inventory at LIFO?
(c) Assuming that the perpetual inventory method is used and costs are computed at the time of each withdrawal, what is the gross profit if the inventory is valued at FIFO?
(d) Why is it stated that LIFO usually produces a lower gross profit than FIFO?
![]()
E8-14 (FIFO, LIFO and Average-Cost Determination) John Adams Company's record of transactions for the month of April was as follows.
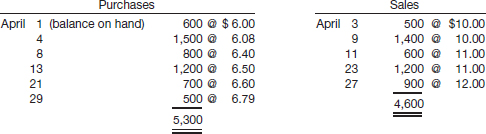
(a) Assuming that periodic inventory records are kept in units only, compute the inventory at April 30 using (1) LIFO and (2) average-cost.
(b) Assuming that perpetual inventory records are kept in dollars, determine the inventory using (1) FIFO and (2) LIFO.
(c) Compute cost of goods sold assuming periodic inventory procedures and inventory priced at FIFO.
(d) In an inflationary period, which inventory method—FIFO, LIFO, average-cost—will show the highest net income?
![]()
E8-15 (FIFO, LIFO, Average-Cost Inventory) Shania Twain Company was formed on December 1, 2013. The following information is available from Twain's inventory records for Product BAP.
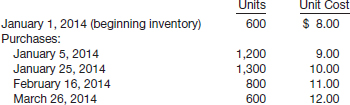
A physical inventory on March 31, 2014, shows 1,600 units on hand.
Instructions
Prepare schedules to compute the ending inventory at March 31, 2014, under each of the following inventory methods.
(a) FIFO.
(b) LIFO.
(c) Weighted-average (round unit costs to two decimal places).
![]()
E8-16 (Compute FIFO, LIFO, Average-Cost—Periodic) Presented below is information related to Blowfish radios for the Hootie Company for the month of July.
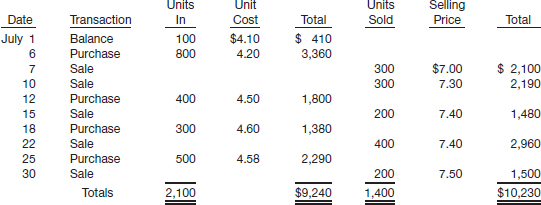
Instructions
(a) Assuming that the periodic inventory method is used, compute the inventory cost at July 31 under each of the following cost flow assumptions.
(1) FIFO.
(2) LIFO.
(3) Weighted-average.
(b) Answer the following questions.
(1) Which of the methods used above will yield the lowest figure for gross profit for the income statement? Explain why.
(2) Which of the methods used above will yield the lowest figure for ending inventory for the balance sheet? Explain why.
![]()
![]()
E8-17 (FIFO and LIFO—Periodic and Perpetual) The following is a record of Pervis Ellison Company's transactions for Boston Teapots for the month of May 2014.
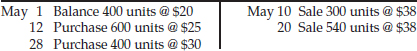
(a) Assuming that perpetual inventories are not maintained and that a physical count at the end of the month shows 560 units on hand, what is the cost of the ending inventory using (1) FIFO and (2) LIFO?
(b) Assuming that perpetual records are maintained and they tie into the general ledger, calculate the ending inventory using (1) FIFO and (2) LIFO.
![]()
E8-18 (FIFO and LIFO; Income Statement Presentation) The board of directors of Ichiro Corporation is considering whether or not it should instruct the accounting department to shift from a first-in, first-out (FIFO) basis of pricing inventories to a last-in, first-out (LIFO) basis. The following information is available.
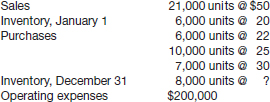
Instructions
Prepare a condensed income statement for the year on both bases for comparative purposes.
![]()
E8-19 (FIFO and LIFO Effects) You are the vice president of finance of Sandy Alomar Corporation, a retail company that prepared two different schedules of gross margin for the first quarter ended March 31, 2014. These schedules appear below.
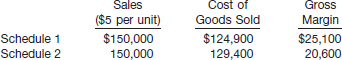
The computation of cost of goods sold in each schedule is based on the following data.
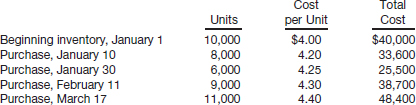
Jane Torville, the president of the corporation, cannot understand how two different gross margins can be computed from the same set of data. As the vice president of finance, you have explained to Ms. Torville that the two schedules are based on different assumptions concerning the flow of inventory costs, i.e., FIFO and LIFO. Schedules 1 and 2 were not necessarily prepared in this sequence of cost flow assumptions.
Instructions
Prepare two separate schedules computing cost of goods sold and supporting schedules showing the composition of the ending inventory under both cost flow assumptions.
![]()
E8-20 (FIFO and LIFO—Periodic) Johnny Football Shop began operations on January 2, 2014. The following stock record card for footballs was taken from the records at the end of the year.
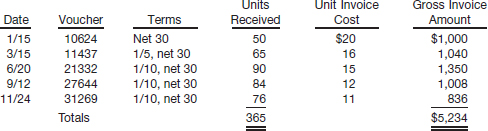
A physical inventory on December 31, 2014, reveals that 100 footballs were in stock. The bookkeeper informs you that all the discounts were taken. Assume that Johnny Football Shop uses the invoice price less discount for recording purchases.
(a) Compute the December 31, 2014, inventory using the FIFO method.
(b) Compute the 2014 cost of goods sold using the LIFO method.
(c) What method would you recommend to the owner to minimize income taxes in 2014, using the inventory information for footballs as a guide?
![]()
E8-21 (LIFO Effect) The following example was provided to encourage the use of the LIFO method. In a nutshell, LIFO subtracts inflation from inventory costs, deducts it from taxable income, and records it in a LIFO reserve account on the books. The LIFO benefit grows as inflation widens the gap between current-year and past-year (minus inflation) inventory costs. This gap is:
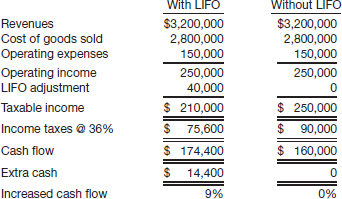
Instructions
(a) Explain what is meant by the LIFO reserve account.
(b) How does LIFO subtract inflation from inventory costs?
(c) Explain how the cash flow of $174,400 in this example was computed. Explain why this amount may not be correct.
(d) Why does a company that uses LIFO have extra cash? Explain whether this situation will always exist.
![]()
![]()
E8-22 (Alternative Inventory Methods—Comprehensive) Tori Amos Corporation began operations on December 1, 2013. The only inventory transaction in 2013 was the purchase of inventory on December 10, 2013, at a cost of $20 per unit. None of this inventory was sold in 2013. Relevant information is as follows.
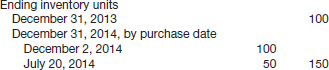
During the year, the following purchases and sales were made.
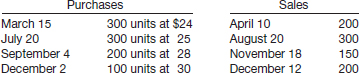
The company uses the periodic inventory method.
Instructions
(a) Determine ending inventory under (1) specific identification, (2) FIFO, (3) LIFO, and (4) average-cost.
(b) Determine ending inventory using dollar-value LIFO. Assume that the December 2, 2014, purchase cost is the current cost of inventory. (Hint: The beginning inventory is the base layer priced at $20 per unit.)
![]()
E8-23 (Dollar-Value LIFO) Oasis Company has used the dollar-value LIFO method for inventory cost determination for many years. The following data were extracted from Oasis’ records.
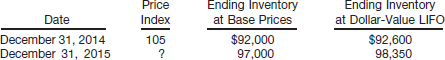
Instructions
Calculate the index used for 2015 that yielded the above results.
E8-24 (Dollar-Value LIFO) The dollar-value LIFO method was adopted by Enya Corp. on January 1, 2014. Its inventory on that date was $160,000. On December 31, 2014, the inventory at prices existing on that date amounted to $140,000. The price level at January 1, 2014, was 100, and the price level at December 31, 2014, was 112.
Instructions
(a) Compute the amount of the inventory at December 31, 2014, under the dollar-value LIFO method.
(b) On December 31, 2015, the inventory at prices existing on that date was $172,500, and the price level was 115. Compute the inventory on that date under the dollar-value LIFO method.
![]()
E8-25 (Dollar-Value LIFO) Presented below is information related to Dino Radja Company.
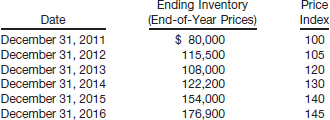
Instructions
Compute the ending inventory for Dino Radja Company for 2011 through 2016 using the dollar-value LIFO method.
![]()
E8-26 (Dollar-Value LIFO) The following information relates to the Jimmy Johnson Company.
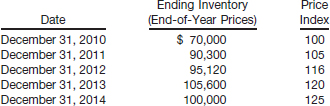
Instructions
Use the dollar-value LIFO method to compute the ending inventory for Johnson Company for 2010 through 2014.
EXERCISES SET B
See the book's companion website, at www.wiley.com/college/kieso, for an additional set of exercises.
PROBLEMS
![]()
![]()
![]()
![]()
P8-1 (Various Inventory Issues) The following independent situations relate to inventory accounting.
- Kim Co. purchased goods with a list price of $175,000, subject to trade discounts of 20% and 10%, with no cash discounts allowable. How much should Kim Co. record as the cost of these goods?
- Keillor Company's inventory of $1,100,000 at December 31, 2014, was based on a physical count of goods priced at cost and before any year-end adjustments relating to the following items.
(a) Goods shipped from a vendor f.o.b. shipping point on December 24, 2014, at an invoice cost of $69,000 to Keillor Company were received on January 4, 2015.
(b) The physical count included $29,000 of goods billed to Sakic Corp. f.o.b. shipping point on December 31, 2014. The carrier picked up these goods on January 3, 2015.
What amount should Keillor report as inventory on its balance sheet?
- Zimmerman Corp. had 1,500 units of part M.O. on hand May 1, 2014, costing $21 each. Purchases of part M.O. during May were as follows.
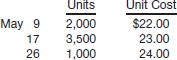
A physical count on May 31, 2014, shows 2,000 units of part M.O. on hand. Using the FIFO method, what is the cost of part M.O. inventory at May 31, 2014? Using the LIFO method, what is the inventory cost? Using the average-cost method, what is the inventory cost?
- Ashbrook Company adopted the dollar-value LIFO method on January 1, 2014 (using internal price indexes and multiple pools). The following data are available for inventory pool A for the 2 years following adoption of LIFO.
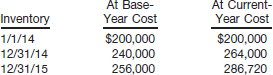
Computing an internal price index and using the dollar-value LIFO method, at what amount should the inventory be reported at December 31, 2015?
- Donovan Inc., a retail store chain, had the following information in its general ledger for the year 2015.
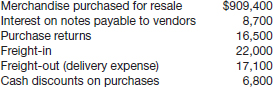
What is Donovan's inventoriable cost for 2015?
Instructions
Answer each of the preceding questions about inventories, and explain your answers.
![]()
![]()
![]()
P8-2 (Inventory Adjustments) Dimitri Company, a manufacturer of small tools, provided the following information from its accounting records for the year ended December 31, 2014.
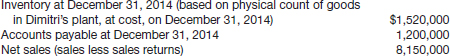
Additional information is as follows.
- Included in the physical count were tools billed to a customer f.o.b. shipping point on December 31, 2014. These tools had a cost of $31,000 and were billed at $40,000. The shipment was on Dimitri's loading dock waiting to be picked up by the common carrier.
- Goods were in transit from a vendor to Dimitri on December 31, 2014. The invoice cost was $76,000, and the goods were shipped f.o.b. shipping point on December 29, 2014.
- Work in process inventory costing $30,000 was sent to an outside processor for plating on December 30, 2014.
- Tools returned by customers and held pending inspection in the returned goods area on December 31, 2014, were not included in the physical count. On January 8, 2015, the tools costing $32,000 were inspected and returned to inventory. Credit memos totaling $47,000 were issued to the customers on the same date.
- Tools shipped to a customer f.o.b. destination on December 26, 2014, were in transit at December 31, 2014, and had a cost of $26,000. Upon notification of receipt by the customer on January 2, 2015, Dimitri issued a sales invoice for $42,000.
- Goods, with an invoice cost of $27,000, received from a vendor at 5:00 p.m. on December 31, 2014, were recorded on a receiving report dated January 2, 2015. The goods were not included in the physical count, but the invoice was included in accounts payable at December 31, 2014.
- Goods received from a vendor on December 26, 2014, were included in the physical count. However, the related $56,000 vendor invoice was not included in accounts payable at December 31, 2014, because the accounts payable copy of the receiving report was lost.
- On January 3, 2015, a monthly freight bill in the amount of $8,000 was received. The bill specifically related to merchandise purchased in December 2014, one-half of which was still in the inventory at December 31, 2014. The freight charges were not included in either the inventory or in accounts payable at December 31, 2014.
Using the format shown below, prepare a schedule of adjustments as of December 31, 2014, to the initial amounts per Dimitri's accounting records. Show separately the effect, if any, of each of the eight transactions on the December 31, 2014, amounts. If the transactions would have no effect on the initial amount shown, enter NONE.
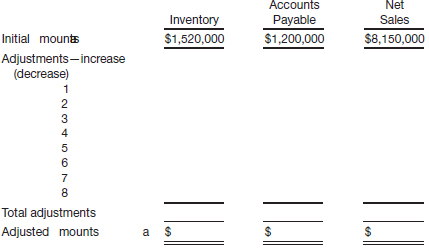
(AICPA adapted)
![]()
P8-3 (Purchases Recorded Gross and Net) Some of the transactions of Torres Company during August are listed below. Torres uses the periodic inventory method.
| August 10 | Purchased merchandise on account, $12,000, terms 2/10, n/30. |
| 13 | Returned part of the purchase of August 10, $1,200, and received credit on account. |
| 15 | Purchased merchandise on account, $16,000, terms 1/10, n/60. |
| 25 | Purchased merchandise on account, $20,000, terms 2/10, n/30. |
| 28 | Paid invoice of August 15 in full. |
Instructions
(a) Assuming that purchases are recorded at gross amounts and that discounts are to be recorded when taken:
(1) Prepare general journal entries to record the transactions.
(2) Describe how the various items would be shown in the financial statements.
(b) Assuming that purchases are recorded at net amounts and that discounts lost are treated as financial expenses:
(1) Prepare general journal entries to enter the transactions.
(2) Prepare the adjusting entry necessary on August 31 if financial statements are to be prepared at that time.
(3) Describe how the various items would be shown in the financial statements.
(c) Which of the two methods do you prefer and why?
![]()
![]()
P8-4 (Compute FIFO, LIFO, and Average-Cost) Hull Company's record of transactions concerning part X for the month of April was as follows.
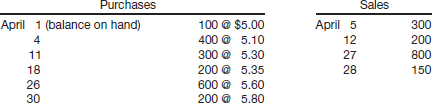
Instructions
(a) Compute the inventory at April 30 on each of the following bases. Assume that perpetual inventory records are kept in units only. Carry unit costs to the nearest cent.
(1) First-in, first-out (FIFO).
(2) Last-in, first-out (LIFO).
(3) Average-cost.
(b) If the perpetual inventory record is kept in dollars, and costs are computed at the time of each withdrawal, what amount would be shown as ending inventory in (1), (2), and (3) above? (Carry average unit costs to four decimal places.)
P8-5 (Compute FIFO, LIFO, and Average-Cost) Some of the information found on a detail inventory card for Slatkin Inc. for the first month of operations is as follows.
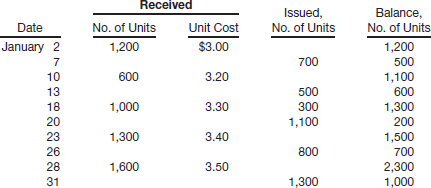
Instructions
(a) From these data compute the ending inventory on each of the following bases. Assume that perpetual inventory records are kept in units only. (Carry unit costs to the nearest cent and ending inventory to the nearest dollar.)
(1) First-in, first-out (FIFO).
(2) Last-in, first-out (LIFO).
(3) Average-cost.
(b) If the perpetual inventory record is kept in dollars, and costs are computed at the time of each withdrawal, would the amounts shown as ending inventory in (1), (2), and (3) above be the same? Explain and compute. (Round average unit costs to four decimal places.)
![]()
![]()
![]()
P8-6 (Compute FIFO, LIFO, Average-Cost—Periodic and Perpetual) Ehlo Company is a multiproduct firm. Presented below is information concerning one of its products, the Hawkeye.
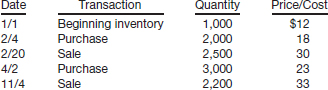
Instructions
Compute cost of goods sold, assuming Ehlo uses:
(a) Periodic system, FIFO cost flow.
(b) Perpetual system, FIFO cost flow.
(c) Periodic system, LIFO cost flow.
(d) Perpetual system, LIFO cost flow.
(e) Periodic system, weighted-average cost flow.
(f) Perpetual system, moving-average cost flow.
![]()
![]()
P8-7 (Financial Statement Effects of FIFO and LIFO) The management of Tritt Company has asked its accounting department to describe the effect upon the company's financial position and its income statements of accounting for inventories on the LIFO rather than the FIFO basis during 2014 and 2015. The accounting department is to assume that the change to LIFO would have been effective on January 1, 2014, and that the initial LIFO base would have been the inventory value on December 31, 2013. Presented below are the company's financial statements and other data for the years 2014 and 2015 when the FIFO method was employed.
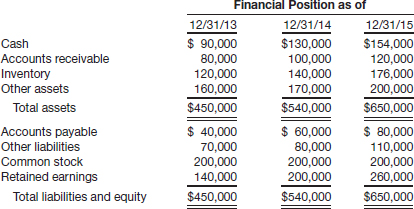
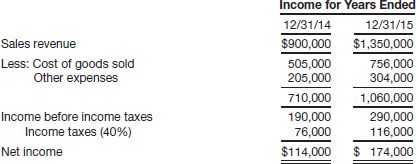
Other data:
- Inventory on hand at December 31, 2013, consisted of 40,000 units valued at $3.00 each.
- Sales (all units sold at the same price in a given year):

- Purchases (all units purchased at the same price in given year):

- Income taxes at the effective rate of 40% are paid on December 31 each year.
Instructions
Name the account(s) presented in the financial statements that would have different amounts for 2015 if LIFO rather than FIFO had been used, and state the new amount for each account that is named. Show computations.
(CMA adapted)
![]()
P8-8 (Dollar-Value LIFO) Norman's Televisions produces television sets in three categories: portable, midsize, and flat-screen. On January 1, 2014, Norman adopted dollar-value LIFO and decided to use a single inventory pool. The company's January 1 inventory consists of:
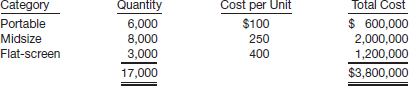
During 2014, the company had the following purchases and sales.
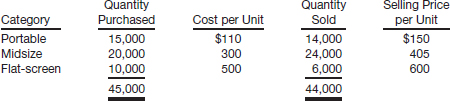
Instructions
(Round to four decimals.)
(a) Compute ending inventory, cost of goods sold, and gross profit.
(b) Assume the company uses three inventory pools instead of one. Repeat instruction (a).
![]()
![]()
P8-9 (Internal Indexes—Dollar-Value LIFO) On January 1, 2014, Bonanza Wholesalers Inc. adopted the dollar-value LIFO inventory method for income tax and external financial reporting purposes. However, Bonanza continued to use the FIFO inventory method for internal accounting and management purposes. In applying the LIFO method, Bonanza uses internal conversion price indexes and the multiple pools approach under which substantially identical inventory items are grouped into LIFO inventory pools. The following data were available for inventory pool no. 1, which comprises products A and B, for the 2 years following the adoption of LIFO.
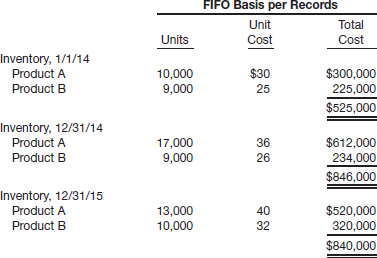
Instructions
(a) Prepare a schedule to compute the internal conversion price indexes for 2014 and 2015. Round indexes to two decimal places.
(b) Prepare a schedule to compute the inventory amounts at December 31, 2014 and 2015, using the dollar-value LIFO inventory method.
(AICPA adapted)
![]()
P8-10 (Internal Indexes—Dollar-Value LIFO) Presented below is information related to Kaisson Corporation for the last 3 years.
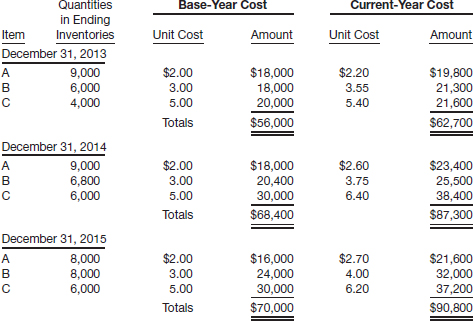
Instructions
Compute the ending inventories under the dollar-value LIFO method for 2013, 2014, and 2015. The base period is January 1, 2013, and the beginning inventory cost at that date was $45,000. Compute indexes to two decimal places.
![]()
![]()
P8-11 (Dollar-Value LIFO) Richardson Company cans a variety of vegetable-type soups. Recently, the company decided to value its inventories using dollar-value LIFO pools. The clerk who accounts for inventories does not understand how to value the inventory pools using this new method, so, as a private consultant, you have been asked to teach him how this new method works.
He has provided you with the following information about purchases made over a 6-year period.
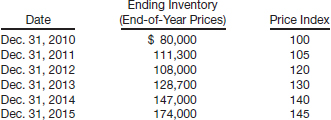
You have already explained to him how this inventory method is maintained, but he would feel better about it if you were to leave him detailed instructions explaining how these calculations are done and why he needs to put all inventories at a base-year value.
Instructions
(a) Compute the ending inventory for Richardson Company for 2010 through 2015 using dollar-value LIFO.
(b) Using your computation schedules as your illustration, write a step-by-step set of instructions explaining how the calculations are done. Begin your explanation by briefly explaining the theory behind this inventory method, including the purpose of putting all amounts into base-year price levels.
PROBLEMS SET B
See the book's companion website, at www.wiley.com/college/kieso, for an additional set of problems.
CONCEPTS FOR ANALYSIS
CA8-1 (Inventoriable Costs) You are asked to travel to Milwaukee to observe and verify the inventory of the Milwaukee branch of one of your clients. You arrive on Thursday, December 30, and find that the inventory procedures have just been started. You spot a railway car on the sidetrack at the unloading door and ask the warehouse superintendent, Buck Rogers, how he plans to inventory the contents of the car. He responds, “We are not going to include the contents in the inventory.”
Later in the day, you ask the bookkeeper for the invoice on the carload and the related freight bill. The invoice lists the various items, prices, and extensions of the goods in the car. You note that the carload was shipped December 24 from Albuquerque, f.o.b. Albuquerque, and that the total invoice price of the goods in the car was $35,300. The freight bill called for a payment of $1,500. Terms were net 30 days. The bookkeeper affirms the fact that this invoice is to be held for recording in January.
Instructions
(a) Does your client have a liability that should be recorded at December 31? Discuss.
(b) Prepare a journal entry(ies), if required, to reflect any accounting adjustment required. Assume a perpetual inventory system is used by your client.
(c) For what possible reason(s) might your client wish to postpone recording the transaction?
CA8-2 (Inventoriable Costs) Brian Erlacher, an inventory control specialist, is interested in better understanding the accounting for inventories. Although Brian understands the more sophisticated computer inventory control systems, he has little knowledge of how inventory cost is determined. In studying the records of Strider Enterprises, which sells normal brand-name goods from its own store and on consignment through Chavez Inc., he asks you to answer the following questions.
Instructions
(a) Should Strider Enterprises include in its inventory normal brand-name goods purchased from its suppliers but not yet received if the terms of purchase are f.o.b. shipping point (manufacturer's plant)? Why?
(b) Should Strider Enterprises include freight-in expenditures as an inventory cost? Why?
(c) If Strider Enterprises purchases its goods on terms 2/10, net 30, should the purchases be recorded gross or net? Why?
(d) What are products on consignment? How should they be reported in the financial statements?
(AICPA adapted)
CA8-3 (Inventoriable Costs) George Solti, the controller for Garrison Lumber Company, has recently hired you as assistant controller. He wishes to determine your expertise in the area of inventory accounting and therefore asks you to answer the following unrelated questions.
(a) A company is involved in the wholesaling and retailing of automobile tires for foreign cars. Most of the inventory is imported, and it is valued on the company's records at the actual inventory cost plus freight-in. At year-end, the warehousing costs are prorated over cost of goods sold and ending inventory. Are warehousing costs considered a product cost or a period cost?
(b) A certain portion of a company's “inventory” is composed of obsolete items. Should obsolete items that are not currently consumed in the production of “goods or services to be available for sale” be classified as part of inventory?
(c) A company purchases airplanes for sale to others. However, until they are sold, the company charters and services the planes. What is the proper way to report these airplanes in the company's financial statements?
(d) A company wants to buy coal deposits but does not want the financing for the purchase to be reported on its financial statements. The company therefore establishes a trust to acquire the coal deposits. The company agrees to buy the coal over a certain period of time at specified prices. The trust is able to finance the coal purchase and pay off the loan as it is paid by the company for the minerals. How should this transaction be reported?
CA8-4 (Accounting Treatment of Purchase Discounts) Shawnee Corp., a household appliances dealer, purchases its inventories from various suppliers. Shawnee has consistently stated its inventories at the lower-of-cost (FIFO)-or-market.
Instructions
Shawnee is considering alternate methods of accounting for the cash discounts it takes when paying its suppliers promptly. From a theoretical standpoint, discuss the acceptability of each of the following methods.
(a) Financial income when payments are made.
(b) Reduction of cost of goods sold for the period when payments are made.
(c) Direct reduction of purchase cost.
(AICPA adapted)
CA8-5 (General Inventory Issues) In January 2014, Susquehanna Inc. requested and secured permission from the commissioner of the Internal Revenue Service to compute inventories under the last-in, first-out (LIFO) method and elected to determine inventory cost under the dollar-value LIFO method. Susquehanna Inc. satisfied the commissioner that cost could be accurately determined by use of an index number computed from a representative sample selected from the company's single inventory pool.
Instructions
(a) Why should inventories be included in (1) a balance sheet and (2) the computation of net income?
(b) The Internal Revenue Code allows some accountable events to be considered differently for income tax reporting purposes and financial accounting purposes, while other accountable events must be reported the same for both purposes. Discuss why it might be desirable to report some accountable events differently for financial accounting purposes than for income tax reporting purposes.
(c) Discuss the ways and conditions under which the FIFO and LIFO inventory costing methods produce different inventory valuations. Do not discuss procedures for computing inventory cost.
(AICPA adapted)
CA8-6 (LIFO Inventory Advantages) Jane Yoakam, president of Estefan Co., recently read an article that claimed that at least 100 of the country's largest 500 companies were either adopting or considering adopting the last-in, first-out (LIFO) method for valuing inventories. The article stated that the firms were switching to LIFO to (1) neutralize the effect of inflation in their financial statements, (2) eliminate inventory profits, and (3) reduce income taxes. Ms. Yoakam wonders if the switch would benefit her company.
Estefan currently uses the first-in, first-out (FIFO) method of inventory valuation in its periodic inventory system. The company has a high inventory turnover rate, and inventories represent a significant proportion of the assets.
Ms. Yoakam has been told that the LIFO system is more costly to operate and will provide little benefit to companies with high turnover. She intends to use the inventory method that is best for the company in the long run rather than selecting a method just because it is the current fad.
(a) Explain to Ms. Yoakam what “inventory profits” are and how the LIFO method of inventory valuation could reduce them.
(b) Explain to Ms. Yoakam the conditions that must exist for Estefan Co. to receive tax benefits from a switch to the LIFO method.
![]()
CA8-7 (Average-Cost, FIFO, and LIFO) Prepare a memorandum containing responses to the following items.
(a) Describe the cost flow assumptions used in average-cost, FIFO, and LIFO methods of inventory valuation.
(b) Distinguish between weighted-average-cost and moving-average-cost for inventory costing purposes.
(c) Identify the effects on both the balance sheet and the income statement of using the LIFO method instead of the FIFO method for inventory costing purposes over a substantial time period when purchase prices of inventoriable items are rising. State why these effects take place.
![]()
CA8-8 (LIFO Application and Advantages) Geddes Corporation is a medium-sized manufacturing company with two divisions and three subsidiaries, all located in the United States. The Metallic Division manufactures metal castings for the automotive industry, and the Plastic Division produces small plastic items for electrical products and other uses. The three subsidiaries manufacture various products for other industrial users.
Geddes Corporation plans to change from the lower of first-in, first-out (FIFO)-cost-or market method of inventory valuation to the last-in, first-out (LIFO) method of inventory valuation to obtain tax benefits. To make the method acceptable for tax purposes, the change also will be made for its annual financial statements.
Instructions
(a) Describe the establishment of and subsequent pricing procedures for each of the following LIFO inventory methods.
(1) LIFO applied to units of product when the periodic inventory system is used.
(2) Application of the dollar-value method to LIFO units of product.
(b) Discuss the specific advantages and disadvantages of using the dollar-value LIFO application as compared to specific goods LIFO (unit LIFO). (Ignore income tax considerations.)
(c) Discuss the general advantages and disadvantages claimed for LIFO methods.
![]()
CA8-9 (Dollar-Value LIFO Issues) Arruza Co. is considering switching from the specific-goods LIFO approach to the dollar-value LIFO approach. Because the financial personnel at Arruza know very little about dollar-value LIFO, they ask you to answer the following questions.
(a) What is a LIFO pool?
(b) Is it possible to use a LIFO pool concept and not use dollar-value LIFO? Explain.
(c) What is a LIFO liquidation?
(d) How are price indexes used in the dollar-value LIFO method?
(e) What are the advantages of dollar-value LIFO over specific-goods LIFO?
![]()
CA8-10 (FIFO and LIFO) Harrisburg Company is considering changing its inventory valuation method from FIFO to LIFO because of the potential tax savings. However, management wishes to consider all of the effects on the company, including its reported performance, before making the final decision.
The inventory account, currently valued on the FIFO basis, consists of 1,000,000 units at $8 per unit on January 1, 2014. There are 1,000,000 shares of common stock outstanding as of January 1, 2014, and the cash balance is $400,000.
The company has made the following forecasts for the period 2014–2016.
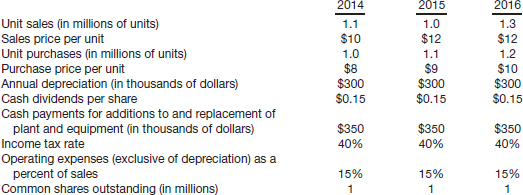
(a) Prepare a schedule that illustrates and compares the following data for Harrisburg Company under the FIFO and the LIFO inventory method for 2014–2016. Assume the company would begin LIFO at the beginning of 2014.
(1) Year-end inventory balances.
(2) Annual net income after taxes.
(3) Earnings per share.
(4) Cash balance.
Assume all sales are collected in the year of sale and all purchases, operating expenses, and taxes are paid during the year incurred.
(b) Using the data above, your answer to (a), and any additional issues you believe need to be considered, prepare a report that recommends whether or not Harrisburg Company should change to the LIFO inventory method. Support your conclusions with appropriate arguments.
(CMA adapted)
![]()
CA8-11 (LIFO Choices) Wilkens Company uses the LIFO method for inventory costing. In an effort to lower net income, company president Mike Wilkens tells the plant accountant to take the unusual step of recommending to the purchasing department a large purchase of inventory at year-end. The price of the item to be purchased has nearly doubled during the year, and the item represents a major portion of inventory value.
Instructions
Answer the following questions.
(a) Identify the major stakeholders. If the plant accountant recommends the purchase, what are the consequences?
(b) If Wilkens Company were using the FIFO method of inventory costing, would Mike Wilkens give the same order? Why or why not?
USING YOUR JUDGMENT
FINANCIAL REPORTING
Financial Statement Analysis Cases
Case 1 T J International
T J International was founded in 1969 as Trus Joist International. The firm, a manufacturer of specialty building products, has its headquarters in Boise, Idaho. The company, through its partnership in the Trus Joist MacMillan joint venture, develops and manufactures engineered lumber. This product is a high-quality substitute for structural lumber and uses lower-grade wood and materials formerly considered waste. The company also is majority owner of the Outlook Window Partnership, which is a consortium of three wood and vinyl window manufacturers.
Following is T J International's adapted income statement and information concerning inventories from its annual report.
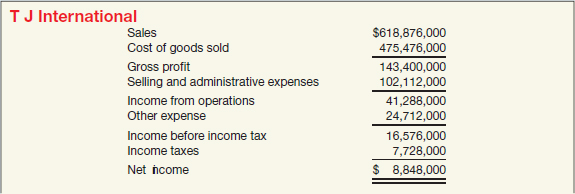
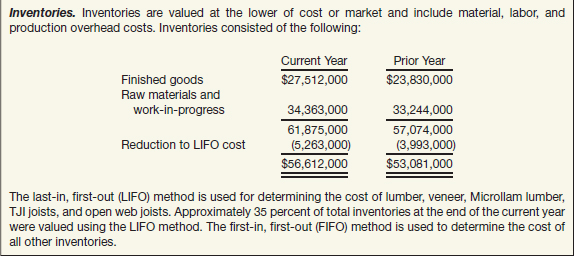
(a) How much would income before taxes have been if FIFO costing had been used to value all inventories?
(b) If the income tax rate is 46.6%, what would income tax have been if FIFO costing had been used to value all inventories? In your opinion, is this difference in net income between the two methods material? Explain.
(c) Does the use of a different costing system for different types of inventory mean that there is a different physical flow of goods among the different types of inventory? Explain.
Case 2 Noven Pharmaceuticals, Inc.
Noven Pharmaceuticals, Inc., headquartered in Miami, Florida, describes itself in a recent annual report as follows.
Noven Pharmaceuticals, Inc.
Noven is a place of ideas—a company where scientific excellence and state-of-the-art manufacturing combine to create new answers to human needs. Our transdermal delivery systems speed drugs painlessly and effortlessly into the bloodstream by means of a simple skin patch. This technology has proven applications in estrogen replacement, but at Noven we are developing a variety of systems incorporating bestselling drugs that fight everything from asthma, anxiety and dental pain to cancer, heart disease and neurological illness. Our research portfolio also includes new technologies, such as iontophoresis, in which drugs are delivered through the skin by means of electrical currents, as well as products that could satisfy broad consumer needs, such as our anti-microbial mouthrinse.
Noven also reported in its annual report that its activities to date have consisted of product development efforts, some of which have been independent and some of which have been completed in conjunction with Rhone-Poulenc Rorer (RPR) and Ciba-Geigy. The revenues so far have consisted of money received from licensing fees, “milestone” payments (payments made under licensing agreements when certain stages of the development of a certain product have been completed), and interest on its investments. The company expects that it will have significant revenue in the upcoming fiscal year from the launch of its first product, a transdermal estrogen delivery system.
The current assets portion of Noven's balance sheet follows.
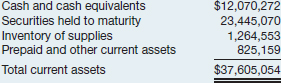
Inventory of supplies is recorded at the lower-of-cost (first-in, first-out)-or-net realizable value and consists mainly of supplies for research and development.
(a) What would you expect the physical flow of goods for a pharmaceutical manufacturer to be most like: FIFO, LIFO, or random (flow of goods does not follow a set pattern)? Explain.
(b) What are some of the factors that Noven should consider as it selects an inventory measurement method?
(c) Suppose that Noven had $49,000 in an inventory of transdermal estrogen delivery patches. These patches are from an initial production run and will be sold during the coming year. Why do you think that this amount is not shown in a separate inventory account? In which of the accounts shown is the inventory likely to be? At what point will the inventory be transferred to a separate inventory account?
Case 3 SUPERVALU
SUPERVALU reported the following data in its annual report.
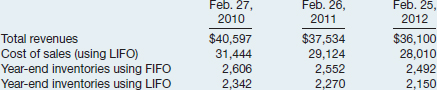
(a) Compute SUPERVALU's inventory turnovers for 2011 and 2012, using:
(1) Cost of sales and LIFO inventory.
(2) Cost of sales and FIFO inventory.
(b) Some firms calculate inventory turnover using sales rather than cost of goods sold in the numerator. Calculate SUPERVALU's 2011 and 2012 turnover, using:
(1) Sales and LIFO inventory.
(2) Sales and FIFO inventory.
(c) Describe the method that SUPERVALU's appears to use.
(d) State which method you would choose to evaluate SUPERVALU's performance. Justify your choice.
Accounting, Analysis, and Principles
Englehart Company sells two types of pumps. One is large and is for commercial use. The other is smaller and is used in residential swimming pools. The following inventory data is available for the month of March.
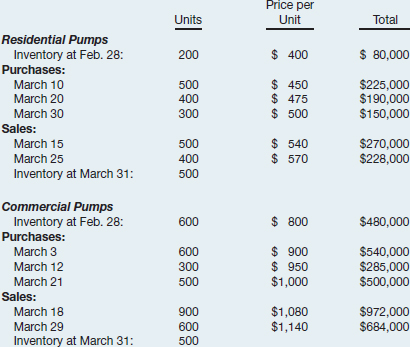
(a) Assuming Englehart uses a periodic inventory system, determine the cost of inventory on hand at March 31 and the cost of goods sold for March under first-in, first-out (FIFO).
(b) Assume Englehart uses dollar-value LIFO and one pool, consisting of the combination of residential and commercial pumps. Determine the cost of inventory on hand at March 31 and the cost of goods sold for March. Assume Englehart's initial adoption of LIFO is on March 1. Use the double-extension method to determine the appropriate price indices. (Hint: The price index for February 28/March 1 should be 1.00.) (Round the index to three decimal places.)
Analysis
(a) Assume you need to compute a current ratio for Englehart. Which inventory method (FIFO or dollar-value LIFO) do you think would give you a more meaningful current ratio?
(b) Some of Englehart's competitors use LIFO inventory costing and some use FIFO. How can an analyst compare the results of companies in an industry, when some use LIFO and others use FIFO?
Principles
Can companies change from one inventory accounting method to another? If a company changes to an inventory accounting method used by most of its competitors, what are the trade-offs in terms of the conceptual framework discussed in Chapter 2 of the textbook?
BRIDGE TO THE PROFESSION
![]() Professional Research: FASB Codification
Professional Research: FASB Codification
In conducting year-end inventory counts, your audit team is debating the impact of the client's right of return policy both on inventory valuation and revenue recognition. The assistant controller argues that there is no need to worry about the return policies since they have not changed in a while. The audit senior wants a more authoritative answer and has asked you to conduct some research of the authoritative literature before she presses the point with the client.
Instructions
If your school has a subscription to the FASB Codification, go to http://aaahq.org/asclogin.cfm to log in and prepare responses to the following. Provide Codification references for your responses.
(a) What is the authoritative guidance for revenue recognition when right of return exists?
(b) When is this guidance important for a company?
(c) Sales with high rates of return can ultimately cause inventory to be misstated. Why are returns allowed? Should different industries be able to make different types of return policies?
(d) In what situations would a reasonable estimate of returns be difficult to make?
Additional Professional Resources
See the book's companion website, at www.wiley.com/college/kieso, for professional simulations as well as other study resources.
Remember to check the book's companion website to find additional resources for this chapter.
1Some companies have developed methods of determining inventories, including statistical sampling, that are sufficiently reliable to make unnecessary an annual physical count of each item of inventory.
2Companies should not record abnormal freight, handling costs, and amounts of wasted materials (spoilage) as inventory costs. If the costs associated with the actual level of spoilage or product defects are greater than the costs associated with normal spoilage or defects, the company should charge the excess as an expense in the current period. [3]
3The reporting rules related to interest cost capitalization have their greatest impact in accounting for long-term assets. We therefore discuss them in Chapter 10.
4The motion picture industry provides a good illustration of the cost allocation problem. Often actors receive a percentage of net income for a given movie or television program. Some actors, however, have alleged that their programs have been extremely profitable to the motion picture studios but they have received little in the way of profit-sharing. Actors contend that the studios allocate additional costs to successful projects to avoid sharing profits.
5A study by James M. Reeve and Keith G. Stanga disclosed that the vast majority of respondent companies applying LIFO use the dollar-value method or the dollar-value retail method to apply LIFO. Only a small minority of companies use the specific-goods (unit LIFO) approach or the specific-goods pooling approach. See J.M. Reeve and K.G. Stanga, “The LIFO Pooling Decision,” Accounting Horizons (June 1987), p. 27.
6The Reeve and Stanga study (ibid.) reports that most companies have only a few pools—the median is six for retailers and three for nonretailers. But the distributions are highly skewed; some companies have 100 or more pools. Retailers that use LIFO have significantly more pools than nonretailers. About a third of the nonretailers (mostly manufacturers) use a single pool for their entire LIFO inventory.
7A later study shows that when quantities are increasing, multiple pools over a period of time may produce (under rather general conditions) significantly higher cost of goods sold deductions than a single-pool approach. When a stock-out occurs, a single-pool approach may lessen the layer liquidation for that year, but it may not erase the cumulative cost of goods sold advantage accruing to the use of multiple pools built up over the preceding years. See William R. Coon and Randall B. Hayes, “The Dollar Value LIFO Pooling Decision: The Conventional Wisdom Is Too General,” Accounting Horizons (December 1989), pp. 57–70.
8Indexes may be general (composed of several commodities, goods, or services) or specific (for one commodity, good, or service). Additionally, they may be external (computed by an outside party, such as the government, commodity exchange, or trade association) or internal (computed by the enterprise for its own product or service).
9To simplify the analysis, companies may use another approach, initially sanctioned by the Internal Revenue Service for tax purposes. Under this method, a company obtains an index from an outside source or by double-extending only a sample portion of the inventory. For example, the IRS allows all companies to use as their inflation rate for a LIFO pool 80 percent of the inflation rate reported by the appropriate consumer or producer price indexes prepared by the Bureau of Labor Statistics (BLS). Once the company obtains the index, it divides the ending inventory at current cost by the index to find the base-year cost. Using generally available external indexes greatly simplifies LIFO computations, and frees companies from having to compute internal indexes.
10It is suggested that companies analyze how inventory purchases are affected by price changes, how goods are stocked, how goods are used, and if future liquidations are likely. See William R. Cron and Randall Hayes, ibid., p. 57.
11In periods of rising prices, the use of fewer pools will translate into greater income tax benefits through the use of LIFO. The use of fewer pools allows companies to offset inventory reductions on some items and inventory increases in others. In contrast, the use of more pools increases the likelihood of liquidating old, low-cost inventory layers and incurring negative tax consequences. See Reeve and Stanga, ibid., pp. 28–29.
12Management often selects an accounting procedure because a lower tax results from its use, instead of an accounting method that is conceptually more appealing. Throughout this textbook, we identify accounting procedures that provide income tax benefits to the user.
13Companies should disclose the effects on income of LIFO inventory liquidations in the notes to the financial statements. [8]
14For example, General Tire and Rubber accelerated raw material purchases at the end of the year to minimize the book profit from a liquidation of LIFO inventories and to minimize income taxes for the year.
15Michael H. Granof and Daniel Short, “Why Do Companies Reject LIFO?” Journal of Accounting, Auditing, and Finance (Summer 1984), pp. 323–333 and Table 1, p. 327.
16Accounting Trends and Techniques—2012 reports that of 669 inventory method disclosures, 163 used LIFO, 312 used FIFO, 133 used average-cost, and 56 used other methods. As discussed in the opening story, because of steady or falling raw materials costs and costs savings from electronic data interchange and just-in-time technologies in recent years, many businesses using LIFO no longer experience substantial tax benefits. Even some companies for which LIFO is creating a benefit are finding that the administrative costs associated with LIFO are higher than the LIFO benefit obtained. As a result, some companies are moving to FIFO or average-cost.
17See Barry E. Cushing and Marc J. LeClere, “Evidence on the Determinants of Inventory Accounting Policy Choice,” The Accounting Review (April 1992), pp. 355–366 and Table 4, p. 363, for a list of factors hypothesized to affect FIFO–LIFO choices.
18See, for example, Shyam Sunder, “Relationship Between Accounting Changes and Stock Prices: Problems of Measurement and Some Empirical Evidence,” Empirical Research in Accounting: Selected Studies, 1973 (Chicago: University of Chicago), pp. 1–40. But see Robert Moren Brown, “Short-Range Market Reaction to Changes to LIFO Accounting Using Preliminary Earnings Announcement Dates,” The Journal of Accounting Research (Spring 1980), which found that companies that do change to LIFO suffer a short-run decline in the price of their stock.
19Note that a company can use one variation of LIFO for financial reporting purposes and another for tax without violating the LIFO conformity rule. Such a relaxation has caused many problems because the general approach to accounting for LIFO has been “whatever is good for tax is good for financial reporting.”
20For an interesting discussion of the reasons for and against the use of FIFO and average-cost, see Michael H. Granof and Daniel G. Short, “For Some Companies, FIFO Accounting Makes Sense,” Wall Street Journal (August 30, 1982); and the subsequent rebuttal by Gary C. Biddle, “Taking Stock of Inventory Accounting Choices,” Wall Street Journal (September 15, 1982).