14. HTML5: Introduction to canvas
With every experience, you alone are painting your own canvas, thought by thought, choice by choice.
—Oprah Winfrey
Observe Everything. Communicate Well. Draw, Draw, Draw.
—Frank Thomas
Do not go where the path may lead, go instead where there is no path and leave a trail.
—Ralph Waldo Emerson
Objectives
In this chapter you’ll:
• Draw lines, rectangles, arcs, circles, ellipses and text.
• Draw gradients and shadows.
• Draw images, create patterns and convert a color image to black and white.
• Draw Bezier and quadratic curves.
• Rotate, scale and transform.
• Dynamically resize a canvas to fill the window.
• Use alpha transparency and compositing techniques.
• Create an HTML5 canvas-based game app with sound and collision detection that’s easy to code and fun to play.
14.4 Using Paths to Draw Lines
14.12 Image Manipulation: Processing the Individual Pixels of a canvas
14.14.1 scale and translate Methods: Drawing Ellipses
14.14.2 rotate Method: Creating an Animation
14.14.3 transform Method: Drawing Skewed Rectangles
14.16 Resizing the canvas to Fill the Browser Window
14.19.2 Instance Variables and Constants
14.19.4 Functions startTimer and stopTimer
14.19.5 Function resetElements
14.19.7 Function updatePositions: Manual Frame-by-Frame Animation and Simple Collision Detection
14.19.8 Function fireCannonball
14.19.11 Function showGameOverDialog
14.20 save and restore Methods
Summary | Self-Review Exercises | Answers to Self-Review Exercises | Exercises
14.1. Introduction1
1 Due to the large number of examples in this chapter, most of the examples use embedded JavaScripts.
It’s taken us a while to get here, working hard to present many of the great new features of HTML5 and CSS3, and scripting in JavaScript. Now it’s time to exercise your creativity and have some fun.
Most people enjoy drawing. The canvas element, which you’ll learn to use in this chapter, provides a JavaScript application programming interface (API) with methods for drawing two-dimensional bitmapped graphics and animations, manipulating fonts and images, and inserting images and videos.
The canvas element is supported by all of the browsers we’ve used to test the book’s examples. To get a sense of the wide range of its capabilities, review the chapter objectives and outline. A key benefit of canvas is that it’s built into the browser, eliminating the need for plug-ins like Flash and Silverlight, thereby improving performance and convenience and reducing costs. At the end of the chapter we’ll build a fun Cannon Game, which in previous editions of this book was built in Flash.
14.2. canvas Coordinate System
To begin drawing, we first must understand canvas’s coordinate system (Fig. 14.1), a scheme for identifying every point on a canvas. By default, the upper-left corner of a canvas has the coordinates (0, 0). A coordinate pair has both an x-coordinate (the horizontal coordinate) and a y-coordinate (the vertical coordinate). The x-coordinate is the horizontal distance to the right from the left border of a canvas. The y-coordinate is the vertical distance downward from the top border of a canvas. The x-axis defines every horizontal coordinate, and the y-axis defines every vertical coordinate. You position text and shapes on a canvas by specifying their x and y-coordinates. Coordinate space units are measured in pixels (“picture elements”), which are the smallest units of resolution on a screen.
 Portability Tip 14.1
Different screens vary in resolution and thus in density of pixels so graphics may vary in appearance on different screens.

Fig. 14.1. canvas coordinate system. Units are measured in pixels.
14.3. Rectangles
Now we’re ready to create a canvas and start drawing. Figure 14.2 demonstrates how to draw a rectangle with a border on a canvas.
1 <!DOCTYPE html>
2
3 <!-- Fig. 14.2: drawrectangle.html -->
4 <!-- Drawing a rectangle on a canvas. -->
5 <html>
6 <head>
7 <meta charset = "utf-8">
8 <title>Drawing a Rectangle</title>
9 </head>
10 <body>
11 <canvas id = "drawRectangle" width = "300" height = "100"
12 style = "border: 1px solid black;">
13 Your browser does not support Canvas.
14 </canvas>
15 <script type>
16 var canvas = document.getElementById("drawRectangle");
17 var context = canvas.getContext("2d")
18 context.fillStyle = "yellow";
19 context.fillRect(5, 10, 200, 75);
20 context.strokeStyle = "royalblue";
21 context.lineWidth = 6;
22 context.strokeRect(4, 9, 201, 76);
23 </script>
24 </body>
25 </html>
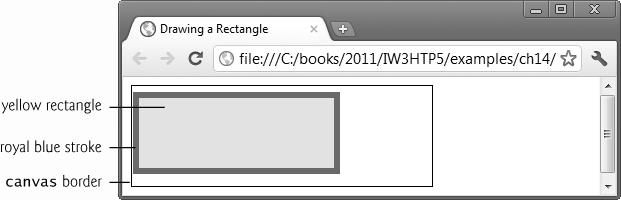
Fig. 14.2. Drawing a rectangle with a border on a canvas.
Creating a Canvas
The canvas element has two attributes—width and height. The default width is 300 and the default height 150. In lines 11–12, we create a canvas starting with a canvasID—in this case, "drawRectangle". Many people use "myCanvas" or something similar. Assigning a unique ID to a canvas allows you to access it like any other element, and to use more than one canvas on a page. Next, we specify the canvas’s width (300) and height (100), and a border of 1px solid black. You do not need to include a visible border. In line 13 we include the fallback text Your browser does not support canvas. This will appear if the user runs the application in a browser that does not support canvas. To save space, we have not included it in the subsequent examples.
Graphics Contexts and Graphics Objects
Now we’re ready to write our JavaScript (lines 15–23). First, we use the getElementById method to get the canvas element using the ID (line 16). Next we get the context object. A context represents a 2D rendering surface that provides methods for drawing on a canvas. The context contains attributes and methods for drawing, font manipulation, color manipulation and other graphics-related actions.
Drawing the Rectangle
To draw the rectangle, we specify its color by setting the fillStyle attribute to yellow (line 18). The fillRect method then draws the rectangle using the arguments x, y, width and height, where x and y are the coordinates for the top-left corner of the rectangle (line 19). In this example, we used the values 5, 10, 200 and 75, respectively.
Next, we add a border, or stroke, to the rectangle. The strokeStyle attribute (line 20) specifies the stroke color or style (in this case, royalblue). The lineWidth attribute specifies the stroke width in coordinate space units (line 21). Finally, the strokeRect method specifies the coordinates of the stroke using the arguments x, y, width and height. We used values that are one coordinate off in each direction from the outer edges of the rectangle—4, 9, 201 and 76. If the width and height are 0, no stroke will appear. If only one of the width or height values is 0, the result will be a line, not a rectangle.
14.4. Using Paths to Draw Lines
To draw lines and complex shapes in canvas, we use paths. A path can have zero or more subpaths, each having one or more points connected by lines or curves. If a subpath has fewer than two points, no path is drawn.
Figure 14.3 uses paths to draw lines on a canvas. The beginPath method starts the line’s path (line 19). The moveTo method sets the x- and y-coordinates of the path’s origin (line 20). From the point of origin, we use the lineTo method to specify the destinations for the path (lines 21–23). The lineWidth attribute is used to change the thickness of the line (line 24). The default lineWidth is 1 pixel. We then use the lineJoin attribute to specify the style of the corners where two lines meet—in this case, bevel (line 25). The lineJoin attribute has three possible values—bevel, round, and miter. The value bevel gives the path sloping corners. We’ll discuss the other two lineJoin values shortly.
1 <!DOCTYPE html>
2
3 <!-- Fig. 14.3: lines.html -->
4 <!-- Drawing lines on a canvas. -->
5 <html>
6 <head>
7 <meta charset = "utf-8">
8 <title>Drawing Lines</title>
9 </head>
10 <body>
11 <canvas id = "drawLines" width = "400" height = "200"
12 style = "border: 1px solid black;">
13 </canvas>
14 <script>
15 var canvas = document.getElementById("drawLines");
16 var context = canvas.getContext("2d")
17
18 // red lines without a closed path
19 context.beginPath(); // begin a new path
20 context.moveTo(10, 10); // path origin
21 context.lineTo(390, 10);
22 context.lineTo(390, 30);
23 context.lineTo(10, 30);
24 context.lineWidth = 10; // line width
25 context.lineJoin = "bevel" // line join style
26 context.lineCap = "butt"; // line cap style
27 context.strokeStyle = "red" // line color
28 context.stroke(); //draw path
29
30 // orange lines without a closed path
31 context.beginPath(); //begin a new path
32 context.moveTo(40, 75); // path origin
33 context.lineTo(40, 55);
34 context.lineTo(360, 55);
35 context.lineTo(360, 75);
36 context.lineWidth = 20; // line width
37 context.lineJoin = "round" // line join style
38 context.lineCap = "round"; // line cap style
39 context.strokeStyle = "orange" //line color
40 context.stroke(); // draw path
41
42 // green lines with a closed path
43 context.beginPath(); // begin a new path
44 context.moveTo(10, 100); // path origin
45 context.lineTo(390, 100);
46 context.lineTo(390, 130);
47 context.closePath() // close path
48 context.lineWidth = 10; // line width
49 context.lineJoin = "miter" // line join style
50 context.strokeStyle = "green" // line color
51 context.stroke(); // draw path
52
53 // blue lines without a closed path
54 context.beginPath(); // begin a new path
55 context.moveTo(40, 140); // path origin
56 context.lineTo(360, 190);
57 context.lineTo(360, 140);
58 context.lineTo(40, 190);
59 context.lineWidth = 5; // line width
60 context.lineCap = "butt"; // line cap style
61 context.strokeStyle = "blue" // line color
62 context.stroke(); // draw path
63 </script>
64 </body>
65 </html>
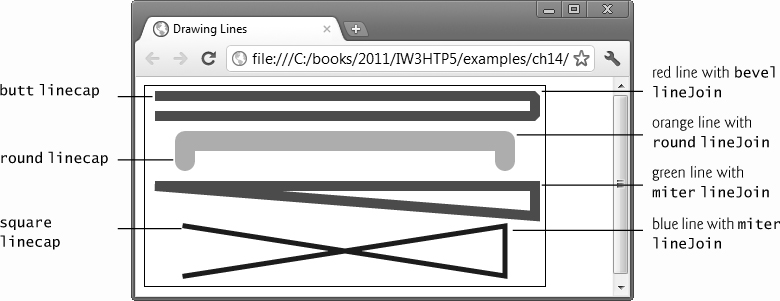
Fig. 14.3. Drawing lines on a canvas.
The lineCap attribute specifies the style of the end of the lines. There are three possible values—butt, round, and square. A butt lineCap (line 26) specifies that the line ends have edges perpendicular to the direction of the line and no additional cap. We’ll demonstrate the other lineCap styles shortly.
Next, the strokeStyle attribute specifies the line color—in this case, red (line 27). Finally, the stroke method draws the line on the canvas (line 28). The default stroke color is black.
To demonstrate the different lineJoin and lineCap styles, we draw additional lines. First we draw orange lines (lines 31–40) with a lineWidth of 20 (line 36). The round lineJoin creates rounded corners (line 37). Then, the round lineCap adds a semicircular cap to the ends of the path (line 38)—the cap’s diameter is equal to the width of the line.
Next, we draw green lines (lines 43–51) with a lineWidth of 10 (line 48). After we specify the destinations of the path, we use the closePath method (line 47) which closes the path by drawing a straight line from the last specified destination (line 46) back to the point of the path’s origin (line 44). The miter lineJoin (line 49) bevels the lines at an angle where they meet. For example, the lines that meet at a 90-degree angle have edges beveled at 45-degree angles where they meet. Since the path is closed, we do not specify a lineCap style for the green line. If we did not close the path (line 47), the previous lineCap style that we specified for the orange line above in line 36 would be applied to the green line. Such settings are said to be sticky—they continue to apply until they’re changed.
Finally, we draw blue lines (lines 54–62) with a lineWidth of 5. The butt lineCap adds a rectangular cap to the line ends (line 60). The length of the cap is equal to the line width, and the width of the cap is equal to half the line width. The edge of the square lineCap is perpendicular to the direction of the line.
14.5. Drawing Arcs and Circles
Arcs are portions of the circumference of a circle. To draw an arc, you specify the arc’s starting angle and ending angle measured in radians—the ratio of the arc’s length to its radius. The arc is said to sweep from its starting angle to its ending angle. Figure 14.4 depicts two arcs. The arc at the left of the figure sweeps counterclockwise from zero radians to π/2 radians, resulting in an arc that sweeps three quarters of the circumference a circle. The arc at the right of the figure sweeps clockwise from zero radians to π/2 radians.

Fig. 14.4. Positive and negative arc angles.
Figure 14.5 shows how to draw arcs and circles using the arc method. We start by drawing a filled mediumslateblue circle (lines 18–21). The beginPath method starts the path (line 18). Next, the arc method draws the circle using five arguments (line 20). The first two arguments represent the x- and y-coordinates of the center of the circle—in this case, 35, 50. The third argument is the radius of the circle. The fourth and fifth arguments are the arc’s starting and ending angles in radians. In this case, the ending angle is Math.PI*2. The constant Math.PI is the JavaScript representation of the mathematical constant π, the ratio of a circle’s circumference to its diameter. 2π radians represents a 360-degree arc, π radians is 180 degrees and π/2 radians is 90 degrees. There’s an optional sixth argument of the arc method which we’ll discuss shortly. To draw the circle to the canvas, we specify a fillStyle of mediumslateblue (line 20), then draw the circle using the fill method.
1 <!DOCTYPE html>
2
3 <!-- Fig. 14.5: drawingarcs.html -->
4 <!-- Drawing arcs and a circle on a canvas. -->
5 <html>
6 <head>
7 <meta charset = "utf-8">
8 <title>Arcs and Circles</title>
9 </head>
10 <body>
11 <canvas id = "drawArcs" width = "225" height = "100">
12 </canvas>
13 <script>
14 var canvas = document.getElementById("drawArcs");
15 var context = canvas.getContext("2d")
16
17 // draw a circle
18 context.beginPath();
19 context.arc(35, 50, 30, 0, Math.PI * 2);
20 context.fillStyle = "mediumslateblue";
21 context.fill();
22
23 // draw an arc counterclockwise
24 context.beginPath();
25 context.arc(110, 50, 30, 0, Math.PI, false);
26 context.stroke();
27
28 // draw a half-circle clockwise
29 context.beginPath();
30 context.arc(185, 50, 30, 0, Math.PI, true);
31 context.fillStyle = "red";
32 context.fill();
33
34 // draw an arc counterclockwise
35 context.beginPath();
36 context.arc(260, 50, 30, 0, 3 * Math.PI / 2);
37 context.strokeStyle = "darkorange";
38 context.stroke();
39 </script>
40 </body>
41 </html>

Fig. 14.5. Drawing arcs and circles on a canvas.
In lines 24–26 we draw a black arc that sweeps clockwise. Using the arc method, we draw an arc with a center at 110, 50, a radius of 30, a starting angle of 0 and an ending angle of Math.PI (180 degrees). The sixth argument is optional and specifies the direction in which the arc’s path is drawn. By default, the sixth argument is false, indicating that the arc is drawn clockwise. If the argument is true, the arc is drawn counterclockwise (or anticlockwise). We draw the arc using the stroke method (line 26).
Next, we draw a filled red semicircle counterclockwise so that it sweeps upward (lines 29–32). In this case, arguments of the arc method include a center of 185, 50, a radius of 30, a starting angle of 0 and an ending angle of Math.PI (180 degrees). To draw the arc counterclockwise, we use the sixth argument, true. We specify a fillStyle of red (line 31), then draw the semicircle using the fill method (line 32).
Finally, we draw a darkorange 270-degree clockwise arc (lines 35–38). Using the arc method (line 36), we draw an arc with a center at 260, 50, a radius of 30, a starting angle of 0 and an ending angle of 3*Math.PI/2 (270 degrees). Since we do not include the optional sixth argument, it defaults to false, drawing the arc clockwise. Then we specify a strokeStyle of darkorange (line 37) and draw the arc using the stroke method (line 38).
14.6. Shadows
In the next example, we add shadows to two filled rectangles (Fig. 14.6). We create a shadow that drops below and to the right of the first rectangle (lines 19–22). We start by specifying the shadowBlur attribute, setting its value to 10 (line 19). By default, the blur is 0 (no blur). The higher the value, the more blurred the edges of the shadow will appear. Next, we set the shadowOffsetX attribute to 15, which moves the shadow to the right of the rectangle (line 20). We then set the shadowOffsetY attribute to 15, which moves the shadow down from the rectangle (line 21). Finally, we specify the shadowColor attribute as blue (line 22).
1 <!DOCTYPE html>
2
3 <!-- Fig. 14.6: shadows.html -->
4 <!-- Creating shadows on a canvas. -->
5 <html>
6 <head>
7 <meta charset = "utf-8">
8 <title>Shadows</title>
9 </head>
10 <body>
11 <canvas id = "shadow" width = "525" height = "250"
12 style = "border: 1px solid black;">
13 </canvas>
14 <script>
15
16 // shadow effect with positive offsets
17 var canvas = document.getElementById("shadow");
18 var context = canvas.getContext("2d")
19 context.shadowBlur = 10;
20 context.shadowOffsetX = 15;
21 context.shadowOffsetY = 15;
22 context.shadowColor = "blue";
23 context.fillStyle = "cyan";
24 context.fillRect(25, 25, 200, 200);
25
26 // shadow effect with negative offsets
27 context.shadowBlur = 20;
28 context.shadowOffsetX = -20;
29 context.shadowOffsetY = -20;
30 context.shadowColor = "gray";
31 context.fillStyle = "magenta";
32 context.fillRect(300, 25, 200, 200);
33 </script>
34 </body>
35 </html>

Fig. 14.6. Creating shadows on a canvas.
For the second rectangle, we create a shadow that shifts above and to the left of the rectangle (lines 28–29). Notice that the shadowBlur is 20 (line 27). The effect is a shadow on which the edges appear more blurred than on the shadow of the first rectangle. Next, we specify the shadowOffsetX, setting its value to -20. Using a negative shadowOffsetX moves the shadow to the left of the rectangle (line 28). We then specify the shadowOffsetY attribute, setting its value to -20 (line 29). Using a negative shadowOffsetY moves the shadow up from the rectangle. Finally, we specify the shadowColor as gray (line 30). The default values for the shadowOffsetX and shadowOffsetY are 0 (no shadow).
14.7. Quadratic Curves
Figure 14.7 demonstrates how to draw a rounded rectangle using lines to draw the straight sides and quadratic curves to draw the rounded corners. Quadratic curves have a starting point, an ending point and a single point of inflection.
The quadraticCurveTo method uses four arguments. The first two, cpx and cpy, are the coordinates of the control point—the point of the curve’s inflection. The third and fourth arguments, x and y, are the coordinates of the ending point. The starting point is the last subpath destination, specified using the moveTo or lineTo methods. For example, if we write
context.moveTo(5, 100);
context.quadraticCurveTo(25, 5, 95, 50);
the curve starts at (5, 100), curves at (25, 5) and ends at (95, 50).
Unlike in CSS3, rounded rectangles are not built into canvas. To create a rounded rectangle, we use the lineTo method to draw the straight sides of the rectangle and the quadraticCurveTo to draw the rounded corners.
1 <!DOCTYPE html>
2
3 <!-- Fig. 14.7: roundedrectangle.html -->
4 <!-- Drawing a rounded rectangle on a canvas. -->
5 <html>
6 <head>
7 <meta charset = "utf-8">
8 <title>Quadratic Curves</title>
9 </head>
10 <body>
11 <canvas id = "drawRoundedRect" width = "130" height = "130"
12 style = "border: 1px solid black;">
13 </canvas>
14 <script>
15 var canvas = document.getElementById("drawRoundedRect");
16 var context = canvas.getContext("2d")
17 context.beginPath();
18 context.moveTo(15, 5);
19 context.lineTo(95, 5);
20 context.quadraticCurveTo(105, 5, 105, 15);
21 context.lineTo(105, 95);
22 context.quadraticCurveTo(105, 105, 95, 105);
23 context.lineTo(15, 105);
24 context.quadraticCurveTo(5, 105, 5, 95);
25 context.lineTo(5, 15);
26 context.quadraticCurveTo(5, 5, 15, 5);
27 context.closePath();
28 context.fillStyle = "yellow";
29 context.fill(); //fill with the fillStyle color
30 context.strokeStyle = "royalblue";
31 context.lineWidth = 6;
32 context.stroke(); //draw 6-pixel royalblue border
33 </script>
34 </body>
35 </html>
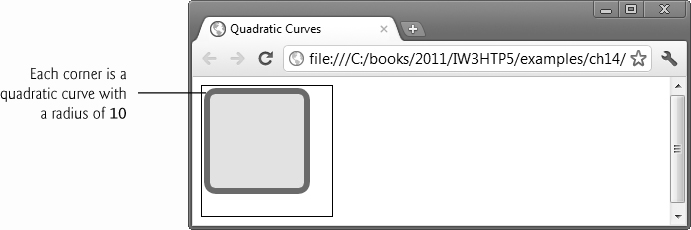
Fig. 14.7. Drawing a rounded rectangle on a canvas.
The rounded rectangle in this example has a width of 100, a height of 100 and a radius of 10 with which we calculate the points in the quadratic curves used to draw the rounded corners. The x- and y-coordinates for the rounded rectangle are both 5. We’ll use these values to calculate the coordinates for each of the points in the path of our drawing.
As in the previous example, we start the path with the beginPath method (line 17). We start the drawing in the top left, then move clockwise using the moveTo method (line 18). We use the formula x + radius to calculate the first argument (15) and use our original y-coordinate (5) as the second argument.
We then use the lineTo method to draw a line from the starting point to the top-right side of the drawing (line 19). For the first argument, we use the formula x + width – radius to calculate the x-coordinate (in this case, 95). The second argument is simply the original y-coordinate (5).
To draw the top-right rounded corner, we use the quadraticCurveTo method with the arguments cpx, cpy, x, y (line 20). We calculate the value of the first argument, cpx, using the formula x + width, which is 105. The second argument, cpy, is the same as our original y-coordinate (5). We calculate the value of the third argument using the formula x + width, which is 105. To calculate the value of the fourth argument, we use the formula y + radius, which is 15.
We use the lineTo method to draw the right side of the rounded rectangle (line 21). The first argument is equal to x + width, in this case, 105. To calculate the second argument, we use the formula y + height - radius, which is 95.
Next, we draw the bottom-right corner using the quadraticCurveTo method (line 22). We use the formula x + width to calculate the first argument (105), and the formula y + height to calculate the second argument (105). We use the formula x + width – radius to determine the third argument (95). Then we use the formula y + height to determine the fourth argument (105).
We then draw the bottom edge of the rectangle with the lineTo method (line 23). The formula x + radius is used to calculate the first argument (15) and the formula y + height to calculate the second argument (105).
Next, we draw the bottom-left corner using the quadraticCurveTo method (line 24). The first argument is simply our original x-coordinate (5). We use the formula y + height to calculate the second argument (105). The third argument is the same as our original x-coordinate (5). The formula y + height – radius is then used to calculate the fourth argument (95).
We draw the left side of the rounded rectangle using the lineTo method (line 25). Again, the first argument is the original x-coordinate (5). The formula y + radius is then used to calculate the second argument (15).
We draw the top-left corner of the rounded rectangle using the quadraticCurveTo method (line 26). The first and second arguments are the original x- and y-coordinates (both 5). To calculate the third argument (15), we use the formula x + radius. The fourth argument is simply the original y-coordinate (5). Finally, the closePath method closes the path for the rounded rectangle by drawing a line back to the path’s origin (line 27).
We specify a fillStyle of yellow, then use the fill method to draw the rounded rectangle to the canvas (lines 28–29). Finally, we place a border around the rounded rectangle by specifying a strokeStyle of royalblue (line 30) and a lineWidth of 6 (line 31), and then use the stroke method to draw the border (line 32).
14.8. Bezier Curves
Bezier curves have a starting point, an ending point and two control points through which the curve passes. These can be used to draw curves with one or two points of inflection, depending on the coordinates of the four points. For example, you might use a Bezier curve to draw complex shapes with s-shaped curves. The bezierCurveTo method uses six arguments. The first two arguments, cp1x and cp1y, are the coordinates of the first control point. The third and fourth arguments, cp2x and cp2y, are the coordinates for the second control point. Finally, the fifth and sixth arguments, x and y, are the coordinates of the ending point. The starting point is the last subpath destination, specified using either the moveTo or lineTo method. Figure 14.8 demonstrates how to draw an s-shaped Bezier curve using the bezierCurveTo method.
1 <!DOCTYPE html>
2
3 <!-- Fig. 14.8: beziercurves.html -->
4 <!-- Drawing a Bezier curve on a canvas. -->
5 <html>
6 <head>
7 <meta charset = "utf-8">
8 <title>Bezier Curves</title>
9 </head>
10 <body>
11 <canvas id = "drawBezier" width = "150" height = "150"
12 style = "border: 1px solid black;">
13 </canvas>
14 <script>
15 var canvas = document.getElementById("drawBezier");
16 var context = canvas.getContext("2d")
17 context.beginPath();
18 context.moveTo(115, 20);
19 context.bezierCurveTo(12, 37, 176, 77, 32, 133);
20 context.lineWidth = 10;
21 context.strokeStyle = "red";
22 context.stroke();
23 </script>
24 </body>
25 </html>
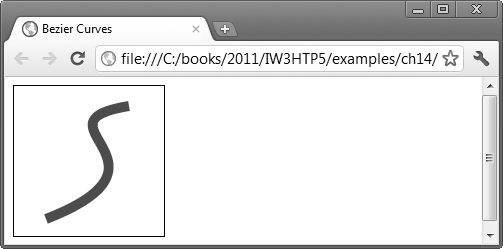
Fig. 14.8. Drawing a Bezier curve on a canvas.
The beginPath method starts the path of the Bezier curve (line 17), then the moveTo method specifies the path’s starting point (line 18). Next, the bezierCurveTo method specifies the three points in the Bezier curve (line 19). The first and second arguments (12 and 37) are the first control point. The third and fourth arguments (176 and 77) are the second control point. The fifth and sixth arguments (32 and 133) are the ending point.
The lineWidth attribute specifies the thickness of the line (line 20). The strokeStyle attribute specifies a stroke color of red. Finally, the stroke method draws the Bezier curve.
14.9. Linear Gradients
Figure 14.9 fills three separate canvases with linear gradients—vertical, horizontal and diagonal. On the first canvas (lines 13–25), we draw a vertical gradient. In line 19, we use the createLinearGradient method—the first two arguments are the x- and y-coordinates of the gradient’s start, and the last two are the x- and y-coordinates of the end. In this example, we use (0, 0) for the start of the gradient and (0, 200) for the end. The start and end have the same x-coordinates but different y-coordinates, so the start of the gradient is a point at the top of the canvas directly above the point at the end of the gradient at the bottom. This creates a vertical linear gradient that starts at the top and changes as the gradient moves to the bottom of the canvas. We’ll show how to create horizontal and diagonal gradients by altering these values.
1 <!DOCTYPE html>
2
3 <!-- Fig. 14.9: lineargradient.html -->
4 <!-- Drawing linear gradients on a canvas. -->
5 <html>
6 <head>
7 <meta charset = "utf-8">
8 <title>Linear Gradients</title>
9 </head>
10 <body>
11
12 <!-- vertical linear gradient -->
13 <canvas id = "linearGradient" width = "200" height = "200"
14 style = "border: 1px solid black;">
15 </canvas>
16 <script>
17 var canvas = document.getElementById("linearGradient");
18 var context = canvas.getContext("2d");
19 var gradient = context.createLinearGradient(0, 0, 0, 200);
20 gradient.addColorStop(0, "white");
21 gradient.addColorStop(0.5, "lightsteelblue");
22 gradient.addColorStop(1, "navy");
23 context.fillStyle = gradient;
24 context.fillRect(0, 0, 200, 200);
25 </script>
26
27 <!-- horizontal linear gradient -->
28 <canvas id = "linearGradient2" width = "200" height = "200"
29 style = "border: 2px solid orange;">
30 </canvas>
31 <script>
32 var canvas = document.getElementById("linearGradient2");
33 var context = canvas.getContext("2d");
34 var gradient = context.createLinearGradient(0, 0, 200, 0);
35 gradient.addColorStop(0, "white");
36 gradient.addColorStop(0.5, "yellow");
37 gradient.addColorStop(1, "orange");
38 context.fillStyle = gradient;
39 context.fillRect(0, 0, 200, 200);
40 </script>
41
42 <!-- diagonal linear gradient -->
43 <canvas id = "linearGradient3" width = "200" height = "200"
44 style = "border: 2px solid purple;">
45 </canvas>
46 <script>
47 var canvas = document.getElementById("linearGradient3");
48 var context = canvas.getContext("2d");
49 var gradient = context.createLinearGradient(0, 0, 45, 200);
50 gradient.addColorStop(0, "white");
51 gradient.addColorStop(0.5, "plum");
52 gradient.addColorStop(1, "purple");
53 context.fillStyle = gradient;
54 context.fillRect(0, 0, 200, 200);
55 </script>
56 </body>
57 </html>
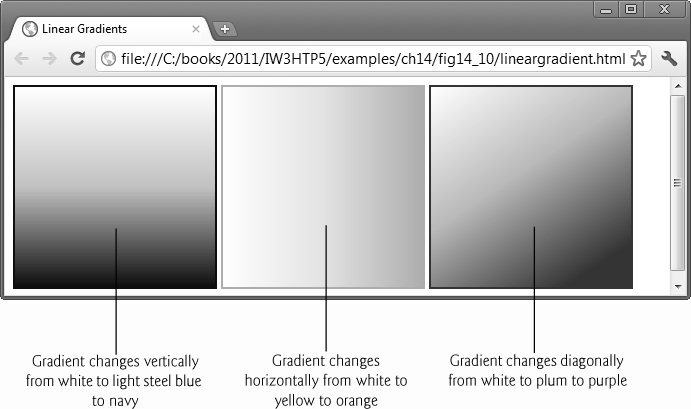
Fig. 14.9. Drawing linear gradients on a canvas.
Next, we use the addColorStop method to add three color stops (lines 20–22). (For a definition of color stops, see Section 5.6.) Each color stop has a positive value between 0 (the start of the gradient) and 1 (the end of the gradient). For each color stop, we specify a color (white, lightsteelblue and navy). The fillStyle method specifies a gradient (line 23) and then the fillRect method draws the gradient on the canvas (line 24).
On the second canvas (lines 28–40), we draw a horizontal gradient. In line 34, we use the createLinearGradient method where the first two arguments are (0, 0) for the start of the gradient and (200, 0) for the end. Note that in this case, the start and end have different x-coordinates but the same y-coordinates, horizontally aligning the start and end. This creates a horizontal linear gradient that starts at the left and changes as the gradient moves to the right edge of the canvas.
On the third canvas (lines 43–55), we draw a diagonal gradient. In line 49, we use the createLinearGradient method again. The first two arguments are (0, 0)—the coordinates of the starting position of the gradient in the top left of the canvas. The last two arguments are (135, 200)—the ending position of the gradient. This creates a diagonal linear gradient that starts at the top left and changes at an angle as the gradient moves to the right edge of the canvas.
14.10. Radial Gradients
Next, we show how to create two different radial gradients on a canvas (Fig. 14.10). A radial gradient is comprised of two circles—an inner circle where the gradient starts and an outer circle where it ends. In lines 18–19, we use the createRadialGradient method whose first three arguments are the x- and y-coordinates and the radius of the gradient’s start circle, respectively, and whose last three arguments are the x- and y-coordinates and the radius of the end circle. In this example, we use (100, 100, 10) for the start circle and (100, 100, 125) for the end circle. Note that these are concentric circles—they have the same x- and y-coordinates but each has a different radius. This creates a radial gradient that starts in a common center and changes as it moves outward to the end circle.
Next, the gradient.addColorStop method is used to add four color stops (lines 20–23). Each color stop has a positive value between 0 (the start circle of the gradient) and 1 (the end circle of the gradient). For each color stop, we specify a color (in this case, white, yellow, orange and red). Then, the fillStyle attribute is used to specify a gradient (line 24). The fillRect method draws the gradient on the canvas (line 25).
On the second canvas (lines 29–43), the start and end circles have different x- and y-coordinates, altering the effect. In lines 35–36, the createRadialGradient method uses the arguments (20, 150, 10) for the start circle and (100, 100, 125) for the end circle. These are not concentric circles. The start circle of the gradient is near the bottom left of the canvas and the end circle is centered on the canvas. This creates a radial gradient that starts near the bottom left of the canvas and changes as it moves to the right.
1 <!DOCTYPE html>
2
3 <!-- Fig. 14.10: radialgradient.html -->
4 <!-- Drawing radial gradients on a canvas. -->
5 <html>
6 <head>
7 <meta charset = "utf-8">
8 <title>Radial Gradients</title>
9 </head>
10 <body>
11 <!-- radial gradient with concentric circles -->
12 <canvas id = "radialGradient" width = "200" height = "200"
13 style = "border: 1px solid black;">
14 </canvas>
15 <script>
16 var canvas = document.getElementById("radialGradient");
17 var context = canvas.getContext("2d")
18 var gradient = context.createRadialGradient(
19 100, 100, 10, 100, 100, 125);
20 gradient.addColorStop(0, "white");
21 gradient.addColorStop(0.5, "yellow");
22 gradient.addColorStop(0.75, "orange");
23 gradient.addColorStop(1, "red");
24 context.fillStyle = gradient;
25 context.fillRect(0, 0, 200, 200);
26 </script>
27
28 <!-- radial gradient with nonconcentric circles -->
29 <canvas id = "radialGradient2" width = "200" height = "200"
30 style = "border: 1px solid black;">
31 </canvas>
32 <script>
33 var canvas = document.getElementById("radialGradient2");
34 var context = canvas.getContext("2d")
35 var gradient = context.createRadialGradient(
36 20, 150, 10, 100, 100, 125);
37 gradient.addColorStop(0, "red");
38 gradient.addColorStop(0.5, "orange");
39 gradient.addColorStop(0.75, "yellow");
40 gradient.addColorStop(1, "white");
41 context.fillStyle = gradient;
42 context.fillRect(0, 0, 200, 200);
43 </script>
44 </body>
45 </html>

Fig. 14.10. Drawing radial gradients on a canvas.
14.11. Images
Figure 14.11 uses the drawImage method to draw an image to a canvas. In line 10, we create a new Image object and store it in the variable image. Line 11 locates the image source, "yellowflowers.png". Our function draw (lines 13–18) is called to draw the image after the document and all of its resources load. The drawImage method (line 17) draws the image to the canvas using five arguments. The first argument can be an image, canvas or video element. The second and third arguments are the destination x- and destination y-coordinates—these indicate the position of the top-left corner of the image on the canvas. The fourth and fifth arguments are the destination width and destination height. If the values do not match the size of the image, it will be stretched to fit.
1 <!DOCTYPE html>
2
3 <!-- Fig. 14.11: image.html -->
4 <!-- Drawing an image to a canvas. -->
5 <html>
6 <head>
7 <meta charset = "utf-8">
8 <title>Images</title>
9 <script>
10 var image = new Image();
11 image.src = "yellowflowers.png";
12
13 function draw()
14 {
15 var canvas = document.getElementById("myimage");
16 var context = canvas.getContext("2d")
17 context.drawImage(image, 0, 0, 175, 175);
18 } // end function draw
19
20 window.addEventListener( "load", draw, false );
21 </script>
22 </head>
23 <body>
24 <canvas id = "myimage" width = "200" height = "200"
25 style = "border: 1px solid Black;">
26 </canvas>
27 </body>
28 </html>
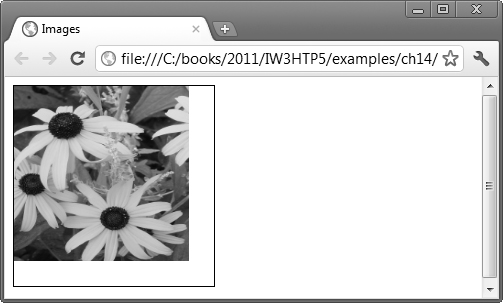
Fig. 14.11. Drawing an image to a canvas.
Note that you can call drawImage in three ways. In its simplest form, you can use
context.drawImage(image, dx, dy)
where dx and dy represent the position of the top-left corner of the image on the destination canvas. The default width and height are the source image’s width and height. Or, as we did in this example, you can use
context.drawImage(image, dx, dy, dw, dh)
where dw is the specified width of the image on the destination canvas and dh is the specified height of the image on the destination canvas. Finally, you can use
context.drawImage(image, sx, sy, sw, sh, dx, dy, dw, dh)
where sx and sy are the coordinates of the top-left corner of the source image, sw is the source image’s width and sh its height.
14.12. Image Manipulation: Processing the Individual Pixels of a canvas
Figure 14.12 shows how to obtain a canvas’s pixels and manipulate their red, green, blue and alpha (RGBA) values. For security reasons, some browsers allow a script to get an image’s pixels only if the document is requested from a web server, not if the file is loaded from the local computer’s file system. For this reason, you can test this example at
http://test.deitel.com/iw3htp5/ch14/fig14_12/imagemanipulation.html
The HTML5 document’s body (lines 123–135) defines a 750-by-250 pixel canvas element on which we’ll draw an original image, a version of the image showing any changes you make to the RGBA values, and a version of the image converted to grayscale. You can change the RGBA values with the input elements of type range defined in the body. You can adjust the amount of red, green or blue from 0 to 500% of its original value—on a pixel-by-pixel basis, we calculate the new amount of red, green or blue accordingly. For the alpha, you can adjust the value from 0 (completely transparent) to 255 (completely opaque). The script begins when the window’s load event (registered in line 120) calls function start.
1 <!DOCTYPE html>
2
3 <!-- Fig. 14.12: imagemanipulation.html -->
4 <!-- Manipulating an image's pixels to change colors and transparency. -->
5 <html>
6 <head>
7 <meta charset = "utf-8">
8 <title>Manipulating an Image</title>
9 <style>
10 label { display: inline-block; width: 3em; }
11 canvas { border: 1px solid black; }
12 input[type="range"] { width: 600px; }
13 </style>
14 <script>
15 var context; // context for drawing on canvas
16 var redRange; // % of original red pixel value
17 var greenRange; // % of original green pixel value
18 var blueRange; // % of original blue pixel value
19 var alphaRange; // alpha amount value
20
21 var image = new Image(); // image object to store loaded image
22 image.src = "redflowers.png"; // set the image source
23
24 function start()
25 {
26 var canvas = document.getElementById( "thecanvas" );
27 context = canvas.getContext("2d")
28 context.drawImage(image, 0, 0); // original image
29 context.drawImage(image, 250, 0); // image for user change
30 processGrayscale(); // display grayscale of original image
31
32 // configure GUI events
33 redRange = document.getElementById( "redRange" );
34 redRange.addEventListener( "change",
35 function() { processImage( this.value, greenRange.value,
36 blueRange.value ); }, false );
37 greenRange = document.getElementById( "greenRange" );
38 greenRange.addEventListener( "change",
39 function() { processImage( redRange.value, this.value,
40 blueRange.value ); }, false )
41 blueRange = document.getElementById( "blueRange" );
42 blueRange.addEventListener( "change",
43 function() { processImage( redRange.value,
44 greenRange.value, this.value ); }, false )
45 alphaRange = document.getElementById( "alphaRange" );
46 alphaRange.addEventListener( "change",
47 function() { processAlpha( this.value ); }, false )
48 document.getElementById( "resetButton" ).addEventListener(
49 "click", resetImage, false );
50 } // end function start
51
52 // sets the alpha value for every pixel
53 function processAlpha( newValue )
54 {
55 // get the ImageData object representing canvas's content
56 var imageData = context.getImageData(0, 0, 250, 250);
57 var pixels = imageData.data; // pixel info from ImageData
58
59 // convert every pixel to grayscale
60 for ( var i = 3; i < pixels.length; i += 4 )
61 {
62 pixels[ i ] = newValue;
63 } // end for
64
65 context.putImageData( imageData, 250, 0 ); // show grayscale
66 } // end function processImage
67
68 // sets the RGB values for every pixel
69 function processImage( redPercent, greenPercent, bluePercent )
70 {
71 // get the ImageData object representing canvas's content
72 context.drawImage(image, 250, 0);
73 var imageData = context.getImageData(0, 0, 250, 250);
74 var pixels = imageData.data; // pixel info from ImageData
75
76 //set percentages of red, green and blue in each pixel
77 for ( var i = 0; i < pixels.length; i += 4 )
78 {
79 pixels[ i ] *= redPercent / 100;
80 pixels[ i + 1 ] *= greenPercent / 100;
81 pixels[ i + 2 ] *= bluePercent / 100;
82 } // end for
83
84 context.putImageData( imageData, 250, 0 ); // show grayscale
85 } // end function processImage
86
87 // creates grayscale version of original image
88 function processGrayscale()
89 {
90 // get the ImageData object representing canvas's content
91 context.drawImage(image, 500, 0);
92 var imageData = context.getImageData(0, 0, 250, 250);
93 var pixels = imageData.data; // pixel info from ImageData
94
95 // convert every pixel to grayscale
96 for ( var i = 0; i < pixels.length; i += 4 )
97 {
98 var average =
99 (pixels[ i ] * 0.30 + pixels[ i + 1 ] * 0.59 +
100 pixels[ i + 2 ] * 0.11).toFixed(0);
101
102 pixels[ i ] = average;
103 pixels[ i + 1 ] = average;
104 pixels[ i + 2 ] = average;
105 } // end for
106
107 context.putImageData( imageData, 500, 0 ); // show grayscale
108 } // end function processGrayscale
109
110 // resets the user manipulated image and the sliders
111 function resetImage()
112 {
113 context.drawImage(image, 250, 0);
114 redRange.value = 100;
115 greenRange.value = 100;
116 blueRange.value = 100;
117 alphaRange.value = 255;
118 } // end function resetImage
119
120 window.addEventListener( "load", start, false );
121 </script>
122 </head>
123 <body>
124 <canvas id = "thecanvas" width = "750" height = "250" ></canvas>
125 <p><label>Red:</label> 0 <input id = "redRange"
126 type = "range" max = "500" value = "100"> 500%</p>
127 <p><label>Green:</label> 0 <input id = "greenRange"
128 type = "range" max = "500" value = "100"> 500%</p>
129 <p><label>Blue:</label> 0 <input id = "blueRange"
130 type = "range" max = "500" value = "100"> 500%</p>
131 <p><label>Alpha:</label> 0 <input id = "alphaRange"
132 type = "range" max = "255" value = "255"> 255</p>
133 <p><input id = "resetButton" type = "button"
134 value = "Reset Image">
135 </body>
136 </html>

Fig. 14.12. Manipulating an image’s pixels to change colors and transparency.
Script-Level Variables and Loading the Original Image
Lines 15–21 declare the script-level variables. Variables redRange, greenRange, blueRange and alphaRange will refer to the four range inputs so that we can easily access their values in the script’s other functions. Variable image represents the original image to draw. Line 21 creates an Image object and line 22 uses it to load the image redflower.png, which is provided with the example.
Function start
Lines 28–29 draw the original image twice—once in the upper-left corner of the canvas and once 250 pixels to the right. Line 30 calls function processGrayscale to create the grayscale version of the image which will appear at x-coordinate 500. Lines 33–49 get the range input elements and register their event handlers. For the redRange, greenRange and blueRange elements, we register for the change event and call processImage with the values of these three range inputs. For the alphRange elements we register for the change event and call processAlpha with the value of that range input.
Function processAlpha
Function processAlpha (lines 53–66) applies the new alpha value to every pixel in the image. Line 56 calls canvas method getImageData to obtain an object that contains the pixels we wish to manipulate. The method receives a bounding rectangle representing the portion of the canvas to get—in this case, a 250-pixel square from the upper-left corner. The returned object contains an array named data (line 57) which stores every pixel in the selected rectangular area as four elements in the array. Each pixel’s data is stored in the order red value, green value, blue value, alpha value. So, the first four elements in the array represent the RGBA values of the pixel in row 0 and column 0, the next four elements represent the pixel in row 0 and column 1, etc.
Lines 60–63 iterate through the array processing every fourth element, which represents the alpha value in each pixel, and assigning it the new alpha value. Line 65 uses canvas method putImageData to place the updated pixels on the canvas with the upper-left corner of the processed image at location 250, 0.
Function processImage
Function processImage (lines 69–85) is similar to function processAlpha except that its loop (lines 77–82) processes the first three of every four elements—that is, the ones that represent a pixel’s RGB values.
Function processGrayscale
Function processGrayscale (lines 88–108) is similar to function processImage except that its loop (lines 96–105) performs a weighted-average calculation to determine the new value assigned to the red, green and blue components of a given pixel. We used the formula for converting from RGB to grayscale provided at http://en.wikipedia.org/wiki/Grayscale.
Function resetImage
Function resetImage (lines 111–118) resets the on-screen images and the range input elements to their original values.
14.13. Patterns
Figure 14.13 demonstrates how to draw a pattern on a canvas. Lines 10–11 create and load the image we’ll use for our pattern. Function start (lines 13–21) is called in response to the window’s load event. Line 17 uses the createPattern method to create the pattern. This method takes two arguments. The first is the image we’re using for the pattern, which can be an image element, a canvas element or a video element. The second specifies how the image will repeat to create the pattern and can be one of four values—repeat (repeats horizontally and vertically), repeat-x (repeats horizontally), repeat-y (repeats vertically) or no-repeat. In line 18, we specify the coordinates for the pattern on the canvas. The first image in the pattern is drawn so that its top left is at the origin of the coordinate space. We then specify the fillStyle attribute (pattern) and use the fill method to draw the pattern to the canvas.
1 <!DOCTYPE html>
2
3 <!-- Fig. 14.13: pattern.html -->
4 <!-- Creating a pattern using an image on a canvas. -->
5 <html>
6 <head>
7 <meta charset = "utf-8">
8 <title>Patterns</title>
9 <script>
10 var image = new Image();
11 image.src = "yellowflowers.png";
12
13 function start()
14 {
15 var canvas = document.getElementById("pattern");
16 var context = canvas.getContext("2d");
17 var pattern = context.createPattern(image, "repeat");
18 context.rect(5, 5, 385, 200);
19 context.fillStyle = pattern;
20 context.fill();
21 } // end function start
22
23 window.addEventListener( "load", start, false );
24 </script>
25 </head>
26 <body>
27 <canvas id = "pattern" width = "400" height = "200"
28 style = "border: 1px solid black;">
29 </canvas>
30 </body>
31 </html>

Fig. 14.13. Creating a pattern using an image on a canvas.
14.14. Transformations
The next several examples show you how to use canvas transformation methods including translate, scale, rotate and transform.
14.14.1. scale and translate Methods: Drawing Ellipses
Figure 14.14 demonstrates how to draw ellipses. In line 18, we change the transformation matrix (the coordinates) on the canvas using the translate method so that the center of the canvas becomes the origin (0, 0). To do this, we use half the canvas width as the x-coordinate and half the canvas height as the y-coordinate (line 18). This will enable us to center the ellipse on the canvas. We then use the scale method to stretch a circle to create an ellipse (line 19). The x value represents the horizontal scale factor; the y value represents the vertical scale factor—in this case, our scale factor indicates that the ratio of the width to the height is 1:3, which will create a tall, thin ellipse. Next, we draw the circle that we want to stretch using the beginPath method to start the path, then the arc method to draw the circle (lines 20–21). Notice that the x- and y-coordinates for the center of the circle are (0, 0), which is now the center of the canvas (not the top-left corner). We then specify a fillStyle of orange (line 22) and draw the ellipse to the canvas using the fill method (line 23).
Next, we create a horizontal purple ellipse on a separate canvas (lines 26–39). We use a scale of 3, 2 (line 34), indicating that the ratio of the width to the height is 3:2. This results in an ellipse that is shorter and wider.
1 <!DOCTYPE html>
2
3 <!-- Fig. 14.14: ellipse.html -->
4 <!-- Drawing an ellipse on a canvas. -->
5 <html>
6 <head>
7 <meta charset = "utf-8">
8 <title>Ellipse</title>
9 </head>
10 <body>
11 <!-- vertical ellipse -->
12 <canvas id = "drawEllipse" width = "200" height = "200"
13 style = "border: 1px solid black;">
14 </canvas>
15 <script>
16 var canvas = document.getElementById("drawEllipse");
17 var context = canvas.getContext("2d")
18 context.translate(canvas.width / 2, canvas.height / 2);
19 context.scale(1, 3);
20 context.beginPath();
21 context.arc(0, 0, 30, 0, 2 * Math.PI, true);
22 context.fillStyle = "orange";
23 context.fill();
24 </script>
25
26 <!-- horizontal ellipse -->
27 <canvas id = "drawEllipse2" width = "200" height = "200"
28 style = "border: 1px solid black;">
29 </canvas>
30 <script>
31 var canvas = document.getElementById("drawEllipse2");
32 var context = canvas.getContext("2d")
33 context.translate(canvas.width / 2, canvas.height / 2);
34 context.scale(3, 2);
35 context.beginPath();
36 context.arc(0, 0, 30, 0, 2 * Math.PI, true);
37 context.fillStyle = "indigo";
38 context.fill();
39 </script>
40 </body>
41 </html>
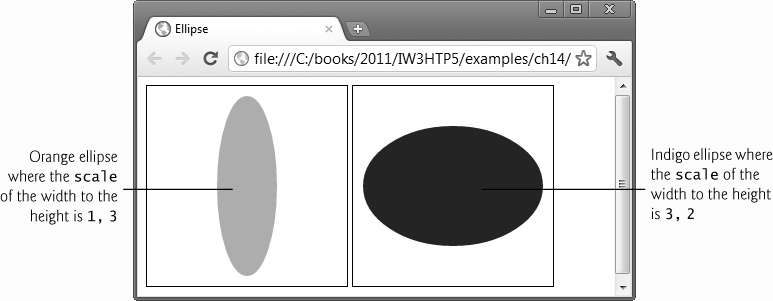
Fig. 14.14. Drawing an ellipse on a canvas.
14.14.2. rotate Method: Creating an Animation
Figure 14.15 uses the rotate method to create an animation of a rotating rectangle on a canvas. First, we create the JavaScript function startRotating (lines 18–22). Just as we did in the previous example, we change the transformation matrix on the canvas using the translate method, making the center of the canvas the origin with the x, y values (0, 0) (line 20). This allows us to rotate the rectangle (which is centered on the canvas) around its center.
1 <!DOCTYPE html>
2
3 <!-- Fig. 14.15: rotate.html -->
4 <!-- Using the rotate method to rotate a rectangle on a canvas. -->
5 <html>
6 <head>
7 <meta charset = "utf-8">
8 <title>Rotate</title>
9 </head>
10 <body>
11 <canvas id = "rotateRectangle" width = "200" height = "200"
12 style = "border: 1px solid black;">
13 </canvas>
14 <script>
15 var canvas = document.getElementById("rotateRectangle");
16 var context = canvas.getContext("2d")
17
18 function startRotating()
19 {
20 context.translate(canvas.width / 2, canvas.height / 2);
21 setInterval(rotate, 10);
22 }
23
24 function rotate()
25 {
26 context.clearRect(-100, -100, 200, 200);
27 context.rotate(Math.PI / 360);
28 context.fillStyle = "lime";
29 context.fillRect(-50, -50, 100, 100);
30 }
31
32 window.addEventListener( "load", startRotating, false );
33 </script>
34 </body>
35 </html>

Fig. 14.15. Using the rotate method to rotate a rectangle on a canvas.
In line 21, we use the setInterval method of the window object. The first argument is the name of the function to call (rotate) and the second is the number of milliseconds between calls.
Next, we create the JavaScript function rotate (lines 24–30). We use the clearRect method to clear the rectangle’s pixels from the canvas, converting them back to transparent as the rectangle rotates (line 26). This method takes four arguments—x, y, width and height. Since the center of the canvas has the x- and y-coordinates (0, 0), the top-left corner of the canvas is now (-100, -100). The width and height of the canvas remain the same (200, 200). If you were to remove the clearRect method, the pixels would remain on the canvas, and after one full rotation of the rectangle, you would see a circle.
Next, the rotate method takes one argument—the angle of the clockwise rotation, expressed in radians (line 27). We then specify the rectangle’s fillStyle (lime) and draw the rectangle using the fillRect method. Notice that its x- and y-coordinates are the translated coordinates, (-50, -50) (line 29).
14.14.3. transform Method: Drawing Skewed Rectangles
The transform method allows you to skew, scale, rotate and translate elements without using the separate transformation methods discussed earlier in this section. The transform method takes six arguments in the format ( a, b, c, d, e, f ). The first argument, a, is the x-scale—the factor by which to scale the element horizontally. For example, a value of 2 would double the element’s width. The second argument, b, is the y-skew. The third argument, c, is the x-skew. The greater the value of the x- and y-skew, the more the element will be skewed horizontally and vertically, respectively. The fourth argument, d, is the y-scale—the factor by which to scale the element vertically. The fifth argument, e, is the x-translation and the sixth argument, f, is the y-translation. The default x- and y-scale values are 1. The default values of the x- and y-skew and the x- and y-translation are 0, meaning there is no skew or translation.
Figure 14.16 uses the transform method to skew, scale and translate two rectangles. On the first canvas (lines 12–32), we declare the variable rectangleWidth and assign it the value 120, and declare the variable rectangleHeight and assign it the value 60 (lines 18–19).
1 <!DOCTYPE html>
2
3 <!-- Fig. 14.16: skew.html -->
4 <!-- Using the translate and transform methods to skew rectangles. -->
5 <html>
6 <head>
7 <meta charset = "utf-8">
8 <title>Skew</title>
9 </head>
10 <body>
11 <!-- skew left -->
12 <canvas id = "transform" width = "320" height = "150"
13 style = "border: 1px solid Black;">
14 </canvas>
15 <script>
16 var canvas = document.getElementById("transform");
17 var context = canvas.getContext("2d");
18 var rectangleWidth = 120;
19 var rectangleHeight = 60;
20 var scaleX = 2;
21 var skewY = 0;
22 var skewX = 1;
23 var scaleY = 1;
24 var translationX = -10;
25 var translationY = 30;
26 context.translate(canvas.width / 2, canvas.height / 2);
27 context.transform(scaleX, skewY, skewX, scaleY,
28 translationX, translationY);
29 context.fillStyle = "red";
30 context.fillRect(-rectangleWidth / 2, -rectangleHeight / 2,
31 rectangleWidth, rectangleHeight);
32 </script>
33
34 <!-- skew right -->
35 <canvas id = "transform2" width = "220" height = "150"
36 style = "border: 1px solid Black;">
37 <script>
38 var canvas = document.getElementById("transform2");
39 var context = canvas.getContext("2d");
40 var rectangleWidth = 120;
41 var rectangleHeight = 60;
42 var scaleX = 1;
43 var skewY = 0;
44 var skewX = -1.5;
45 var scaleY = 2;
46 var translationX = 0;
47 var translationY = 0;
48 context.translate(canvas.width / 2, canvas.height / 2);
49 context.transform(scaleX, skewY, skewX, scaleY,
50 translationX, translationY);
51 context.fillStyle = "blue";
52 context.fillRect(-rectangleWidth / 2, -rectangleHeight / 2,
53 rectangleWidth, rectangleHeight);
54 </script>
55 </body>
56 </html>

Fig. 14.16. Using the translate and transform methods to skew rectangles.
In lines 20–25, we declare variables for each of the arguments that will be used in the transform method and assign each a value. scaleX is assigned the value 2 to double the width of the rectangle. skewY is assigned the value 0 (the default value) so there’s no vertical skew. skewX is assigned the value 1 to skew the rectangle horizontally to the left. Increasing this value would increase the angle of the skew. scaleY is assigned the value 1 (the default value) so the rectangle is not scaled vertically (line 20). translationX is assigned the value -10 to shift the position of the rectangle left of the point of origin. Finally, translationY is assigned the value 30 to shift the rectangle down from the point of origin.
In line 26, the translate method centers the point of origin (0, 0) on the canvas. Next, the transform method scales and skews the rectangle horizontally, then shifts its center left and down from the point of origin.
In lines 35–54 we create a second canvas to demonstrate how different values can be used to transform a rectangle. In this case, the value of scaleX is 1 (the default), so there is no horizontal scale. The value of skewY is 0. In line 44, skewX is assigned -1.5. The negative value causes the rectangle to skew right. Next, the variable scaleY is assigned 2 to double the height of the rectangle. Finally, the variables translationX and translationY are each assigned 0 (the default) so that the rectangle remains centered on the canvas’s point of origin.
14.15. Text
Figure 14.17 shows you how to draw text on a canvas. We draw two lines of text. For the first line, we color the text using a fillStyle of red (line 19). We use the font attribute to specify the style, size and font of the text—in this case, italic 24px serif (line 20).
1 <!DOCTYPE html>
2
3 <!-- Fig. 14.17: text.html -->
4 <!-- Drawing text on a canvas. -->
5 <html>
6 <head>
7 <meta charset = "utf-8">
8 <title>Text</title>
9 </head>
10 <body>
11 <canvas id = "text" width = "230" height = "100"
12 style = "border: 1px solid black;">
13 </canvas>
14 <script>
15 var canvas = document.getElementById("text");
16 var context = canvas.getContext("2d")
17
18 // draw the first line of text
19 context.fillStyle = "red";
20 context.font = "italic 24px serif";
21 context.textBaseline = "top";
22 context.fillText ("HTML5 Canvas", 0, 0);
23
24 // draw the second line of text
25 context.font = "bold 30px sans-serif";
26 context.textAlign = "center";
27 context.lineWidth = 2;
28 context.strokeStyle = "navy";
29 context.strokeText("HTML5 Canvas", 115, 50);
30 </script>
31 </body>
32 </html>
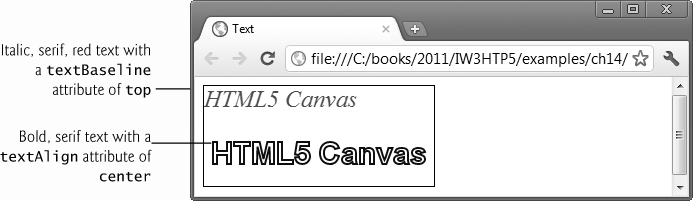
Fig. 14.17. Drawing text on a canvas.
Next, we use textBaseline attribute to specify the alignment points of the text (line 21). There are six different textBaseline attribute values (Fig. 14.18). To see how each value aligns the font, see the graphic in the HTML5 canvas specification at
http://www.whatwg.org/specs/web-apps/current-work/multipage/the-canvas-element.html#text-0

Fig. 14.18. textBaseline values.
Now we use the fillText method to draw the text to the canvas (line 22). This method takes three arguments. The first is the text being drawn to the canvas. The second and third arguments are the x- and y-coordinates. You may include the optional fourth argument, maxWidth, to limit the width of the text.
Lines 25–29 draw the second line of text to the canvas. In this case, the font attribute specifies a bold, 30px, sans-serif font (line 25). We center the text on the canvas using the textAlign attribute which specifies the horizontal alignment of the text relative to the x-coordinate of the text (line 26). Figure 14.19 describes the five textAlign attribute values.

Fig. 14.19. textAlign attribute values.
We use the lineWidth attribute to specify the thickness of the stroke used to draw the text—in this case, 2 (line 27). Next, we specify the strokeStyle to specify the color of the text (line 28). Finally, we use strokeText to specify the text being drawn to the canvas and its x- and y-coordinates (line 29). By using strokeText instead of fillText, we draw outlined text instead of filled text. Keep in mind that once text is on a canvas it’s just bits—it can no longer be manipulated as text.
14.16. Resizing the canvas to Fill the Browser Window
Figure 14.20 demonstrates how to dynamically resize a canvas to fill the window. To do this, we draw a yellow rectangle so you can see how it fills the canvas.
1 <!DOCTYPE html>
2
3 <!-- Fig. 14.20: fillingwindow.html -->
4 <!-- Resizing a canvas to fill the window. -->
5 <html>
6 <head>
7 <meta charset = "utf-8">
8 <title>Filling the Window</title>
9 <style type = "text/css">
10 canvas { position: absolute; left: 0px; top: 0px;
11 width: 100%; height: 100%; }
12 </style>
13 </head>
14 <body>
15 <canvas id = "resize"></canvas>
16 <script>
17 function draw()
18 {
19 var canvas = document.getElementById( "resize" );
20 var context = canvas.getContext( "2d" );
21 context.fillStyle = "yellow";
22 context.fillRect(
23 0, 0, context.canvas.width, context.canvas.height );
24 } // end function draw
25
26 window.addEventListener( "load", draw, false );
27 </script>
28 </body>
29 </html>
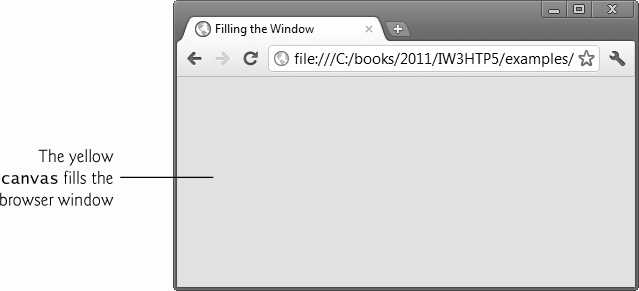
Fig. 14.20. Dynamically resizing a canvas to fill the window.
First we use a CSS style sheet to set the position of the canvas to absolute and set both its width and height to 100%, rather than using fixed coordinates (lines 10–11). This places the canvas at the top left of the screen and allows the canvas width and height to be resized to 100% of those of the window. Do not include a border on the canvas.
We use JavaScript function draw to draw the canvas when the application is rendered (lines 17 and 26). Line 21 specifies the color of the rectangle by setting the fillStyle to yellow. We use fillRect to draw the color to the canvas. Recall that in previous examples, the four coordinates we used for method fillRect were x, y, x1, y1, where x1 and y1 represent the coordinates of the bottom-right corner of the rectangle. In this example, the x- and y-coordinates are (0, 0)—the top left of the canvas The the x1 value is context.canvas.width and the y1 value is context.value.height, so no matter the size of the window, the x1 value will always be the width of the canvas and the y1 value will always be the height of the canvas.
14.17. Alpha Transparency
In Figure 14.21, we use the globalAlpha attribute to demonstrate three different alpha transparencies. To do this, we create three canvases, each with a fully opaque rectangle and an overlapping circle and varying transparencies. The globalAlpha value can be any number between 0 (fully transparent) and 1 (the default value, which is fully opaque).
On the first canvas we specify a globalAlpha attribute value of 0.9 to create a circle that’s mostly opaque (line 23). On the second canvas we specify a globalAlpha attribute value of 0.5 to create a circle that’s semitransparent (line 41). Notice in the output that in the area where the circle overlaps the rectangle, the rectangle is visible. On the third canvas we specify a globalAlpha attribute value of 0.15 to create a circle that’s almost entirely transparent (line 59). In the area where the circle overlaps the rectangle, the rectangle is even more visible.
1 <!DOCTYPE html>
2
3 <!-- Fig. 14.21: alpha.html -->
4 <!-- Using the globalAlpha attribute on a canvas. -->
5 <html>
6 <head>
7 <meta charset = "utf-8">
8 <title>Alpha Transparency</title>
9 </head>
10 <body>
11
12 <!-- 0.75 alpha value -->
13 <canvas id = "alpha" width = "200" height = "200"
14 style = "border: 1px solid black;">
15 </canvas>
16 <script>
17 var canvas = document.getElementById("alpha");
18 var context = canvas.getContext("2d")
19 context.beginPath();
20 context.rect(10, 10, 120, 120);
21 context.fillStyle = "purple";
22 context.fill();
23 context.globalAlpha = 0.9;
24 context.beginPath();
25 context.arc(120, 120, 65, 0, 2 * Math.PI, false);
26 context.fillStyle = "lime";
27 context.fill();
28 </script>
29
30 <!-- 0.5 alpha value -->
31 <canvas id = "alpha2" width = "200" height = "200"
32 style = "border: 1px solid black;">
33 </canvas>
34 <script>
35 var canvas = document.getElementById("alpha2");
36 var context = canvas.getContext("2d")
37 context.beginPath();
38 context.rect(10, 10, 120, 120);
39 context.fillStyle = "purple";
40 context.fill();
41 context.globalAlpha = 0.5;
42 context.beginPath();
43 context.arc(120, 120, 65, 0, 2 * Math.PI, false);
44 context.fillStyle = "lime";
45 context.fill();
46 </script>
47
48 <!-- 0.15 alpha value -->
49 <canvas id = "alpha3" width = "200" height = "200"
50 style = "border: 1px solid black;">
51 </canvas>
52 <script>
53 var canvas = document.getElementById("alpha3");
54 var context = canvas.getContext("2d")
55 context.beginPath();
56 context.rect(10, 10, 120, 120);
57 context.fillStyle = "purple";
58 context.fill();
59 context.globalAlpha = 0.15;
60 context.beginPath();
61 context.arc(120, 120, 65, 0, 2 * Math.PI, false);
62 context.fillStyle = "lime";
63 context.fill();
64 </script>
65 </body>
66 </html>
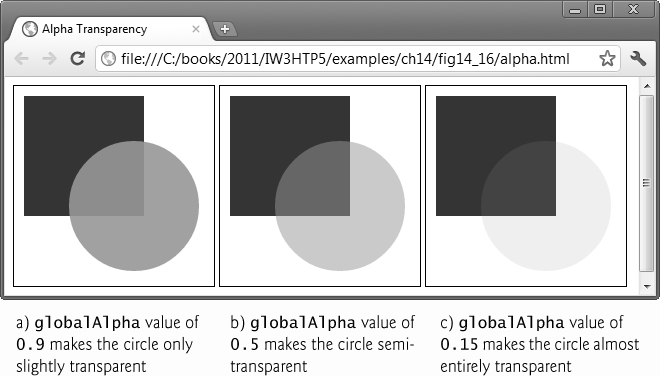
Fig. 14.21. Using the globalAlpha attribute on a canvas.
14.18. Compositing
Compositing allows you to control the layering of shapes and images on a canvas using two attributes—the globalAlpha attribute described in the previous example, and the globalCompositeOperation attribute. There are 11 globalCompositeOperation attribute values (Fig. 14.22). The source is the image being drawn to a canvas. The destination is the current bitmap on a canvas.

Fig. 14.22. globalCompositeOperation values.
In Fig. 14.23, we demonstrate six of the compositing effects (lines 21–49). In this example, the destination image is a large red rectangle (lines 18–19) and the source images are six lime rectangles.
1 <!DOCTYPE html>
2
3 <!-- Fig. 14.23: image.html -->
4 <!-- Compositing on a canvas. -->
5 <html>
6 <head>
7 <meta charset = "utf-8">
8 <title>Compositing</title>
9 </head>
10 <body>
11 <canvas id = "composite" width = "220" height = "200">
12 </canvas>
13 <script>
14 function draw()
15 {
16 var canvas = document.getElementById("composite");
17 var context = canvas.getContext("2d")
18 context.fillStyle = "red";
19 context.fillRect(5, 50, 210, 100);
20
21 // source-atop
22 context.globalCompositeOperation = "source-atop";
23 context.fillStyle = "lime";
24 context.fillRect(10, 20, 60, 60);
25
26 // source-over
27 context.globalCompositeOperation = "source-over";
28 context.fillStyle = "lime";
29 context.fillRect(10, 120, 60, 60);
30
31 // destination-over
32 context.globalCompositeOperation = "destination-over";
33 context.fillStyle = "lime";
34 context.fillRect(80, 20, 60, 60);
35
36 // destination-out
37 context.globalCompositeOperation = "destination-out";
38 context.fillStyle = "lime";
39 context.fillRect(80, 120, 60, 60);
40
41 // lighter
42 context.globalCompositeOperation = "lighter";
43 context.fillStyle = "lime";
44 context.fillRect(150, 20, 60, 60);
45
46 // xor
47 context.globalCompositeOperation = "xor";
48 context.fillStyle = "lime";
49 context.fillRect(150, 120, 60, 60);
50 } // end function draw
51
52 window.addEventListener( "load", draw, false );
53 </script>
54 </body>
55 </html>

Fig. 14.23. Demonstrating compositing on a canvas.
14.19. Cannon Game
Now let’s have some fun! The Cannon Game app challenges you to destroy a seven-piece moving target before a ten-second time limit expires (Fig. 14.24).2 The game consists of four visual components—a cannon that you control, a cannonball fired by the cannon, the seven-piece target and a moving blocker that defends the target to make the game more challenging. You aim the cannon by clicking the screen—the cannon then aims where you clicked and fires a cannonball. You can fire a cannonball only if there is not another one on the screen.
2 The Cannon Game currently works in Chrome, Internet Explorer 9 and Safari. It does not work properly in Opera, Firefox, iPhone and Android.
The game begins with a 10-second time limit. Each time you hit a target section, you are rewarded with three seconds being added to the time limit; each time you hit the blocker, you are penalized with two seconds being subtracted from the time limit. You win by destroying all seven target sections before time runs out. If the timer reaches zero, you lose. When the game ends, it displays an alert dialog indicating whether you won or lost, and shows the number of shots fired and the elapsed time (Fig. 14.25).
When the cannon fires, the game plays a firing sound. The target consists of seven pieces. When a cannonball hits a piece of the target, a glass-breaking sound plays and that piece disappears from the screen. When the cannonball hits the blocker, a hit sound plays and the cannonball bounces back. The blocker cannot be destroyed. The target and blocker move vertically at different speeds, changing direction when they hit the top or bottom of the screen. At any time, the blocker and the target can be moving in the same or different directions.

Fig. 14.24. Completed Cannon Game app.
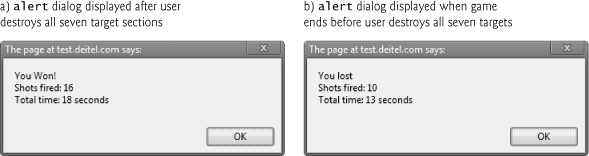
Fig. 14.25. Cannon Game app alerts showing a win and a loss.
14.19.1. HTML5 Document
Figure 14.26 shows the HTML5 document for the Cannon Game. Lines 15–20 use HTML5 audio elements to load the game’s sounds, which are located in the same folder as the HTML5 document. Recall from Chapter 9 that the HTML5 audio element may contain multiple source elements for the audio file in several formats, so that you can support cross-browser playback of the sounds. For this app, we’ve included only MP3 files. We set the audio element’s preload attribute to auto to indicate that the sounds should be loaded immediately when the page loads. Line 22 creates a Start Game button which the user will click to launch the game. After a game is over, this button remains on the screen so that the user can click it to play again.
1 <!DOCTYPE html>
2
3 <!-- Fig. 14.26: cannon.html -->
4 <!-- Cannon Game HTML5 document. -->
5 <html>
6 <head>
7 <meta charset = "utf-8">
8 <title>Cannon Game</title>
9 <style type = "text/css">
10 canvas { border: 1px solid black; }
11 </style>
12 <script src = "cannon.js"></script>
13 </head>
14 <body>
15 <audio id = "blockerSound" preload = "auto">
16 <source src = "blocker_hit.mp3" type = "audio/mpeg"></audio>
17 <audio id = "targetSound" preload = "auto">
18 <source src = "target_hit.mp3" type = "audio/mpeg"></audio>
19 <audio id = "cannonSound" preload = "auto">
20 <source src = "cannon_fire.mp3" type = "audio/mpeg"></audio>
21 <canvas id = "theCanvas" width = "480" height = "600"></canvas>
22 <p><input id = "startButton" type = "button" value = "Start Game">
23 </p>
24 </body>
25 </html>
Fig. 14.26. Cannon Game HTML5 document.
14.19.2. Instance Variables and Constants
Figure 14.27 lists the Cannon Game’s numerous constants and instance variables. Most are self-explanatory, but we’ll explain each as we encounter it in the discussion.
1 // Fig. 14.27 cannon.js
2 // Logic of the Cannon Game
3 var canvas; // the canvas
4 var context; // used for drawing on the canvas
5
6 // constants for game play
7 var TARGET_PIECES = 7; // sections in the target
8 var MISS_PENALTY = 2; // seconds deducted on a miss
9 var HIT_REWARD = 3; // seconds added on a hit
10 var TIME_INTERVAL = 25; // screen refresh interval in milliseconds
11
12 // variables for the game loop and tracking statistics
13 var intervalTimer; // holds interval timer
14 var timerCount; // times the timer fired since the last second
15 var timeLeft; // the amount of time left in seconds
16 var shotsFired; // the number of shots the user has fired
17 var timeElapsed; // the number of seconds elapsed
18
19 // variables for the blocker and target
20 var blocker; // start and end points of the blocker
21 var blockerDistance; // blocker distance from left
22 var blockerBeginning; // blocker distance from top
23 var blockerEnd; // blocker bottom edge distance from top
24 var initialBlockerVelocity; // initial blocker speed multiplier
25 var blockerVelocity; // blocker speed multiplier during game
26
27 var target; // start and end points of the target
28 var targetDistance; // target distance from left
29 var targetBeginning; // target distance from top
30 var targetEnd; // target bottom's distance from top
31 var pieceLength; // length of a target piece
32 var initialTargetVelocity; // initial target speed multiplier
33 var targetVelocity; // target speed multiplier during game
34
35 var lineWidth; // width of the target and blocker
36 var hitStates; // is each target piece hit?
37 var targetPiecesHit; // number of target pieces hit (out of 7)
38
39 // variables for the cannon and cannonball
40 var cannonball; // cannonball image's upper-left corner
41 var cannonballVelocity; // cannonball's velocity
42 var cannonballOnScreen; // is the cannonball on the screen
43 var cannonballRadius; // cannonball radius
44 var cannonballSpeed; // cannonball speed
45 var cannonBaseRadius; // cannon base radius
46 var cannonLength; // cannon barrel length
47 var barrelEnd; // the end point of the cannon's barrel
48 var canvasWidth; // width of the canvas
49 var canvasHeight; // height of the canvas
50
51 // variables for sounds
52 var targetSound;
53 var cannonSound;
54 var blockerSound;
55
Fig. 14.27. Cannon Game variable declarations.
14.19.3. Function setupGame
Figure 14.28 shows function setupGame. Later in the script, line 408 registers the window object’s load event handler so that function setupGame is called when the cannon.html page loads.
Lines 71–78 create the blocker, target, cannonball and barrelEnd as JavaScript Objects. You can create your own properties on such Objects simply by assigning a value to a property name. For example, lines 72–73 create start and end properties to represent the start and end points, respectively, of the blocker. Each is initialized as an Object so that it, in turn, can contain x and y properties representing the coordinates of the point. Function resetElements (Fig. 14.30) sets the initial values of the x and y properties for the start and end of the blocker and target.
We create boolean array hitStates (line 81) to keep track of which of the target’s seven pieces have been hit (and thus should not be drawn). Lines 84–86 get references to the audio elements that represent the game’s sounds—we use these to call play on each audio at the appropriate time.
56 // called when the app first launches
57 function setupGame()
58 {
59 // stop timer if document unload event occurs
60 document.addEventListener( "unload", stopTimer, false );
61
62 // get the canvas, its context and setup its click event handler
63 canvas = document.getElementById( "theCanvas" );
64 context = canvas.getContext("2d");
65
66 // start a new game when user clicks Start Game button
67 document.getElementById( "startButton" ).addEventListener(
68 "click", newGame, false );
69
70 // JavaScript Object representing game items
71 blocker = new Object(); // object representing blocker line
72 blocker.start = new Object(); // will hold x-y coords of line start
73 blocker.end = new Object(); // will hold x-y coords of line end
74 target = new Object(); // object representing target line
75 target.start = new Object(); // will hold x-y coords of line start
76 target.end = new Object(); // will hold x-y coords of line end
77 cannonball = new Object(); // object representing cannonball point
78 barrelEnd = new Object(); // object representing end of cannon barrel
79
80 // initialize hitStates as an array
81 hitStates = new Array(TARGET_PIECES);
82
83 // get sounds
84 targetSound = document.getElementById( "targetSound" );
85 cannonSound = document.getElementById( "cannonSound" );
86 blockerSound = document.getElementById( "blockerSound" );
87 } // end function setupGame
88
Fig. 14.28. Cannon Game function setupGame.
14.19.4. Functions startTimer and stopTimer
Figure 14.29 presents functions startTimer and stopTimer which manage the click event handler and the interval timer. As you know, users interact with this app by clicking the mouse on the device’s screen. A click aligns the cannon to face the point of the click and fires the cannon. Line 92 in function startTimer registers function fireCannonball as the canvas’s click event handler. Once the game is over, we don’t want the user to be able to click the canvas anymore, so line 99 in function stopTimer removes the canvas’s click event handler.
Line 93 in function startTimer creates an interval timer that calls updatePositions to update the game every TIME_INTERVAL (Fig. 14.27, line 10) milliseconds. TIME_INTERVAL can be adjusted to increase or decrease the CannonView’s refresh rate. Based on the value of the TIME_INTERVAL constant (25), updatePositions is called approximately 40 times per second. When the game is over, stopTimer is called and line 100 terminates the interval timer so that updatePositions is not called again until the user starts a new game.
89 // set up interval timer to update game
90 function startTimer()
91 {
92 canvas.addEventListener( "click", fireCannonball, false );
93 intervalTimer = window.setInterval( updatePositions, TIME_INTERVAL );
94 } // end function startTimer
95
96 // terminate interval timer
97 function stopTimer()
98 {
99 canvas.removeEventListener( "click", fireCannonball, false );
100 window.clearInterval( intervalTimer );
101 } // end function stopTimer
102
Fig. 14.29. Cannon Game functions startTimer and stopTimer.
14.19.5. Function resetElements
Function resetElements (Fig. 14.30) is called by function newGame to position and scale the size of the game elements relative to the size of the canvas. The calculations performed here scale the game’s on-screen elements based on the canvas’s pixel width and height—we arrived at our scaling factors via trial and error until the game surface looked good. Lines 141–142 set the end point of the cannon’s barrel to point horizontally and to the right from the midpoint of the left border of the canvas.
103 // called by function newGame to scale the size of the game elements
104 // relative to the size of the canvas before the game begins
105 function resetElements()
106 {
107 var w = canvas.width;
108 var h = canvas.height;
109 canvasWidth = w; // store the width
110 canvasHeight = h; // store the height
111 cannonBaseRadius = h / 18; // cannon base radius 1/18 canvas height
112 cannonLength = w / 8; // cannon length 1/8 canvas width
113
114 cannonballRadius = w / 36; // cannonball radius 1/36 canvas width
115 cannonballSpeed = w * 3 / 2; // cannonball speed multiplier
116
117 lineWidth = w / 24; // target and blocker 1/24 canvas width
118
119 // configure instance variables related to the blocker
120 blockerDistance = w * 5 / 8; // blocker 5/8 canvas width from left
121 blockerBeginning = h / 8; // distance from top 1/8 canvas height
122 blockerEnd = h * 3 / 8; // distance from top 3/8 canvas height
123 initialBlockerVelocity = h / 2; // initial blocker speed multiplier
124 blocker.start.x = blockerDistance;
125 blocker.start.y = blockerBeginning;
126 blocker.end.x = blockerDistance;
127 blocker.end.y = blockerEnd;
128
129 // configure instance variables related to the target
130 targetDistance = w * 7 / 8; // target 7/8 canvas width from left
131 targetBeginning = h / 8; // distance from top 1/8 canvas height
132 targetEnd = h * 7 / 8; // distance from top 7/8 canvas height
133 pieceLength = (targetEnd - targetBeginning) / TARGET_PIECES;
134 initialTargetVelocity = -h / 4; // initial target speed multiplier
135 target.start.x = targetDistance;
136 target.start.y = targetBeginning;
137 target.end.x = targetDistance;
138 target.end.y = targetEnd;
139
140 // end point of the cannon's barrel initially points horizontally
141 barrelEnd.x = cannonLength;
142 barrelEnd.y = h / 2;
143 } // end function resetElements
144
Fig. 14.30. Cannon Game function resetElements.
14.19.6. Function newGame
Function newGame (Fig. 14.31) is called when the user clicks the Start Game button; the function initializes the game’s instance variables. Lines 152–153 initialize all the elements of the hitStates array to false to indicate that none of the targets have been destroyed. Lines 155–162 initialize key variables in preparation for launching a fresh game. In particular, line 160 indicates that no cannonball is on the screen—this enables the cannon to fire a cannonball when the user next clicks the screen. Line 164 invokes function startTimer to start the game loop for the new game.
145 // reset all the screen elements and start a new game
146 function newGame()
147 {
148 resetElements(); // reinitialize all the game elements
149 stopTimer(); // terminate previous interval timer
150
151 // set every element of hitStates to false--restores target pieces
152 for (var i = 0; i < TARGET_PIECES; ++i)
153 hitStates[i] = false; // target piece not destroyed
154
155 targetPiecesHit = 0; // no target pieces have been hit
156 blockerVelocity = initialBlockerVelocity; // set initial velocity
157 targetVelocity = initialTargetVelocity; // set initial velocity
158 timeLeft = 10; // start the countdown at 10 seconds
159 timerCount = 0; // the timer has fired 0 times so far
160 cannonballOnScreen = false; // the cannonball is not on the screen
161 shotsFired = 0; // set the initial number of shots fired
162 timeElapsed = 0; // set the time elapsed to zero
163
164 startTimer(); // starts the game loop
165 } // end function newGame
166
Fig. 14.31. Cannon Game function newGame.
14.19.7. Function updatePositions: Manual Frame-by-Frame Animation and Simple Collision Detection
This app performs its animations manually by updating the positions of all the game elements at fixed time intervals. Line 93 (Fig. 14.29) in function startTimer created an interval timer that calls function updatePositions (Fig. 14.32) to update the game every 25 milliseconds (i.e., 40 times per second). This function also performs simple collision detection to determine whether the cannonball has collided with any of the canvas’s edges, with the blocker or with a section of the target. Game-development frameworks generally provide more sophisticated, built-in collision-detection capabilities.
167 // called every TIME_INTERVAL milliseconds
168 function updatePositions()
169 {
170 // update the blocker's position
171 var blockerUpdate = TIME_INTERVAL / 1000.0 * blockerVelocity;
172 blocker.start.y += blockerUpdate;
173 blocker.end.y += blockerUpdate;
174
175 // update the target's position
176 var targetUpdate = TIME_INTERVAL / 1000.0 * targetVelocity;
177 target.start.y += targetUpdate;
178 target.end.y += targetUpdate;
179
180 // if the blocker hit the top or bottom, reverse direction
181 if (blocker.start.y < 0 || blocker.end.y > canvasHeight)
182 blockerVelocity *= -1;
183
184 // if the target hit the top or bottom, reverse direction
185 if (target.start.y < 0 || target.end.y > canvasHeight)
186 targetVelocity *= -1;
187
188 if (cannonballOnScreen) // if there is currently a shot fired
189 {
190 // update cannonball position
191 var interval = TIME_INTERVAL / 1000.0;
192
193 cannonball.x += interval * cannonballVelocityX;
194 cannonball.y += interval * cannonballVelocityY;
195
196 // check for collision with blocker
197 if ( cannonballVelocityX > 0 &&
198 cannonball.x + cannonballRadius >= blockerDistance &&
199 cannonball.x + cannonballRadius <= blockerDistance + lineWidth &&
200 cannonball.y - cannonballRadius > blocker.start.y &&
201 cannonball.y + cannonballRadius < blocker.end.y)
202 {
203 blockerSound.play(); // play blocker hit sound
204 cannonballVelocityX *= -1; // reverse cannonball's direction
205 timeLeft -= MISS_PENALTY; // penalize the user
206 } // end if
207
208 // check for collisions with left and right walls
209 else if (cannonball.x + cannonballRadius > canvasWidth ||
210 cannonball.x - cannonballRadius < 0)
211 {
212 cannonballOnScreen = false; // remove cannonball from screen
213 } // end else if
214
215 // check for collisions with top and bottom walls
216 else if (cannonball.y + cannonballRadius > canvasHeight ||
217 cannonball.y - cannonballRadius < 0)
218 {
219 cannonballOnScreen = false; // make the cannonball disappear
220 } // end else if
221
222 // check for cannonball collision with target
223 else if (cannonballVelocityX > 0 &&
224 cannonball.x + cannonballRadius >= targetDistance &&
225 cannonball.x + cannonballRadius <= targetDistance + lineWidth &&
226 cannonball.y - cannonballRadius > target.start.y &&
227 cannonball.y + cannonballRadius < target.end.y)
228 {
229 // determine target section number (0 is the top)
230 var section =
231 Math.floor((cannonball.y - target.start.y) / pieceLength);
232
233 // check whether the piece hasn't been hit yet
234 if ((section >= 0 && section < TARGET_PIECES) &&
235 !hitStates[section])
236 {
237 targetSound.play(); // play target hit sound
238 hitStates[section] = true; // section was hit
239 cannonballOnScreen = false; // remove cannonball
240 timeLeft += HIT_REWARD; // add reward to remaining time
241
242 // if all pieces have been hit
243 if (++targetPiecesHit == TARGET_PIECES)
244 {
245 stopTimer(); // game over so stop the interval timer
246 draw(); // draw the game pieces one final time
247 showGameOverDialog("You won!"); // show winning dialog
248 } // end if
249 } // end if
250 } // end else if
251 } // end if
252
253 ++timerCount; // increment the timer event counter
254
255 // if one second has passed
256 if (TIME_INTERVAL * timerCount >= 1000)
257 {
258 --timeLeft; // decrement the timer
259 ++timeElapsed; // increment the time elapsed
260 timerCount = 0; // reset the count
261 } // end if
262
263 draw(); // draw all elements at updated positions
264
265 // if the timer reached zero
266 if (timeLeft <= 0)
267 {
268 stopTimer();
269 showGameOverDialog("You lost"); // show the losing dialog
270 } // end if
271 } // end function updatePositions
272
Fig. 14.32. Cannon Game function updatePositions.
The function begins by updating the positions of the blocker and the target. Lines 171–173 change the blocker’s position by multiplying blockerVelocity by the amount of time that has passed since the last update and adding that value to the current x- and y-coordinates. Lines 176–178 do the same for the target. If the blocker has collided with the top or bottom wall, its direction is reversed by multiplying its velocity by -1 (lines 181–182). Lines 185–186 perform the same check and adjustment for the full length of the target, including any sections that have already been hit.
Line 188 checks whether the cannonball is on the screen. If it is, we update its position by adding the distance it should have traveled since the last timer event. This is calculated by multiplying its velocity by the amount of time that passed (lines 193–194).
Lines 198–201 check whether the cannonball has collided with the blocker. We perform simple collision detection, based on the rectangular boundary of the cannonball. Four conditions must be met if the cannonball is in contact with the blocker:
• The cannonball has reached the blocker’s distance from the left edge of the screen.
• The cannonball has not yet passed the blocker.
• Part of the cannonball must be lower than the top of the blocker.
• Part of the cannonball must be higher than the bottom of the blocker.
If all these conditions are met, we play blocker hit sound (line 203), reverse the cannonball’s direction on the screen (line 204) and penalize the user by subtracting MISS_PENALTY from timeLeft.
We remove the cannonball if it reaches any of the screen’s edges. Lines 209–212 test whether the cannonball has collided with the left or right wall and, if it has, remove the cannonball from the screen. Lines 216–219 remove the cannonball if it collides with the top or bottom of the screen.
We then check whether the cannonball has hit the target (lines 223–227). These conditions are similar to those used to determine whether the cannonball collided with the blocker. If the cannonball hit the target, we determine which section of the target was hit. Lines 230–231 accomplish this—dividing the distance between the cannonball and the bottom of the target by the length of a piece. This expression evaluates to 0 for the topmost section and 6 for the bottommost. We check whether that section was previously hit, using the hitStates array (lines 234–235). If it wasn’t, we play the target hit sound, set the corresponding hitStates element to true and remove the cannonball from the screen. We then add HIT_REWARD to timeLeft, increasing the game’s time remaining. We increment targetPiecesHit, then determine whether it’s equal to TARGET_PIECES (line 243). If so, the game is over, so we call function stopTimer to stop the interval timer and function draw to perform the final update of the game elements on the screen. Then we call showGameOverDialog with the string "You won!".
We increment the timerCount, keeping track of the number of times we’ve updated the on-screen elements’ positions (line 253). If the product of TIME_INTERVAL and timerCount is >= 1000 (i.e., one second has passed since timeLeft was last updated), we decrement timeLeft, increment timeElapsed and reset timerCount to zero (lines 256–260). Then we draw all the elements at their updated positions (line 263). If the timer has reached zero, the game is over—we call function stopTimer and call function showGameOverDialog with the string "You Lost" (lines 266–269).
14.19.8. Function fireCannonball
When the user clicks the mouse on the canvas, the click event handler calls function fireCannonball (Fig. 14.33) to fire a cannonball. If there’s already a cannonball on the screen, another cannot be fired, so the function returns immediately; otherwise, it fires the cannon. Line 279 calls alignCannon to aim the cannon at the click point and get the cannon’s angle. Lines 282–283 “load” the cannon (that is, position the cannonball inside the cannon). Then, lines 286 and 289 calculate the horizontal and vertical components of the cannonball’s velocity. Next, we set cannonballOnScreen to true so that the cannonball will be drawn by function draw (Fig. 14.35) and increment shotsFired. Finally, we play the cannon’s firing sound (cannonSound).
273 // fires a cannonball
274 function fireCannonball(event)
275 {
276 if (cannonballOnScreen) // if a cannonball is already on the screen
277 return; // do nothing
278
279 var angle = alignCannon(event); // get the cannon barrel's angle
280
281 // move the cannonball to be inside the cannon
282 cannonball.x = cannonballRadius; // align x-coordinate with cannon
283 cannonball.y = canvasHeight / 2; // centers ball vertically
284
285 // get the x component of the total velocity
286 cannonballVelocityX = (cannonballSpeed * Math.sin(angle)).toFixed(0);
287
288 // get the y component of the total velocity
289 cannonballVelocityY = (-cannonballSpeed * Math.cos(angle)).toFixed(0);
290 cannonballOnScreen = true; // the cannonball is on the screen
291 ++shotsFired; // increment shotsFired
292
293 // play cannon fired sound
294 cannonSound.play();
295 } // end function fireCannonball
296
Fig. 14.33. Cannon Game function fireCannonball.
14.19.9. Function alignCannon
Function alignCannon (Fig. 14.34) aims the cannon at the point where the user clicked the mouse on the screen. Lines 302–303 get the x- and y-coordinates of the click from the event argument. We compute the vertical distance of the mouse click from the center of the screen. If this is not zero, we calculate the cannon barrel’s angle from the horizontal (line 313). If the click is on the lower half of the screen we adjust the angle by Math.PI (line 317). We then use the cannonLength and the angle to determine the x- and y-coordinates for the end point of the cannon’s barrel (lines 320–322)—this is used in function draw (Fig. 14.35) to draw a line from the cannon base’s center at the left edge of the screen to the cannon barrel’s end point.
297 // aligns the cannon in response to a mouse click
298 function alignCannon(event)
299 {
300 // get the location of the click
301 var clickPoint = new Object();
302 clickPoint.x = event.x;
303 clickPoint.y = event.y;
304
305 // compute the click's distance from center of the screen
306 // on the y-axis
307 var centerMinusY = (canvasHeight / 2 - clickPoint.y);
308
309 var angle = 0; // initialize angle to 0
310
311 // calculate the angle the barrel makes with the horizontal
312 if (centerMinusY !== 0) // prevent division by 0
313 angle = Math.atan(clickPoint.x / centerMinusY);
314
315 // if the click is on the lower half of the screen
316 if (clickPoint.y > canvasHeight / 2)
317 angle += Math.PI; // adjust the angle
318
319 // calculate the end point of the cannon's barrel
320 barrelEnd.x = (cannonLength * Math.sin(angle)).toFixed(0);
321 barrelEnd.y =
322 (-cannonLength * Math.cos(angle) + canvasHeight / 2).toFixed(0);
323
324 return angle; // return the computed angle
325 } // end function alignCannon
326
Fig. 14.34. Cannon Game function alignCannon.
14.19.10. Function draw
When the screen needs to be redrawn, the draw function (Fig. 14.35) renders the game’s on-screen elements—the cannon, the cannonball, the blocker and the seven-piece target. We use various canvas properties to specify drawing characteristics, including color, line thickness, font size and more, and various canvas functions to draw text, lines and circles.
Lines 333–336 display the time remaining in the game. If the cannonball is on the screen, lines 341–346 draw the cannonball in its current position.
We display the cannon barrel (lines 350–355), the cannon base (lines 358–362), the blocker (lines 365–369) and the target pieces (lines 372–398).
Lines 377–398 iterate through the target’s sections, drawing each in the correct color—blue for the odd-numbered pieces and yellow for the others. Only those sections that haven’t been hit are displayed.
327 // draws the game elements to the given Canvas
328 function draw()
329 {
330 canvas.width = canvas.width; // clears the canvas (from W3C docs)
331
332 // display time remaining
333 context.fillStyle = "black";
334 context.font = "bold 24px serif";
335 context.textBaseline = "top";
336 context.fillText("Time remaining: " + timeLeft, 5, 5);
337
338 // if a cannonball is currently on the screen, draw it
339 if (cannonballOnScreen)
340 {
341 context.fillStyle = "gray";
342 context.beginPath();
343 context.arc(cannonball.x, cannonball.y, cannonballRadius,
344 0, Math.PI * 2);
345 context.closePath();
346 context.fill();
347 } // end if
348
349 // draw the cannon barrel
350 context.beginPath(); // begin a new path
351 context.strokeStyle = "black";
352 context.moveTo(0, canvasHeight / 2); // path origin
353 context.lineTo(barrelEnd.x, barrelEnd.y);
354 context.lineWidth = lineWidth; // line width
355 context.stroke(); // draw path
356
357 // draw the cannon base
358 context.beginPath();
359 context.fillStyle = "gray";
360 context.arc(0, canvasHeight / 2, cannonBaseRadius, 0, Math.PI*2);
361 context.closePath();
362 context.fill();
363
364 // draw the blocker
365 context.beginPath(); // begin a new path
366 context.moveTo(blocker.start.x, blocker.start.y); // path origin
367 context.lineTo(blocker.end.x, blocker.end.y);
368 context.lineWidth = lineWidth; // line width
369 context.stroke(); //draw path
370
371 // initialize currentPoint to the starting point of the target
372 var currentPoint = new Object();
373 currentPoint.x = target.start.x;
374 currentPoint.y = target.start.y;
375
376 // draw the target
377 for (var i = 0; i < TARGET_PIECES; ++i)
378 {
379 // if this target piece is not hit, draw it
380 if (!hitStates[i])
381 {
382 context.beginPath(); // begin a new path for target
383
384 // alternate coloring the pieces yellow and blue
385 if (i % 2 === 0)
386 context.strokeStyle = "yellow";
387 else
388 context.strokeStyle = "blue";
389
390 context.moveTo(currentPoint.x, currentPoint.y); // path origin
391 context.lineTo(currentPoint.x, currentPoint.y + pieceLength);
392 context.lineWidth = lineWidth; // line width
393 context.stroke(); // draw path
394 } // end if
395
396 // move currentPoint to the start of the next piece
397 currentPoint.y += pieceLength;
398 } // end for
399 } // end function draw
400
Fig. 14.35. Cannon Game function draw.
14.19.11. Function showGameOverDialog
When the game ends, the showGameOverDialog function (Fig. 14.36) displays an alert indicating whether the player won or lost, the number of shots fired and the total time elapsed. Line 408 registers the window object’s load event handler so that function setupGame is called when the cannon.html page loads.
401 // display an alert when the game ends
402 function showGameOverDialog(message)
403 {
404 alert(message + "
Shots fired: " + shotsFired +
405 "
Total time: " + timeElapsed + " seconds ");
406 } // end function showGameOverDialog
407
408 window.addEventListener("load", setupGame, false);
Fig. 14.36. Cannon Game function showGameOverDialog.
14.20. save and restore Methods
The canvas’s state includes its current style and transformations, which are maintained in a stack. The save method is used to save the context’s current state. The restore method restores the context to its previous state. Figure 14.37 demonstrates using the save method to change a rectangle’s fillStyle and the restore method to restore the fillStyle to the previous settings in the stack.
1 <!DOCTYPE html>
2
3 <!-- Fig. 14.37: saveandrestore.html -->
4 <!-- Saving the current state and restoring the previous state. -->
5 <html>
6 <head>
7 <meta charset = "utf-8">
8 <title>Save and Restore</title>
9 </head>
10 <body>
11 <canvas id = "save" width = "400" height = "200">
12 </canvas>
13 <script>
14 function draw()
15 {
16 var canvas = document.getElementById("save");
17 var context = canvas.getContext("2d")
18
19 // draw rectangle and save the settings
20 context.fillStyle = "red"
21 context.fillRect(0, 0, 400, 200);
22 context.save();
23
24 // change the settings and save again
25 context.fillStyle = "orange"
26 context.fillRect(0, 40, 400, 160);
27 context.save();
28
29 // change the settings again
30 context.fillStyle = "yellow"
31 context.fillRect(0, 80, 400, 120);
32
33 // restore to previous settings and draw new rectangle
34 context.restore();
35 context.fillRect(0, 120, 400, 80);
36
37 // restore to original settings and draw new rectangle
38 context.restore();
39 context.fillRect(0, 160, 400, 40);
40 }
41 window.addEventListener( "load", draw, false );
42 </script>
43 </body>
44 </html>
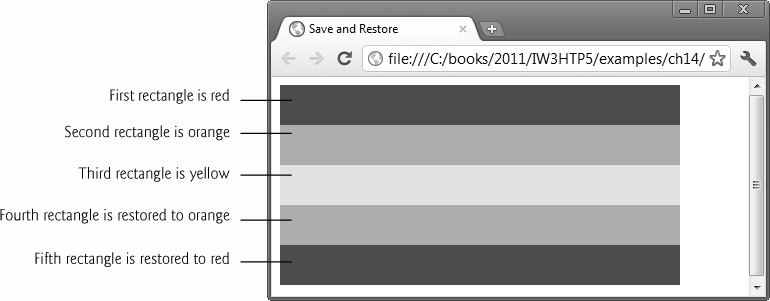
Fig. 14.37. Saving the current state and restoring the previous state.
We begin by drawing a red rectangle (lines 20–21), then using the save method to save its style (line 22). Next, we draw an orange rectangle and save its style (lines 25–27). Then we draw a yellow rectangle (lines 30–31) without saving its style.
Now we draw two rectangles, restoring the previous styles in reverse order of the stack—last in, first out. Line 34 uses the restore method to revert to the last-saved style in the stack. Then we draw a new rectangle (line 35). The result is an orange rectangle.
We use the restore method again to revert back to the first-saved style (line 38), then draw a fifth rectangle (line 39). The result is a red rectangle.
14.21. A Note on SVG
We’ve devoted this chapter to the new HTML5 canvas. Most current browsers also support SVG (Scalable Vector Graphics), which offers a different approach to developing 2D graphics. Although we do not present SVG, we’ll compare it briefly to HTML5 canvas so you can determine which might be more appropriate for particular applications.
SVG has been around since the early 2000s and is a mature technology with well-established standards. canvas is part of the HTML5 initiative and is an emerging technology with evolving standards.
canvas graphics are bitmapped—they’re made of pixels. Vector graphics are made of scalable geometric primitives such as line segments and arcs.
Drawing is convenient in each of these technologies, but the mechanisms are different. SVG is XML-based, so it uses a declarative approach—you say what you want and SVG builds it for you. HTML5 canvas is JavaScript-based, so it uses an imperative approach—you say how to build your graphics by programming in JavaScript.
Anything you draw on a canvas ultimately becomes nothing more than bits. With SVG, each separate part of your graphic becomes an object that can be manipulated through the DOM. So, for example, it’s easy to attach event handlers to items in SVG graphics. This makes SVG graphics more appropriate for interactive applications.
canvas is a low-level capability that offers higher performance than SVG; this makes canvas more appropriate for applications with intense performance demands, such as game programming. The DOM manipulation in SVG can degrade performance, particularly for more complex graphics.
SVG graphics easily and accurately scale to larger or smaller drawing surfaces. canvas graphics can be scaled, but the results may not be as eye pleasing.
SVG is more appropriate for accessibility applications for people with disabilities. It’s easier, for example, for people with low vision or vision impairments to work with the XML text in an SVG document than with the pixels in a canvas.
canvas is more appropriate for pixel-manipulation applications (such as color-to-black-and-white image conversion; Section 14.12) and game-playing applications (such as the Cannon Game in Section 14.19). SVG has better animation capabilities, so game developers often use a mix of both the canvas and SVG approaches.
SVG has better text-rendering capabilities. And the text is still an object after it’s on the screen, so you can easily edit it and change its attributes. Text on a canvas is “lost” in the bits, so it’s difficult to modify.
SVG is more convenient for cross-platform graphics, which is becoming especially important with the proliferation of “form factors,” such as desktops, notebooks, smartphones, tablets and various special-purpose devices such as car navigation systems.
An additional problem for canvas-based applications is that some web users disable JavaScript in their browsers. You should consider mastering both technologies.
14.22. A Note on canvas 3D
At the time of this writing, 3D functionality was not yet supported in canvas, though various tools and plug-ins enable you to create 3D effects. It’s widely expected that a future version of the HTML5 canvas specification will support 3D capabilities. Figure 14.38 lists several websites with fun and interesting 3D examples.

Fig. 14.38. HTML5 canvas 3D demos and tutorials.
Summary
Section 14.2 canvas Coordinate System
• The canvas coordinate system (p. 445) is a scheme for identifying every point on a canvas.
• By default, the upper-left corner of a canvas has the coordinates (0, 0).
• A coordinate pair has both an x-coordinate (the horizontal coordinate; p. 446) and a y-coordinate (the vertical coordinate; p. 446).
• The x-coordinate (p. 446) is the horizontal distance to the right from the left border of a canvas. The y-coordinate (p. 446) is the vertical distance downward from the top border of a canvas.
• The x-axis (p. 446) defines every horizontal coordinate, and the y-axis (p. 446) defines every vertical coordinate.
• You position text and shapes on a canvas by specifying their x- y-coordinates.
• Coordinate space units are measured in pixels (“picture elements”), which are the smallest units of resolution on a screen.
Section 14.3 Rectangles
• A canvas is a rectangular area in which you can draw.
• The canvas element (p. 447) has two attributes—width and height. The default width is 300, and the default height is 150.
• The fillStyle (p. 447) specifies the color of the rectangle.
• To specify the coordinates of the rectangle, we use fillRect (p. 447) in the format (x, y, w, h), where x and y are the coordinates for the top-left corner of the rectangle, w is the width of the rectangle and h is the height.
• The strokeStyle (p. 447) specifies the stroke color and lineWidth (p. 447) specifies the line width.
• The strokeRect method (p. 447) specifies the path of the stroke in the format (x, y, w, h).
• If the width and height are 0, no stroke will appear. If either the width or the height is 0, the result will be a line, not a rectangle.
Section 14.4 Using Paths to Draw Lines
• The beginPath method (p. 448) starts the path.
• The moveTo method (p. 448) sets the x- and y-coordinates of the path’s origin.
• From the point of origin, we use the lineTo method (p. 448) specify the destinations for the path.
• The lineWidth attribute (p. 448) is used to change the thickness of the line. The default lineWidth is 1.0.
• The lineJoin attribute (p. 448) specifies the style of the corners where two lines meet. It has three possible values—bevel, round, and miter.
• The bevel lineJoin gives the path sloping corners.
• The lineCap attribute (p. 449) defines the style of the line ends. There are three possible values—butt, round, and square.
• A butt lineCap specifies that the line ends have edges perpendicular to the direction of the line and no additional cap.
• The strokeStyle attribute (p. 450) specifies the line color.
• The stroke method (p. 450) draws lines on a canvas. The default stroke color is black.
• The round lineJoin creates rounded corners. Then, the round lineCap adds a semicircular cap to the ends of the path. The diameter of the added cap is equal to the width of the line.
• The closePath method (p. 450) closes the path by drawing a line from the last specified destination back to the point of the path’s origin.
• The miter lineJoin bevels the lines at an angle where they meet. For example, the lines that meet at a 90-degree angle have edges bevelled at 45-degree angles where they meet.
• A square lineCap adds a rectangular cap to the line ends. The length of the cap is equal to the line width, and the width of the cap is equal to half of the line width. The edge of the square lineCap is perpendicular to the direction of the line.
Section 14.5 Drawing Arcs and Circles
• Arcs are portions of the circumference of a circle. To draw an arc, you specify the arc’s starting angle and ending angle (p. 450) measured in radians—the ratio of the arc’s length to its radius.
• The arc method (p. 450) draws the circle using five arguments. The first two arguments represent the x- and y-coordinates of the center of the circle. The third argument is the radius of the circle. The fourth and fifth arguments are the arc’s starting and ending angles in radians.
• The sixth argument is optional and specifies the direction in which the arc’s path is drawn. By default, the sixth argument is false, indicating that the arc is drawn clockwise. If the argument is true, the arc is drawn counterclockwise (or anticlockwise).
• The constant Math.PI is the JavaScript representation of the mathematical constant π, the ratio of a circle’s circumference to its diameter. 2π radians represents a 360-degree arc, π radians is 180 degrees and π/2 radians is 90 degrees.
Section 14.6 Shadows
• The shadowBlur attribute (p. 452) specifies the blur and color or a shadow. By default, the blur is 0 (no blur). The higher the value, the more blurred the edges of the shadow will appear.
• A positive shadowOffsetX attribute (p. 452) moves the shadow to the right of the rectangle.
• A positive shadowOffsetY attribute (p. 452) moves the shadow down from the rectangle
• The shadowColor attribute (p. 452) specifies the color of the shadow.
• Using a negative shadowOffsetX moves the shadow to the left of the rectangle.
• Using a negative shadowOffsetY moves the shadow up from the rectangle.
• The default value for the shadowOffsetX and shadowOffsetY is 0 (no shadow).
Section 14.7 Quadratic Curves
• Quadratic curves (p. 454) have a starting point, an ending point and a single point of inflection.
• The quadraticCurveTo method (p. 454) uses four arguments. The first two, cpx and cpy, are the are the coordinates of the control point—the point of the curve’s inflection. The third and fourth arguments, x and y, are the coordinates of the ending point. The starting point is the last subpath destination, specified using the moveTo or lineTo methods.
Section 14.8 Bezier Curves
• Bezier curves (p. 456) have a starting point, an ending point and two control points through which the curve passes. These can be used to draw curves with one or two points of inflection, depending on the coordinates of the four points.
• The bezierCurveTo method (p. 456) uses six arguments. The first two arguments, cp1x and cp1y, are the coordinates of the first control point. The third and fourth arguments, cp2x and cp2y, are the coordinates for the second control point. Finally, the fifth and sixth arguments, x and y, are the coordinates of the ending point. The starting point is the last subpath destination, specified using either the moveTo or lineTo method.
Section 14.9 Linear Gradients
• The createLinearGradient method (p. 457) has four arguments that represent x0, y0, x1, y1, where the first two arguments are the x- and y-coordinates of the gradient’s start and the last two are the x- and y-coordinates of the end.
• The start and end have the same x-coordinates but different y-coordinates, so the start of the gradient is a point at the top of the canvas directly above the point at the end of the gradient at the bottom. This creates a vertical linear gradient that starts at the top and changes as it moves to the bottom of the canvas.
• The addColorStop method (p. 459) adds color stops to the gradient. Note that each color stop has a positive value between 0 (the start of the gradient) and 1 (the end of the gradient). For each color stop, specify a color.
• The fillStyle method specifies a gradient, then the fillRect method draws the gradient on the canvas.
• To draw a horizontal gradient, use the createLinearGradient method where the start and end have different x-coordinates but the same y-coordinates.
Section 14.10 Radial Gradients
• A radial gradient is comprised of two circles—an inner circle where the gradient starts and an outer circle where the gradient ends.
• The createRadialGradient method (p. 459) has six arguments that represent x0, y0, r0, x1, y1, r1, where the first three arguments are the x- and y-coordinates and the radius of the gradient’s start circle, and the last three arguments are the x- and y-coordinates and the radius of the end circle.
• Drawing concentric circles with the same x- and y-coordinates but different radiuses creates a radial gradient that starts in a common center and changes as it moves outward to the end circle.
• If the start and end circles are not concentric circles, the effect is altered.
Section 14.11 Images
• The drawImage method (p. 461) draws an image to a canvas using five arguments. The first argument can be an image, canvas or video element. The second and third arguments are the destination x- and destination y-coordinates—these indicate the position of the top-left corner of the image on the canvas. The fourth and fifth arguments are the destination width and destination height.
Section 14.12 Image Manipulation: Processing the Individual Pixels of a canvas
• You can obtain a canvas’s pixels and manipulate their red, green, blue and alpha (RGBA) values.
• You can change the RGBA values with the input elements of type range defined in the body.
• The method getImageData (p. 466) obtains an object that contains the pixels to manipulate. The method receives a bounding rectangle representing the portion of the canvas to get.
• The returned object contains an array named data which stores every pixel in the selected rectangular area as four elements in the array. Each pixel’s data is stored in the order red, green, blue, alpha. So, the first four elements in the array represent the RGBA values of the pixel in row 0 and column 0, the next four elements represent the pixel in row 0 and column 1, etc.
Section 14.13 Patterns
• The createPattern method (p. 467) takes two arguments. The first argument is the image for the pattern, which can be an image element, a canvas element or a video element. The second argument specifies how the image will be repeated to create the pattern and can be one of four values—repeat (repeats horizontally and vertically), repeat-x (repeats horizontally), repeat-y (repeats vertically) or no-repeat.
• Use the fillStyle attribute pattern and use the fill method to draw the pattern to the canvas.
Section 14.14 Transformations
• You can change the transformation matrix (the coordinates) on the canvas using method translate (p. 468) so that the center of the canvas becomes the point of origin with the x, y values 0, 0.
• The scale method (p. 469) can stretch a circle to create an ellipse. The x value represents the horizontal scale factor, the y value the vertical scale factor.
• The rotate method (p. 470) allows you to create animated rotations on a canvas.
• To rotate an image around its center, change the transformation matrix on the canvas using the translate method. The rotate method takes one argument—the angle of the clockwise rotation, expressed in radians.
• The setInterval method (p. 471) of the window object takes two arguments. The first is the name of the function to call (rotate) and the second is the number of milliseconds between calls.
• The clearRect method (p. 471) clears the rectangle’s pixels from the canvas, converting them back to transparent. This method takes four arguments—x, y, width and height.
• The transform method (p. 472) allows you to skew, scale, rotate and translate elements without using separate transformation methods.
• The transform method takes six arguments in the format (a, b, c, d, e, f) based on a transformation matrix. The first argument, a, is the x-scale—the factor by which to scale an element horizontally. The second argument, b, is the y-skew. The third argument, c, is the x-skew. The fourth argument, d, is the y-scale—the factor by which to scale an element vertically. The fifth argument, e, is the x-translation and the sixth argument, f, is the y-translation.
Section 14.15 Text
• The font attribute (p. 474) specifies the style, size and font of the text.
• The textBaseline attribute (p. 475) specifies the alignment points of the text. There are six different attribute values—top, hanging, middle, alphabetic, ideographic and bottom.
• Method fillText (p. 475) draws the text to the canvas. This method takes three arguments. The first is the text being drawn to the canvas. The second and third arguments are the x- and y-coordinates. You may include the optional fourth argument, maxWidth, to limit the width of the text.
• The textAlign attribute (p. 475) specifies the horizontal alignment of the text relative to the x-coordinate of the text. There are five possible textAlign attribute values—left, right, center, start (the default value) and end.
• The lineWidth attribute specifies the thickness of the stroke used to draw the text.
• The strokeStyle specifies the color of the text.
• Using strokeText instead of fillText draws outlined text instead of filled text.
Section 14.16 Resizing the canvas to Fill the Browser Window
• Use a CSS style sheet to set the position of the canvas to absolute and set both its width and height to 100%, rather than using fixed coordinates.
• Use JavaScript function draw to draw the canvas when the application is rendered.
• Use the fillRect method to draw the color to the canvas. The x- and y-coordinates are 0, 0—the top left of the canvas. The the x1 value is context.canvas.width and the y1 value is context.value.height, so no matter the size of the window, the x1 value will always be the width of the canvas and the y1 value the height of the canvas.
Section 14.17 Alpha Transparency
• The globalAlpha attribute (p. 477) value can be any number between 0 (fully transparent) and 1 (the default value, which is fully opaque).
Section 14.18 Compositing
• Compositing (p. 479) allows you to control the layering of shapes and images on a canvas using two attributes—the globalAlpha attribute and the globalCompositeOperation attribute (p. 479).
• There are 11 globalCompositeOperation attribute values. The source is the image being drawn to the canvas. The destination is the current bitmap on the canvas.
• If you use source-in, the source image is displayed where the images overlap and both are opaque. Both images are transparent where there is no overlap.
• Using source-out, if the source image is opaque and the destination is transparent, the source image is displayed where the images overlap. Both images are transparent where there is no overlap.
• source-over (the default value) places the source image over the destination. The source image is displayed where it’s opaque and the images overlap. The destination is displayed where there is no overlap.
• destination-atop places the destination on top of the source image. If both images are opaque, the destination is displayed where the images overlap. If the destination is transparent but the source image is opaque, the source image is displayed where the images overlap. The source image is transparent where there is no overlap.
• destination-in displays the destination image where the images overlap and both are opaque. Both images are transparent where there is no overlap.
• Using destination-out, if the destination image is opaque and the source image is transparent, the destination is displayed where the images overlap. Both images are transparent where there is no overlap.
• destination-over places the destination image over the source image. The destination image is displayed where it’s opaque and the images overlap. The source image is displayed where there’s no overlap.
• lighter displays the sum of the source-image color and destination-image color—up to the maximum RGB color value (255)—where the images overlap. Both images are normal elsewhere.
• Using copy, if the images overlap, only the source image is displayed (the destination is ignored).
• With xor, the images are transparent where they overlap and normal elsewhere.
Section 14.19 Cannon Game
• The HTML5 audio element may contain multiple source elements for the audio file in several formats, so that you can support cross-browser playback of the sounds.
• You can create your own properties on JavaScript Objects simply by assigning a value to a property name.
• Collision detection determines whether the cannonball has collided with any of the canvas’s edges, with the blocker or with a section of the target. Game-development frameworks generally provide more sophisticated, built-in collision-detection capabilities.
Section 14.20 save and restore Methods
• The canvas’s state (p. 496) includes its current style and transformations, which are maintained in a stack.
• The save method (p. 496) is used to save the context’s current state.
• The restore method (p. 496) restores the context to its previous state.
Section 14.21 A Note on SVG
• Vector graphics are made of scalable geometric primitives such as line segments and arcs.
• SVG (Scalable Vector Graphics, p. 498) is XML-based, so it uses a declarative approach—you say what you want and SVG builds it for you. HTML5 canvas is JavaScript-based, so it uses an imperative approach–you say how to build your graphics by programming in JavaScript.
• With SVG, each separate part of your graphic becomes an object that can be manipulated through the DOM.
• SVG is more convenient for cross-platform graphics, which is becoming especially important with the proliferation of “form factors,” such as desktops, notebooks, smartphones, tablets and various special-purpose devices such as car navigation systems.
Self-Review Exercises
14.1 State whether each of the following is true or false. If false, explain why.
a. The strokeStyle attribute specifies the line width.
b. The bevel lineJoin gives the path square corners.
c. canvas’s roundedRect method is used to build rounded rectangles.
d. The fillRect method is used to specify a color or gradient.
e. By default, the origin (0, 0) is located at the exact center of the monitor.
f. The restore method restores the context to its initial state.
g. The canvas’s state includes its current style and transformations, which are maintained in a stack.
14.2 Fill in the blanks in each of the following:
a. The canvas element has two attributes—________ and ________.
b. When drawing a rectangle, the ________ method specifies the path of the stroke in the format (x, y, w, h).
c. The lineCap attribute has the possible values ________, ________, and ________.
d. The ________ method draws a line from the last specified destination back to the point of the path’s origin.
e. The ________ method specifies the three points in the Bezier curve.
f. The ________ attribute specifies the color of the shadow.
g. ________ are portions of the circumference of a circle and are measured in ________.
h. The ________ method is used to save the context’s current state.
Answers to Self-Review Exercises
14.1
a. False. The strokeStyle attribute specifies the stroke color.
b. False. The bevel lineJoin gives the path sloping corners.
c. False. Unlike CSS3, there’s no roundedRect method in canvas.
d. False. The fillStyle method specifies a color gradient, then the fillRect method draws the color or gradient on the canvas.
e. False. The origin (0, 0) corresponds to the upper-left corner of the canvas by default.
f. False. The restore method restores the context to its previous state.
g. True.
14.2
a. width, height.
b. strokeRect.
c. butt, round, square.
d. closePath.
e. bezierCurveTo.
f. shadowColor.
g. Arcs, radians.
h. save.
Exercises
14.3 State whether each of the following is true or false. If false, explain why.
a. The moveTo method sets the x- and y-coordinates of the path’s destination.
b. A square lineCap specifies that the line ends have edges perpendicular to the direction of the line and no additional cap.
c. A vertical gradient has different x-coordinates but the same y-coordinates.
d. In the canvas coordinate system, x values increase from left to right.
e. Bezier curves have a starting point, an ending point and a single point of inflection.
14.4 Fill in the blanks in each of the following:
a. The ________ method starts the path.
b. The lineJoin attribute has three possible values—________, ________, and ________.
c. The ________ attribute specifies the line color.
d. The ________ lineJoin bevels the lines at an angle where they meet.
e. Each color stop in a gradient has a value between ________ (the start of the gradient) and ________ (the end of the gradient).
f. The ________ attribute specifies the horizontal alignment of text relative to the x-coordinate of the text.
g. The constant ________ is the JavaScript representation of the mathematical constant π.
14.5 (Text Shadow) Create a shadow on the phrase "HTML5 Canvas" with an offset-x of 2px, an offset-y of 5px, a blur of 6px and a text-shadow color gray.
14.6 (Rounded Rectangle) Generalize the example in Fig. 14.7 into a roundedRect function and call it twice with different arguments to place two different rounded rectangles on the canvas.
14.7 (Diaglonal Linear Gradient) Create a canvas with a width and height of 500. Create a diagonal linear gradient using the colors of the rainbow—red, orange, yellow, green, blue, indigo, violet.
14.8 (Vertical Linear Gradient) Draw a nonrectangular shape using lines, then add a vertical linear gradient to the shape with three color stops.
14.9 (Radial Gradient) Create a canvas with a width and height of 500px. Create a radial gradient with three colors. Start the gradient in the bottom-right corner with the colors changing as from right to left.
14.10 (Shadows) Create a script that draws a rectangle with a shadow on a canvas and allows the user to control the x- and y-offsets and blur of the shadow using sliders. The first slider should adjust the shadowOffsetX using a range of -30 to 30. The second slider should adjust the shadowOffsetY using a range of -30 to 30. The third slider should adjust the shadowBlur using a range of 0 to 100.
14.11 (Concentric Circles) Write a script that draws eight concentric circles. For each new circle, increase value of the radius by 5. Vary the circles’ colors.
14.12 (Image Manipulation) Write a script that converts a color image to black and white and to sepia, and draws all three images—the original, the black and white, and the sepia—to the canvas.
14.13 (Compositing) The example in Fig. 14.23 showed you how to use six of the 11 compositing values. Create an application that uses all 11 of the compositing values, including the five values that were not covered in Fig. 14.23—source-in, source-out, destination-in, destination-atop and copy. Use an array to draw them all to the same canvas, arranged in a table. Use a red rectangle for the source image and a blue circle for the destination image.
14.14 (Moving Circle) Crate a square canvas with a width and height of 500. Write a script that continuously moves a circle counterclockwise in a diamond pattern so that the circle touches the center of each edge of the canvas.
14.15 (Draw Street Signs) Go to http://mutcd.fhwa.dot.gov/ser-shs_millennium_eng.htm and find three different street signs of your choosing. Draw each on a canvas.
14.16 (Printing in a Larger Font) Write a script that enables a (visually impaired) user to dynamically scale the font size of text on a canvas to a comfortable size. Use a slider to control the font size.
14.17 (Painting) Create a painting application that allows the you to create art by clicking and dragging the mouse across the canvas. Include options for changing the drawing color and line thickness. Provide red, green and blue sliders that allow you to select the RGB color. Include a color swatch below the three sliders so that as you move each slider, the color swatch shows you the current drawing color. Provide a line-width dialog with a single slider that controls the thickness of the line that you’ll draw. Also include options that allow you to turn the cursor into an eraser, to clear the screen and to save the current drawing. At any point, you should be able to clear the entire drawing from the canvas.
14.18 (Fireworks Text Skywriter) The website http://js-fireworks.appspot.com/ is a fun HTML5 application that uses canvas. You can enter a message, which is then written in the sky over the London skyline using a fireworks effect. The author provides the open-source code. Modify the example to create your own skywriting effect over an image of your choosing.
14.19 (Live canvas Coordinate System) Draw the canvas coordinate system. As you move the mouse around, dynamically display its x- and y-coordinates.
14.20 (Kaleidoscope) Create an animated kaleidoscope effect.
14.21 (Random-Lines Animated Art) Write a script that continuously draws lines with random lengths, locations, widths, orientations, colors, and transparencies.
14.22 (Creating Random 2D Animated Art) Create random art continuously drawing circles, rectangles, ellipses, triangles and any other shapes of your choosing. Vary their colors, line thicknesses, positions, dimensions, etc.
14.23 (Flashing Image) Write a script that repeatedly flashes an image on the screen. Do this by alternating the image with a plain background-color image.
14.24 (Cannon Game Enhancements) In Section 14.19 we showed you how to write a Cannon Game using JavaScript and HTML5 canvas. Add the following enhancements and others of your choosing:
1. Add an “explosion animation” each time the cannonball hits one of the sections of the target. Match the animation with the “explosion sound” that plays when a piece of the target is hit.
2. Play a sound when the blocker hits the top or the bottom of the screen.
3. Play a sound when the target hits the top ot the bottom of the screen.
4. Add a trail to the cannonball; erase it when the cannonball hits the target.
5. Modify the click events so that a single tap aims the cannon, and the second single tap fires it.
6. Add a scoring mechanism and keep track of the all-time best score.
7. Using CSS3 Media Queries, determine the size of the display area and scale the cannon game elements accordingly.
14.25 (Randomly Erasing an Image) Suppose an image is displayed in a canvas. One way to erase the image is simply to set every pixel to the same background color immediately, but the visual effect is dull. Write a JavaScript program that displays an image, then erases it by using random-number generation to select individual pixels to erase. After most of the image is erased, erase all the remaining pixels at once. You might try several variants of this problem. For example, you might display lines, circles or shapes randomly to erase regions of the screen.
14.26 (Text Flasher) Create a script that repeatedly flashes text on the screen. Do this by alternating the text with a plain background-color image. Allow the user to control the “blink speed” and the background color or pattern.
14.27 (Digital Clock) Implement a script that displays a digital clock on the screen. Include alarm-clock functionality.
14.28 (Analog Clock) Create a script that displays an analog clock with hour, minute and second hands that move appropriately as the time changes.
14.29 (Calling Attention to an Image) If you want to emphasize an image, you might place a row of simulated light bulbs around it. You can let the light bulbs flash in unison or fire on and off in sequence one after the other.
14.30 (Animation) Create a general-purpose JavaScript animation. It should allow the user to specify the sequence of frames to be displayed, the speed at which the images are displayed, audios and videos to be played while the animation is running and so on.
14.31 (Random Interimage Transition) In Fig. 5.14, we used CSS3 to “melt” one image into another. This provides a nice visual effect. If you’re displaying one image in a given area on the screen and you’d like to transition to another image in the same area, store the new screen image in an off-screen “buffer” and randomly copy pixels from it to the display area, overlaying the pixels already at those locations. When the vast majority of the pixels have been copied, copy the entire new image to the display area to be sure you’re displaying the complete new image. You might try several variants of this problem. For example, select all the pixels in a randomly chosen straight line or shape in the new image and overlay them above the corresponding positions of the old image.
14.32 (Background Audio) Add background audio to one of your favorite applications.
14.33 (Scrolling Marquee Sign) Create a script that scrolls dotted characters from right to left (or from left to right if that’s appropriate for your language) across a marquee-like display sign. As an option, display the text in a continuous loop, so that after the text disappears at one end, it reappears at the other.
14.34 (Scrolling-Image Marquee) Create a script that scrolls a series of images across a marquee screen.
14.35 (Dynamic Audio and Graphical Kaleidoscope) Write a kaleidoscope script that displays reflected graphics to simulate the popular children’s toy. Incorporate audio effects that “mirror” your script’s dynamically changing graphics.
14.36 (Automatic Jigsaw Puzzle Generator) Create a jigsaw puzzle generator and manipulator. The user specifies an image. Your script loads and displays the image, then breaks it into randomly selected shapes and shuffles them. The user then uses the mouse to move the pieces around to solve the puzzle. Add appropriate audio sounds as the pieces are moved around and snapped back into place. You might keep tabs on each piece and where it really belongs—then use audio effects to help the user get the pieces into the correct positions.
14.37 (Maze Generator and Walker) Develop a multimedia-based maze generator and traverser script. Let the user customize the maze by specifying the number of rows and columns and by indicating the level of difficulty. Have an animated mouse walk the maze. Use audio to dramatize the movement of your mouse character.
14.38 (Maze Traversal Using Recursive Backtracking) The grid of #s and dots (.) in Fig. 14.39 is a two-dimensional array representation of a maze. The #s represent the walls of the maze, and the dots represent locations in the possible paths through the maze. A move can be made only to a location in the array that contains a dot.
Write a recursive method (mazeTraversal) to walk through mazes like the one in Fig. 14.39. The method should receive as arguments a 12-by-12 character array representing the maze and the current location in the maze (the first time this method is called, the current location should be the entry point of the maze). As mazeTraversal attempts to locate the exit, it should place the character x in each square in the path. There’s a simple algorithm for walking through a maze that guarantees finding the exit (assuming there’s an exit—if there’s no exit, you’ll arrive at the starting location again). For details, visit: http://en.wikipedia.org/wiki/Maze_solving_algorithm#Wall_follower.
# # # # # # # # # # # #
# . . . # . . . . . . #
. . # . # . # # # # . #
# # # . # . . . . # . #
# . . . . # # # . # . .
# # # # . # . # . # . #
# . . # . # . # . # . #
# # . # . # . # . # . #
# . . . . . . . . # . #
# # # # # # . # # # . #
# . . . . . . # . . . #
# # # # # # # # # # # #
Fig. 14.39. Two-dimensional array representation of a maze.
14.39 (Generating Mazes Randomly) Write a method mazeGenerator that takes as an argument a two-dimensional 12-by-12 character array and randomly produces a maze. The method should also provide the starting and ending locations of the maze. Test your method mazeTraversal from Exercise 14.38, using several randomly generated mazes.
14.40 (Mazes of Any Size) Generalize methods mazeTraversal and mazeGenerator of Exercise 14.38 and Exercise 14.39 to process mazes of any width and height.
14.41 (One-Armed Bandit) Develop a multimedia simulation of a “one-armed bandit.” Have three spinning wheels. Place symbols and images of various fruits on each wheel. Use random-number generation to simulate the spinning of each wheel and the stopping of each wheel on a symbol.
14.42 (Horse Race) Create a simulation of a horse race. Have multiple contenders. Use audios for a race announcer. Play the appropriate audios to indicate the correct status of each contender throughout the race. Use audios to announce the final results. You might try to simulate the kinds of horse-racing games that are often played at carnivals. The players take turns at the mouse and have to perform some skill-oriented manipulation with it to advance their horses.
14.43 (Shuffleboard) Develop a multimedia-based simulation of the game of shuffleboard. Use appropriate audio and visual effects.
14.44 (Game of Pool) Create a multimedia-based simulation of the game of pool. Each player takes turns using the mouse to position a pool cue and hit it against the ball at the appropriate angle to try to make other balls fall into the pockets. Your script should keep score.
14.45 (Fireworks Designer) Create a script that enables the user to create a customized fireworks display. Create a variety of fireworks demonstrations. Then orchestrate the firing of the fireworks for maximum effect. You might synchronize your fireworks with audios or videos.
14.46 (Floor Planner) Develop a script that will help someone arrange furniture in a room.
14.47 (Crossword Puzzle) Crossword puzzles are among the most popular pastimes. Develop a multimedia-based crossword-puzzle script. Your script should enable the player to place and erase words easily. Tie your script to a large computerized dictionary. Your script also should be able to suggest completion of words on which letters have already been filled in. Provide other features that will make the crossword-puzzle enthusiast’s job easier.
14.48 (15 Puzzle) Write a multimedia-based script that enables the user to play the game of 15. The game is played on a 4-by-4 board having a total of 16 slots. One slot is empty; the others are occupied by 15 tiles numbered 1 through 15. The user can move any tile next to the currently empty slot into that slot by clicking on the tile. Your script should create the board with the tiles in random order. The goal is to arrange the tiles into sequential order, row by row.
14.49 (Reaction Time/Reaction Precision Tester) Create a script that moves a randomly created shape around the screen. The user moves the mouse to catch and click on the shape. The shape’s speed and size can be varied. Keep statistics on how long the user typically takes to catch a shape of a given size and speed. The user will have more difficulty catching faster-moving, smaller shapes.
14.50 (Rotating Images) Create a script that lets you rotate an image through some number of degrees (out of a maximum of 360 degrees). The script should let you specify that you want to spin the image continuously. It should let you adjust the spin speed dynamically.
14.51 (Coloring Black-and-White Photographs and Images) Create a script that lets you paint a black-and-white photograph with color. Provide a color palette for selecting colors. Your script should let you apply different colors to different regions of the image.
14.52 (Vacuuming Robot) Start with a blank canvas that represents the floor of the room. Add obstacles such as a chair, couch, table legs, floor-standing vase, etc. Add your vacuum-cleaning robot. Start it moving in a random direction. It must avoid obstacles and must eventually vacuum the entire room. It has a known width and height. Keep track of which pixels have been “vacuumed.” Keep track of the percentage of the canvas that has been vacuumed and how much time it has taken.
14.53 (Eyesight Tester) You’ve probably had your eyesight tested several times—to qualify for a driver’s license, etc. In these exams, you’re asked to cover one eye, then read out loud the letters from an eyesight chart called a Snellen chart. The letters are arranged in 11 rows and include only the letters C, D, E, F, L, N, O, P, T, Z. The first row has one letter in a very large font. As you move down the page, the number of letters in each row increases by one and the font size of the letters decreases, ending with a row of 11 letters in a very small font. Your ability to read the letters accurately measures your visual acuity. Create an eyesight testing chart similar to the Snellen chart used by medical professionals. To learn more about the Snellen chart and to see an example, visit http://en.wikipedia.org/wiki/Snellen_chart.