
CHAPTER 3
Long Swings in Returns: Are We in a “New Normal?”
In 2009 after the financial crisis was beginning to abate, Bill Gross of PIMCO coined the term “New Normal” to describe the world of investing going forward.1 This is a world of half-size economic growth in the industrial world, painful deleveraging of the balance sheets of both governments and the private sector, and, as a result, disappointing bond and stock returns. It’s a depressing vision for younger investors trying to save for retirement. It’s a nightmare for retired investors trying to stretch their savings through retirement. Bill Gross is one of the most astute investors around, so his vision commands attention. Could it be that the long-run returns that we discuss in Chapter 2 are gone forever?
To try to answer that question, we need to understand the long swings in the returns on stocks and bonds that we have already experienced in the postwar period. It has been a very rocky ride for investors. There have been thrilling periods when investors rushed to open their investment statements. That was certainly true of the 1950s when stock markets soared. But it was also true of the two decades of the 1980s and 1990s. In other periods, market movements caused despair. Let’s try to make sense of those decades.
LONG SWINGS IN RETURNS
The performance of the U.S. economy has varied substantially over the past 60 years. The postwar boom was followed by the high inflation, low growth decade of the 1970s. Then the economy started a 20-year boom that ended with the recession of 2001. These long swings in economic performance helped to generate swings in bond and stock returns.
We might identify four cycles of stock returns in the postwar period: the postwar expansion, the inflation decade of the 1970s, the boom period of the 1980s and 1990s, and the bust period beginning in 2000 (which many observers call “the lost decade”). The timing of these four cycles is arbitrary, but some basis for the timing can be seen in Figure 3.1 and 3.2 where real returns on the S&P 500 are displayed.
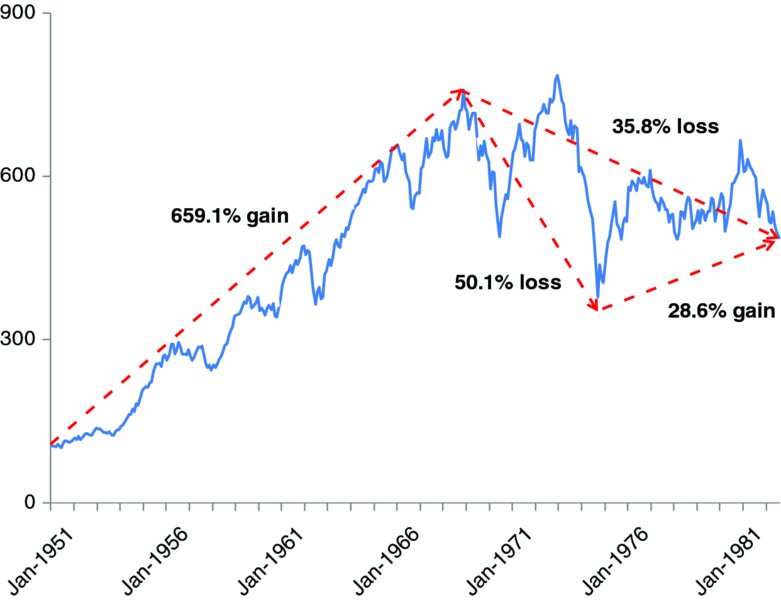
FIGURE 3.1 Real Return on S&P 500, January 1951 to July 1982
Data sources: © Morningstar, S&P Dow Jones Indices, and Bureau of Labor Statistics.
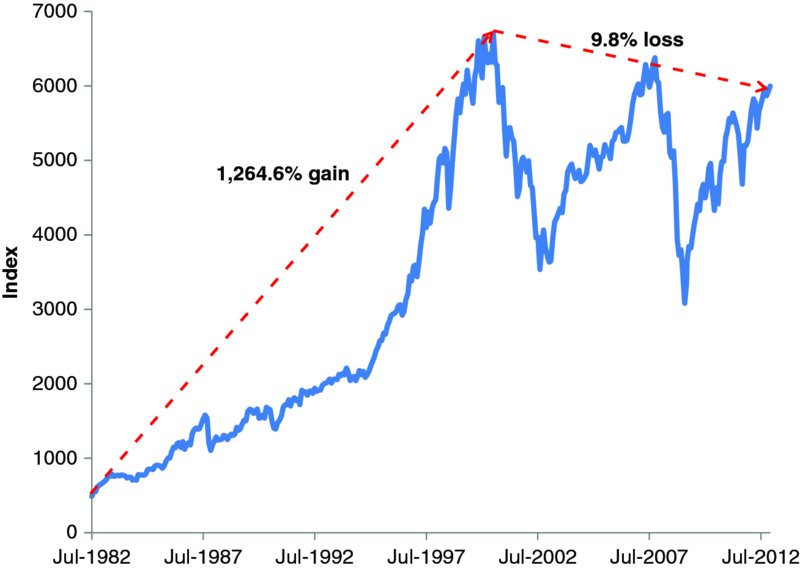
FIGURE 3.2 Real Return on S&P Dow Jones Indices, July 1982 to December 2012
Data sources: S&P Dow Jones Indices and Bureau of Labor Statistics.
Figure 3.1 suggests that the postwar expansion ended either in late 1968 or late 1972 (when returns were only marginally higher in real terms). During the period that ends in November 1968, the S&P 500 had a cumulative real return of 659.1 percent! That’s equivalent to a 12.0 percent return per annum. The subsequent period was a different story. The figure breaks up the period in two phases, Dec 1968 to September 1974 when the cumulative real return was –50.1 percent and October 1974 to July 1982 when the cumulative return was +28.6 percent. Over the whole period from Dec 1968 to July 1982, the cumulative return on the S&P 500 was –35.8 percent (in real terms) or –3.2 percent per annum. No wonder stocks fell out of favor during this period.
Figure 3.2 traces stocks over the subsequent boom period of the 1980s and 1990s. The S&P 500 earned an astounding 1268.6 percent compound real return over the 18 years from August 1982 to March 2000. That’s equivalent to a 15.9 percent per annum real return. Since 2000, however, stocks on balance have lost almost 10 percent in real terms through 2012. At the bottom of the latest bear market in March 2009, the cumulative loss was almost 50 percent.
Now let’s see just how well bonds would have fared over these same periods. Table 3.1 compares the real returns on the S&P 500 with those on the long-term (20-year) Treasury bond. The Treasury bond had negative real returns during the postwar boom period and during both of the inflation-ridden periods of the 1970s. In the postwar boom period ending in 1968 when stocks averaged a 12.0 percent real return, the Treasury bond had a small negative real return. And in the period from December 1968 to July 1982 when stocks were losing ground to inflation, Treasuries earned a cumulative real return of –37.8 percent for an annual return of –3.4 percent! Stocks and bonds, in fact, were equally miserable investments. The S&P 500 had an average annual real return of –3.2 percent. But bonds are supposed to be the safe haven for investors.
TABLE 3.1 Real Returns in Four Market Phases, 1951–2012
| S&P 500® | Long-Term Treasury Bonds | |||
| Dates | Cumulative | Per Annum | Cumulative | Per Annum |
| Jan. 1951–Nov. 1968 | 659.1% | 12.0% | –11.6% | –0.7% |
| Dec. 1968–July 1982 | –35.8% | –3.2% | –37.8% | –3.4% |
| Aug. 1982–Mar. 2000 | 1264.6% | 15.9% | 328.7% | 8.6% |
| Apr. 2000–Dec. 2012 | –9.8% | –0.8% | 111.2% | 6.0% |
| Whole Period | ||||
| Jan. 1951–Dec. 2012 | 5898.9% | 6.8% | 397.7% | 2.6% |
Note: The S&P 500 and long-term Treasury bond returns are deflated by the consumer price index.
Data sources: © Morningstar, S&P Dow Jones Indices, and Bureau of Labor Statistics.
Then in the 1980s and 1990s, Treasuries came alive. Bonds had splendid returns in the 1980s and early 1990s for a very simple reason. Inflation and bond returns fell over this period. Soon after Paul Volcker was first named to lead the Federal Reserve in 1979, the inflation rate started to recede from historic highs. That’s because Volcker and the Fed instituted a tough monetary regime aimed at sharply lowering the double-digit inflation that we were experiencing. Figure 3.3 shows how the inflation rate turned down sharply soon after Volcker’s policies began to take effect.
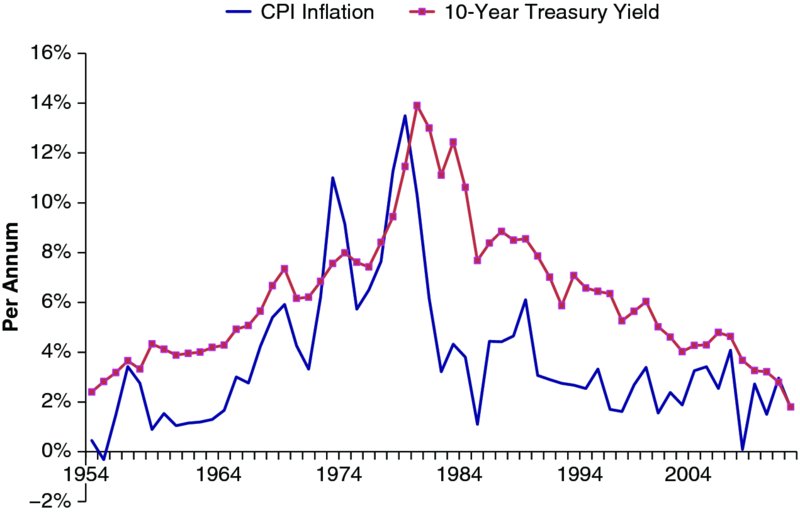
FIGURE 3.3 Inflation and Bond Yields, 1954–2012
Data sources: IMF, International Financial Statistics, and Bureau of Labor Statistics.
After Volcker succeeded in driving inflation to low single digits, bond yields stayed stubbornly high for a time. But eventually the bond market adjusted. The yields on newly issued bonds fell to reflect lower inflation, so the prices of existing bonds were bid up. As a result, bond returns soared. Investors in this market benefited whether they bought and held onto bonds with higher yields or sold out their bond positions after registering large capital gains. There was a once-in-a-lifetime capital gain on Treasuries (as well as most other bonds).
Paul Volcker ushered in a terrific period for bond investors. As Table 3.1 shows, the long-term Treasury earned an 8.6 percent annual return over the period from August 1982 through March 2000. Even so, Treasury returns paled in comparison with stock returns during this period. Stocks earned an average real return of 15.9 percent/year. Then when the stock market fell astray, Treasuries really started to shine. In contrast with a –9.8 percent return on the S&P 500, Treasuries have earned over 100 percent in cumulative return since 2000.
Some investors are hoping for high bond returns to continue indefinitely. But the driving force for these record real returns was the reversal of the same inflation that had undermined the bond market in the late 1960s and 1970s.
WERE YOU LUCKY ENOUGH TO INVEST DURING THE 1980S AND 1990S?
To maximize wealth at retirement, it is essential to be accumulating in decades when returns are high. That much is self-evident. Being lucky enough to invest in the 1980s and 1990s is surely a recipe for investment success. But it is also important to have saved enough by the time that high returns arrive. For example, investors who have $100,000 already in their accounts in 1981 will fare much better than those who start out saving in that year.
Let’s extend the experiment considered earlier where an investor saves $10,000 per year. This time we will examine how much the investor has accumulated after 30 years in both the bond market and stock market. So we imagine that the investor is retiring after 30 years of work and saving. We will consider different types of investors. At one extreme, an investor elects an all-bond portfolio throughout the accumulation years. At the other extreme, an investor elects an all-stock portfolio.
Before considering the specific results, we can guess how well the investor choosing an all-bond portfolio will fare in different periods. If the investor retires in 1980 after three decades of negative bond returns, he or she is not going to accumulate very much. Remember that a portfolio earning zero real return will deliver $300,000 after 30 years, since the investor is saving $10,000 per year. Because real bond returns were negative for the previous 30 years, a bond investor retiring in 1980 would have to retire with less than he or she saved—at least in real terms after adjusting for the cost of living. But what if the bond investor retired in 2010? An investor retiring in 2010 would have enjoyed the huge positive returns of the past three decades. Naturally, that investor would retire with a nest egg considerably larger than the $300,000 invested over time.
Stock investors also experience widely different fates depending on when they do their accumulation. If the investor retires in 2000, the investment pool has grown huge because of the outsized returns of the previous two decades. But pity the investor who retires in 2010. A decade of negative real returns is the recipe for a diminished retirement.
Table 3.2 gives the detailed results for these different investors. The table shows how much the all-bond investor and all-stock investor accumulates over 30 years depending on the date of retirement. For stock investors, the best results are found for the cohort who retires in 2000. Having saved $300,000 over time, these investors sit on nest-eggs worth over $1.8 million. Investors retiring one decade later in 2010, in contrast, accumulate only $847,800 by the time they retire. There are two reasons why they fare much worse. First, these investors only started saving in 1981, so they had fewer assets to benefit from the 9.0 percent return of the 1980s and 14.4 percent return of the 1990s. Second, the investors accumulating through the 2000s had to contend with negative real returns on stocks in that decade.
TABLE 3.2 How Much Does a Retiree Accumulate over 30 Years? Cumulative Wealth in Real Terms (Constant Dollars)
| Accumulation over 30 Years ($ thousands) | |||
| Retire in Year | All-Bond Portfolio | All-Stock Portfolio | |
| 1980 | $190.2 | $529.0 | |
| 1990 | $451.5 | $689.9 | |
| 2000 | $776.0 | $1,832.8 | |
| 2010 | $779.0 | $847.8 | |
Assumptions: Investor earns actual real return on Treasury bonds or S&P 500 in every year of accumulation period. Each year the investor contributes $10,000 to account (measured in constant dollars).
Data sources: © Morningstar, S&P Dow Jones Indices, and Bureau of Labor Statistics.
For bond investors, the glory days are found in recent decades. An investor retiring in either 2000 or 2010 would have accumulated almost $800,000 in wealth. That is far above what the poor bond investor saw in the three decades ending in 1980. The bond investor retiring in 1980 would have accumulated about $190,000 in real terms because rising inflation resulted in negative real returns. The $300,000 nominal savings was eroded by over one third!
What lies ahead for the bond investor? Is there a “New Normal” for that investor? And is there a “New Normal” for the stock investor? Let’s consider each type of investor in turn.
THE NEW NORMAL FOR THE BOND INVESTOR
The New Normal described by Bill Gross focused on stock returns, not bond returns. Low growth in the future would limit returns on stocks and other risky assets. As a result, investors would have to switch to a more conservative asset allocation mix with more bonds and stable blue chip stocks. An investment expert as successful as Gross demands respect for his views. But perhaps Gross should have also warned us about a New Normal for bonds. In my opinion, lower bond returns are more likely than lower stock returns.
Interest rates are difficult to forecast. Wall Street strategists and bond fund managers are paid big bucks to forecast the future. Yet even they do not know what interest rates will be in a year’s time or over the next few years. It’s undoubtedly easier to think further into the future to predict interest rates, and therefore bond returns.
Let me begin by describing two extreme scenarios for the bond market: (1) yields stay low and (2) rising rates.
Yields Stay Low
In early 2013, interest rates are near all-time lows. Perhaps they will stay low for a prolonged period of time. After all, the U.S. economy has been growing quite slowly since the beginning of the recovery in June 2009. In the meantime, the Federal Reserve has pumped an enormous amount of liquidity into the financial system to keep interest rates low. In this scenario, investors will have to be content with miserably low bond returns. If interest rates stay low, the return on a bond will be equal to the yield itself. Consider the return on a 20-year Treasury bond. In early 2013, the yield on this bond was a little below 3 percent. With inflation almost as high as the bond yield, investors are barely treading water in real terms. Those saving for retirement in a bond-only portfolio have stagnant portfolios. Those living off bonds in retirement are draining their reserves. This scenario is a cruel one for investors.
We cannot rule out a scenario where interest rates stay low because we have witnessed such a scenario in another industrial economy, Japan. For most of the past 20 years, Japanese interest rates have remained severely depressed despite efforts by the Japanese government and Bank of Japan to stimulate the economy following the collapse of its stock market and real estate market.2 The Japanese government has run up record fiscal deficits resulting in a debt/GDP ratio over 200 percent (the highest in history). The Bank of Japan has supported this policy by keeping short-term interest rates low. Despite these efforts, Japanese growth has remained sluggish, and Japanese long-term interest rates have remained painfully low. Perhaps U.S. interest rates will follow Japanese patterns.
Rising Rates
There is a worse possibility facing U.S. investors. Interest rates could rise toward normal levels. What is a normal level for U.S. interest rates? Figure 3.3 shows that there is no “normal” level for nominal bond yields. They rise and fall with inflation rates. Real yields also vary over time, though not as much as nominal yields. But in the long run, average real yields are quite stable. Since 1951, the 20-year bond yield has averaged about 2.5 percent after adjusting for inflation. That’s also true of the period extending back to 1926. What if real interest rates were to rise back to normal? The nominal yield depends on the inflation rate, which itself is difficult to forecast. But let’s imagine that in the long run inflation settles at 2.5 percent. (This may be more a wish than a forecast given how much monetary stimulus the Fed has produced since the financial crisis began). Then the nominal yield on a 20-year Treasury bond should eventually rise to 5 percent or so. That is not a pretty picture. It means that bond yields will have to rise by 2 percent or more in the future. During the period when bond yields rise, bond returns may at times be negative, at least in real terms.
So there is a plausible case for a “New Normal” for bonds. At least investors should expect the end to the wonderful bond returns of the past 30 years. The bond party has lasted for that long. It may go on for a while longer, but we are running out of champagne and the partygoers are thinking about when to depart. In Chapter 16 we will discuss what this means to current retirees. That chapter discusses various ways for retirees to find income in today’s investment market. Retirees will have to be very careful about the maturity of their bond investments. The longer the maturity of a bond, the more vulnerable it is to increases in interest rates. On the other hand, the yields on shorter-term bonds are pitifully low. So the retiree has to choose between income and safety. Long-term Treasury bonds as well as private sector bonds will suffer if bond yields rise. The “New Normal” presents a bleak future for bond investors.
THE NEW NORMAL FOR THE STOCK INVESTOR
Since 2000, the U.S. stock market has delivered zero returns or less to investors. This has truly been a “lost decade.” Writing in March 2013, the S&P 500 is barely above its level in March 2000. In delivering near-zero nominal returns (and negative real returns), the market has forced investors on a rollercoaster ride of two deep dips followed by two exhilarating rallies. The thrill has been lost on investors as they earned nothing for all the volatility. Perhaps we have already begun the “New Normal” for stocks.
Bill Gross chose to announce the “New Normal” at an inopportune time. Indeed, his timing was awful. He announced the new normal just two months after the market reached its bottom. Since March 2009, the U.S. stock market as represented by the S&P 500 has rallied over 100 percent. This is not as surprising as it seems because the stock market always rallies during a business cycle upturn. And by March of 2009, the “worst financial crisis since the 1930s” had turned into an ordinary recession (though admittedly a bad one). That’s because of the quick action by the Treasury and Federal Reserve in the fall of 2008 after Lehman Brothers failed. This book is not the place to recount the events of that stressful period. But by the spring of 2009 it was clear that the worse had passed. The S&P 500 reached its bottom on March 9, 2009. We would learn later that the recession ended in June 2009.3
When the U.S. economy falls into recession, it eventually recovers. Once it recovers, the rally in the stock market is usually quite substantial. Table 3.3 examines the rise in the S&P following each of the nine recessions since 1951. In each case, the stock market rallied strongly as the economy recovered. In all but one case, the rally began before the recession had actually ended. For example, the last recession ended in June 2009, yet the market reached bottom on March 9, 2009, three months before the recession ended. Market participants evidently anticipated the end of the recession and the sharp gain in corporate profits that would occur as the economy rebounded. So in some sense, the stock market has been behaving recently as it normally does.
TABLE 3.3 S&P 500 Rallies after Recessions, 1951–2012
| Recession Months (NBER dating) | Market Bottom | Gain in First 12 months |
| July 53–May 54 | Sept. 53 | 46.0% |
| Aug. 57–Apr. 58 | Dec. 57 | 43.4% |
| Apr. 60–Feb. 61 | Oct. 60 | 32.6% |
| Dec. 69–Nov. 70 | June 70 | 41.9% |
| Nov. 73–Mar. 75 | Dec. 74 | 37.3% |
| July 81–Nov. 82 | July 82 | 59.3% |
| July 90–Mar. 91 | Oct. 90 | 33.5% |
| Mar. 01–Nov. 01 | Feb. 03 | 38.5% |
| Dec. 07–June 09 | Mar. 09 | 49.8% |
Note: The market trough is determined by the lowest monthly average of daily prices for the S&P 500 price index.
Data sources: The S&P price data is from Robert Shiller’s website, www.econ.yale.edu/∼shiller/data.htm. The S&P 500 gain is based on the total return on the S&P (including dividends) from SBBI Ibbotson 2013 (© Morningstar).
Yet investors are interested in the future, not the past. Even though the stock market has enjoyed a classic cyclical rally, this does not deny the possibility that returns in the future may disappoint investors. Ultimately, stock returns depend on profitability of firms within an economy. If the U.S. economy grows in the future, stock returns will follow. This is not to say that growth and stock returns follow closely one another. Surely stock returns in the 1990s exceeded growth or any prospects for growth in the U.S. economy. Price-earnings ratios rose sharply in that decade. Conversely, the negative stock returns of the decade ending in 2010 occurred despite substantial growth in corporate earnings per share. Earnings per share in the last decade (2001 to 2010) were 55 percent higher than earnings in the 1990s. Yet stocks stagnated.
One view of this lost decade is that we are giving back the returns of the 1980s and 1990s. At the end of 1999, the average real return on stocks measured from 1951 to 1999 was a surprisingly high 8.9 percent. The long-run average had been driven upward by two decades of incredible stock returns. The average measured through 1999 was way above the average real return of 6.4 percent measured from 1951 to 1980. And it was way above the average real return from 1926 to 1950 of 6.3 percent. The lost decade has brought the long-run averages almost back to where they were in 1980. By 2012, the average return measured from 1951 was back to 6.8 percent. So we have spent 12 years reverting to the mean! If this is the case, then there is little reason for pessimism about stocks. According to this interpretation, we are near the end of a decade-long period of adjustment. So going forward, stock returns will behave more normally than in the last decade or so.
An alternative view is based on current valuations of the stock market. We could look at current price-earnings (or P/E) ratios, either based on recent earnings or projected future earnings. Since projected earnings are subject to many revisions, let’s consider price-earnings ratios based on the previous year’s reported earnings. Since 1951, this P/E measure has averaged 17.9. At the end of 2012, the P/E was 16.2. So by this measure of valuation, the stock market appears to be reasonably valued.4
An alternative price-earnings measure has been developed by Robert Shiller (2000). Shiller makes two changes to conventional P/E measures. First, he measures the past 10 years’ earnings in order to iron out sharp cyclical changes in earnings. Second, he adjusts both prices and earnings by inflation (necessary because 10 years of earnings are being measured).
The result is shown in Figure 3.4. Notice how overvalued the market looks in the late 1990s. Two sharp corrections in 2000–2002 and 2007–2009 have brought the P/E ratio down to about 22 in early 2013. Comparing current ratios to the average since 1951 (18.8), the market appears to be at least 10 percent overvalued. If this analysis is right, then stock market investors face additional pain as valuations adjust back toward their long-run averages. And there is no guarantee that P/E ratios will not overshoot in the downward direction.
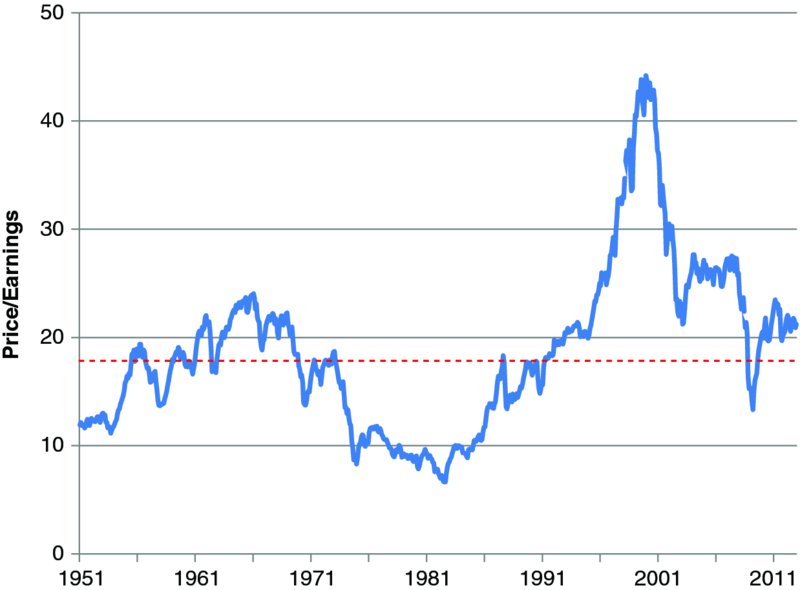
FIGURE 3.4 Price/Earnings Ratios for S&P 500, 1951–2012
Data source: www.econ.yale.edu/∼shiller, described in Shiller 2000.
But Bill Gross may be foreseeing even bleaker times for the stock market. If U.S. growth remains depressed in the future, earnings will not grow as rapidly as in the previous 60 years. Stock returns may disappoint investors because U.S. growth is no longer as rapid as it used to be.
WHAT CAN INVESTORS DO?
The New Normal for bond investors is almost a sure thing. The only uncertainty is about which bad scenario we will face. In the most optimistic scenario, bond yields remain low and inflation is high enough to reduce real returns to zero or less. So savers cannot look to capital appreciation as they try to accumulate wealth for retirement. And retirees will be barely treading water. A more pessimistic scenario involves bond yields rising so bond returns may turn negative. In that case both savers and retirees suffer even more.
A New Normal for stock investors is harder to predict. The conventional measure of price-earnings suggests that the “lost decade” may be over. The evidence based on Shiller’s P/E analysis instead indicates that the near-term outlook for stocks is unpromising. That’s especially true because we have already been through the rebound in stocks that normally follows a recession. The New Normal suggests that lower stock returns will be experienced even after any further valuation adjustments occur.
Investors cannot control what happens to bond and stock returns. If investors believe in a New Normal, it means they have to work even harder to make sure that they are saving enough for retirement. And they have to make sure that the investing they do is as sure-footed as possible. The bleaker is the future outlook for investing, the more they have to pay attention to the investment plan. Unlike the investors of the 1980s and 1990s, investors of today cannot afford the luxury of mistakes in saving and investing. In Chapters 4 and 5, we will consider how the New Normal may affect required rates of saving. And in Chapters 16 through 19, we will consider how the New Normal may lower how much a retiree can safely spend in retirement.
NOTES
REFERENCES
- Shiller, Robert J. 2000. Irrational Exuberance. Princeton, NJ: Princeton University Press.