CHAPTER 9
Emerging Markets
Emerging markets” may be one of the best marketing phrases ever devised. The phrase seems to describe markets that hold a lot of potential for future economic growth and the promise of future returns for investors. Since this phrase is usually attached to national markets where income is relatively low, a more accurate description would be “the markets of less developed countries.” Some countries will have great potential for growth and may actually be growing quite rapidly. Other countries, however, may have either little growth or actually be stumbling backward. Argentina might be a good example of the latter. Its economy has been run so badly in recent years that it has been demoted by the MSCI database from “emerging market” status to a lower-level “frontier market” status.
The investment industry tends to focus on the success stories. In the past few decades, China has captured the imagination of investors with its rapid economic growth fueled by the export of manufacturing goods. Just a couple of decades earlier, South Korea and Taiwan had excited investors for much the same reason. The success of other countries has rested less on manufacturing than on services (India) or commodities (Russia, South Africa, and Brazil). All share one characteristic that interests investors, their potential for good investment returns due to their high rates of economic growth.
This chapter will show that at times emerging markets have provided handsome returns for international investors, especially over the past decade. But the record of returns is uneven, to say the least. In the 1990s attention was focused on East Asian growth, but in 1997 many currencies in East Asia suddenly collapsed in what was later termed the “Asian crisis.” Three years prior, Mexico suffered a sharp devaluation of the peso. And one year later Russia defaulted on much of its government debt. Yes, emerging markets are sometimes turbulent.
WHAT IS AN EMERGING MARKET?
How is an “emerging market” defined?1 The World Bank traditionally used one criterion, gross national income per person or “per capita.” Any country that was classified by the World Bank as a low-income or middle-income country was also classified as an “emerging market.” In 2012, China had a total gross national income of $7,749 billion, but a per capita income of only $5,740. Singapore, in contrast, had a gross national income of $251 billion, but a per capita income of $47,210.2 So China is classified as an emerging market even though its total output was many times that of Singapore because its income per capita is so low.
The bulk of the world’s income is earned by the high-income countries. Figure 9.1 shows the division of the world’s gross national income (GNI) in 2012.3 Only 36.8 percent of GNI is earned by the emerging market countries even though they represent about 85 percent of the world’s population. The developed countries dominate world output and world income. Western European countries (including the euro area and other European industrial countries like the United Kingdom) produce 25.5 percent of world income and the United States another 23.4 percent, while the other developed countries of the world including Japan make up the rest.
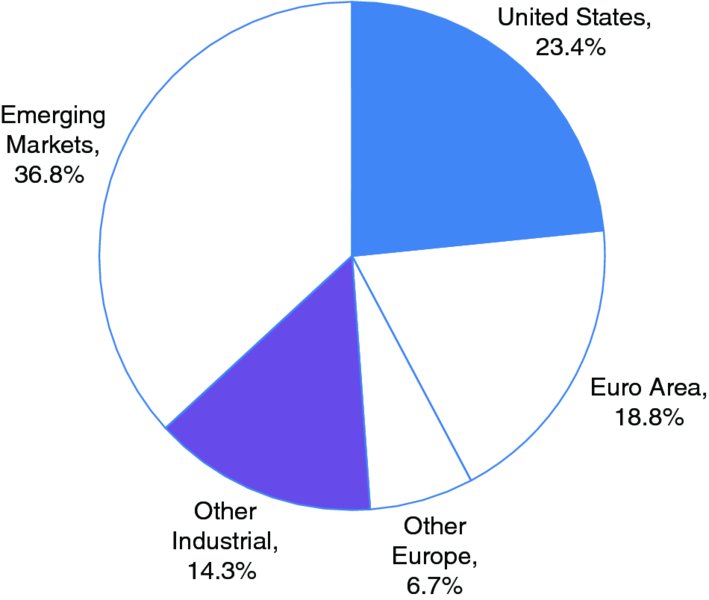
FIGURE 9.1 World Gross National Income in US$, 2012
Source: World Bank, World Development Indicators Database, 2013.
Figure 9.2 breaks out the GNI of the five largest emerging market countries. China has the largest economy of any emerging market with a GNI larger than all but one of the developed countries (the United States). With its rapid growth over the last two decades, China’s economy is now larger than that of Japan, the next largest industrial country. China is one of the four “BRIC” countries highlighted in discussions of economic development, the others being Brazil, Russia, and India. All four of these countries are among the five economies shown in Figure 9.2. As shown later, the ranking of these five countries would be very different if adjusted for population size. China’s huge GNI must be shared by a huge population.
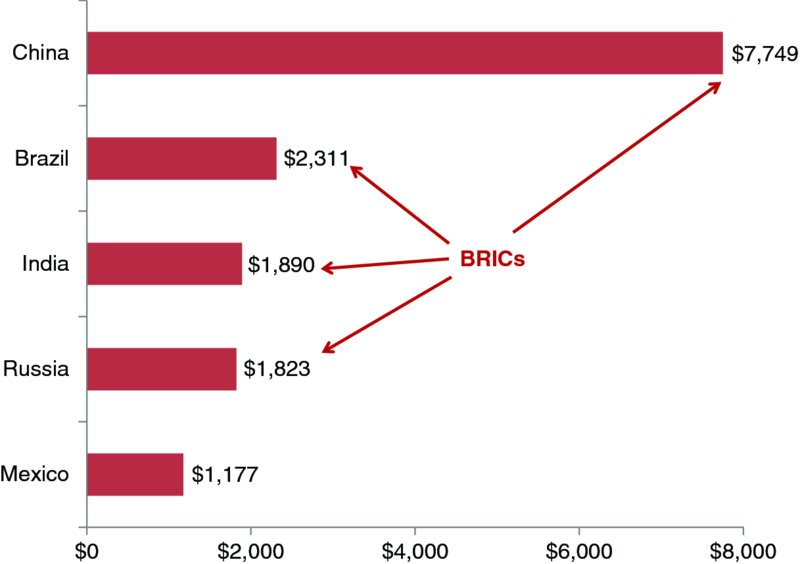
FIGURE 9.2 Gross National Income of Largest Emerging Market Countries, $Billions in 2012
Source: World Bank, World Development Indicators Database, 2013.
When measuring national income, it’s sensible to adjust for the cost of living. That is certainly true within a single country over time. If you want to measure the income of the average American today relative to decades ago, the only sensible way to measure income is to adjust for changes in the cost of living. So we might compare gross national income per capita in the year 1960 versus that of 2012 by adjusting income in 1960 by the lower cost of living in that year. A similar approach might be used in comparing GNI per capita between countries at the same time since there might be substantial differences in the cost of living across countries. A basket of goods might be much less expensive in China than in Japan because prices are so much lower in China than in Japan.
The World Bank and other international agencies adjust the GNI of a country by the cost of a common market basket in that country. The results follow a consistent pattern. Less developed countries have lower costs of living than industrial countries. So the “adjusted” GNI per capita of the less developed countries tends to be larger than the unadjusted GNI. In the case of the industrialized countries, the reverse is true. The adjusted GNI of these countries tends to be smaller than unadjusted GNI.
Figure 9.3 presents the GNI per capita of the five largest emerging market economies using two measures of national income. One measure, labeled “unadjusted,” simply converts the GNI per capita of a country into dollars using recent exchange rates.4 The second measure, called the PPP or purchasing power parity measure, adjusts for the cost of living. The results are quite striking. China’s GNI per capita is only $5,740 when measured at current exchange rates. But when it is adjusted for the low cost of living in China, GNI per capital rises to $9,210. Similarly, Mexico’s GNI per capita is only $9,740 when measured using current exchange rates, but it rises to $16,680 when adjusted for the cost of living.
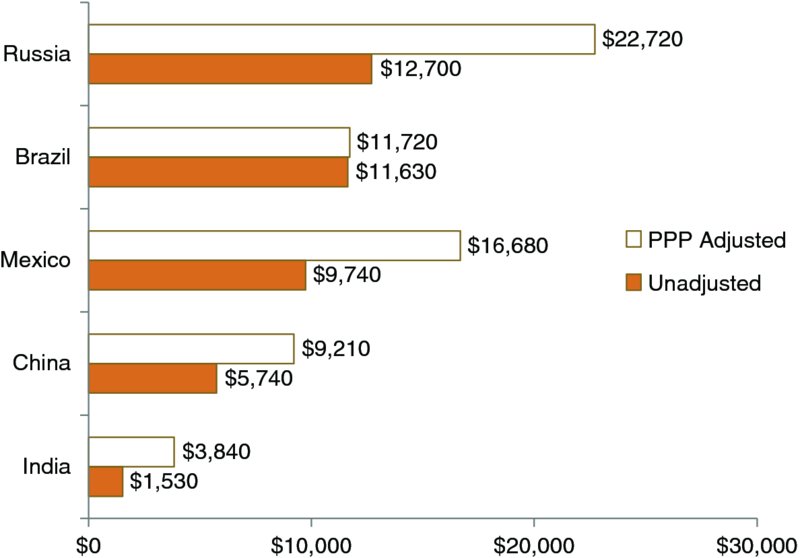
FIGURE 9.3 GNI Per Capita, Actual, and Adjusted for Cost of Living, 2012
Source: World Bank, World Development Indicators Database, 2013.
To give some perspective on these GNI figures, consider the GNI per capita of some of the major industrial countries. France has a GNI per capita of $41,750 using current exchange rates and $36,720 after adjustment for the higher cost of living in France. The United States has a GNI per capita of $50,120 at current exchange rates and $50,610 after adjustment.5 The gap between the incomes of emerging markets and industrial economies is wide indeed.
EMERGING STOCK MARKET INDEXES
Emerging stock markets represent 25.5 percent of the world’s stock market capitalization of $46.8 trillion. So a block of countries with about 37 percent of the world’s national income hosts about one-quarter of the world’s stock market capitalization. The bulk of the market capitalization is found in the developed countries with the U.S. stock market representing a little over 33 percent of the total.
The emerging stock markets are divided along regional lines in Figure 9.4. East Asia provides the largest block in terms of capitalization. This region consists of all markets between Indonesia and China except for Singapore and Hong Kong (the latter being measured independently of China). South Asia includes India which accounts for most of the region’s market value. (East Asia and South Asia are combined in the “Asia” region in some of the statistics below). The Middle East and Africa region includes two relatively large emerging stock markets, South Africa and Saudi Arabia.
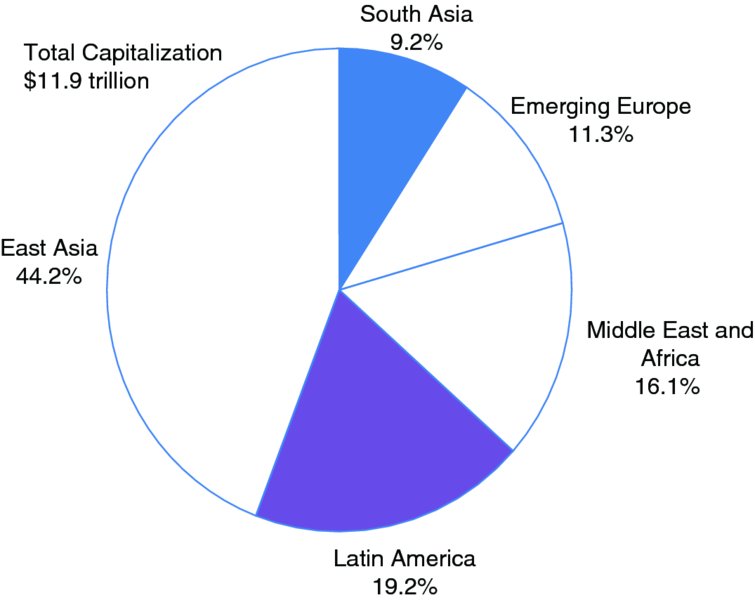
FIGURE 9.4 Stock Market Capitalization of the Emerging Markets
Source: S&P Global Stock Markets Factbook, 2012.
These measures of market capitalizations may be misleading if we are interested in stocks that are actually available to the international investor. Not all shares issued by a firm are available to ordinary investors of that country, and even fewer are available to residents of other countries. There are several issues to sort through. First, some shares may be owned by the government or closely held by other investors. For example, firms in the same industrial group can cross-hold each other’s shares. Second, some or all shares of a firm may be off-limits to foreign investors. Most foreign investment restrictions have been removed by developed countries, but such restrictions are widespread in the emerging countries.
To illustrate how different emerging markets look if we consider only investable indexes, consider Table 9.1, which compares actual (total) market capitalization for the emerging markets with the weights of the same regions or countries adopted by MSCI in its “investable” indexes. China has a 36.3 percent weight in the total market capitalization of the emerging markets, but only a 17.9 percent weight in the MSCI investable index. In contrast, South Korea and Taiwan represent only 11.1 percent of the total market capitalization, but they represent 24.1 percent of the MSCI investable index. (South Korea remains in the emerging market category in the MSCI database even though Standard & Poor’s has elevated it to developed country status in the Global Stock Markets Factbook).6 China has many stocks that are off-limits to foreigners or stocks that are only partially accessible to foreigners. Korea and Taiwan are much more open to foreign investors (even though their markets used to be subject to multiple restrictions).
TABLE 9.1 Emerging Market Capitalization Compared with MSCI Weights
| Markets | Actual Market
Capitalization, 2009 |
MSCI Weights, 2009 |
| China | 36.3% | 17.9% |
| Korea and Taiwan | 11.1% | 24.1% |
| Rest of Asia | 13.8% | 13.8% |
| Brazil | 8.5% | 16.9% |
| Rest of Latin America | 6.1% | 6.9% |
| Europe, Middle East, and Africa | 24.3% | 20.4% |
Sources: S&P (2010) for actual market capitalization, MSCI Barra (2009) for MSCI weights.
Because the investable universe is so different from the total emerging market universe, it’s imperative for investors to use proper benchmarks for evaluating emerging market managers. Performance should be judged relative to the MSCI indexes, not relative to the broad stock market indexes of a country or region. Shanghai’s stock market may have soared 20 percent over a particular period, but that does not mean that the investable indexes tracked by American investors have soared that much. They may have risen more or less than the Shanghai index.
Table 9.2 provides some interesting details about the MSCI Emerging Market Stock Index as reflected in the iShares ETF. The largest countries are given on the left of the table and the largest firms on the right. China is the largest market in the index, but notice that South Korea is almost as large despite having a much smaller economy. (The gap between China and the other countries would be larger if we looked at all shares rather than just shares “investable” by foreigners as measured by MSCI.) The list of largest firms includes two mobile phone operators (China Mobile and America Movil), two electronics firms (Samsung and Taiwan Semiconductor), a mining firm (Vale SA), and three oil firms (Gazprom, Petrobras, and CNOOC).
TABLE 9.2 MSCI Emerging Market Index
| Largest Countries | Market Share | Largest Firms |
| China | 17.8% | Samsung (South Korea) |
| South Korea | 15.2% | Taiwan Semiconductor (Taiwan) |
| Brazil | 12.6% | China Mobile (China) |
| Taiwan | 10.6% | China Construction Bank (China) |
| South Africa | 7.8% | Gazprom (Russia) |
| India | 6.6% | Indus & Com Bank of China (China) |
| Russia | 6.0% | America Movil (Mexico) |
| Mexico | 5.1% | Vale SA (Brazil) |
| Malaysia | 3.5% | Petrobras (Brazil) |
| Indonesia | 2.6% | CNO Oil Company (China) |
Source: iShares.com, February 2013.
EMERGING STOCK MARKET RETURNS
Emerging markets tend to be volatile and crisis-prone. But before examining the risks of investing in emerging markets, let’s consider the returns earned in the past. The data sets for emerging market stocks do not extend back as far as those of developed countries. There are indexes for individual countries that extend back into the 1970s, but the broad indexes begin in the late 1980s. As in the case of the stocks of industrial countries, MSCI provides stock market indexes for the emerging markets that are widely used as benchmarks for emerging market funds. These indexes start in 1988. There is a composite index for the emerging markets consisting of 21 emerging markets including five from Latin America, eight from Asia, and five from Europe and the Middle East. There are also regional indexes. The Latin American emerging market consists of Brazil, Chile, Colombia, Mexico, and Peru. The Asian index consists of China, Indonesia, India, Korea, Malaysia, Philippines, Taiwan, and Thailand. The Europe and Middle East index consists of Czech Republic, Hungary, Poland, Russia, and Turkey.7
Table 9.3 examines returns on the composite index for the emerging markets as a whole as well as regional emerging market indexes. The table compares emerging market returns with those of the S&P 500 and the MSCI EAFE developed country indexes. Let’s summarize the four broad patterns:
- Emerging market stock returns as a whole exceed those of the S&P 500 and far exceed those of the MSCI EAFE index. Recall that the EAFE index suffered badly from the collapse of Japan beginning in 1990. So any comparison that begins in the late 1980s is bound to show EAFE in a bad light.
- Over the whole period, emerging market Asia was a disappointment to investors. Returns beginning in 1988 fall far short of the emerging market index as a whole. The reason for this poor performance will be examined below.
- The Latin America index earns extraordinary returns during this period. No doubt the period studied matters here. Latin America suffered a “lost decade” in the 1980s because of the Latin American debt crisis that began in 1982. From low levels Latin American stock markets (as a whole) have risen sharply.
- The Europe and the Middle East index has also lagged far behind Latin America.
TABLE 9.3 Emerging Market and Developed Market Stock Returns, 1988–2012
| Market | Average Return |
| Emerging Markets | |
| MSCI composite | 12.7% |
| Asia | 8.4% |
| Latin America | 19.4% |
| Europe and Middle East | 8.7% |
| Developed Markets | |
| S&P 500 | 9.7% |
| MSCI EAFE | 5.5% |
Data sources: MSCI and S&P Dow Jones Indices.
As shown in Table 9.3, returns for the Asian region are much lower than those for the other regions as well as emerging markets as a whole. This is a true puzzle because Asia has grown faster than any other region in the world. The largest emerging market economy, China’s, has had double-digit growth for much of the period. Shouldn’t growth translate into high stock returns? It turns out that the answer is “not necessarily.” The evidence is that many emerging market countries that have high growth rates actually have lower stock returns than those with lower growth rates.8
Economists do not have a good explanation for why there is no positive relationship between economic growth and stock returns. The economic causation should go from high economic growth to high firm profits to high stock returns. There could be a break in the chain if high expected profits have already priced stocks in that country relatively high. Think of Japan in the 1980s when future growth and future profits appeared to have no upper limit, so price-earnings ratios were sky high. There could also be a break between high growth and high profits. Certainly Soviet Russia had high growth (at least in the 1950s and 1960s), but were profits in this state-controlled economy high? (By profits we mean economic profits since all large enterprises were state owned). In any case, the automatic assumption on Wall Street that a fast-growing country or region will deliver high returns seems unwarranted at best.
To investigate the peculiar case of China in more detail, consider the returns on Chinese stocks beginning in December 1992 (when the MSCI China series begins) through 2012. The average return on China’s investable index is 0.0 percent per year from 1993 through 2012. It is hard to believe that an economy growing as fast as China’s could deliver such paltry returns. The MSCI Asia index performed much better than the China index with a positive return of 5.9 percent/annum over the same period. But over the same period, the S&P 500 index earned 7.4 percent per annum. It’s important to note that the returns just cited are “investable” returns, so they record what an average foreign investor would earn in these markets. Growth evidently does not reward all investors.
China, however, did have a terrific run late in the period. For the two years prior to the peak of its market in October 2007, the MSCI China index had a return of 306.4 percent! No wonder investors were rushing into this market. From that peak, the Chinese index fell 64.8 percent through October 2008. Through December 2012, it has again risen spectacularly by 98.2 percent. It has been quite a roller coaster ride. The key question is whether China’s recent stock market performance is more indicative of the future than the full record of returns since 1992. China will no doubt remain volatile. But will it deliver more than the paltry returns seen on average since December 1992?
RISKS OF INVESTING IN EMERGING STOCK MARKETS
Emerging market stocks are inherently risky. Using one common measure of volatility, the standard deviation, emerging market stocks are two thirds more risky than U.S. stocks and almost one third more risky than foreign industrial country stocks. But these conventional measures of volatility may underestimate the risks of emerging market stocks because these markets are so prone to crises.
Consider an investor trying to make decisions about emerging market stocks in early 1997. At that time, there were only nine years of data from the MSCI database. Over the nine years ending in 1996, the compound return on the Asian Emerging Market Index was 16.6 percent per annum. It’s true that over the same period, the S&P 500 offered equally hefty returns of 16.5 percent per year. But the correlations between emerging markets and U.S. stocks were low enough to justify large allocations to emerging market stocks.
In early 1997, few investors realized that Asian markets were about to be hit by a financial tsunami that would drive many markets down by 75 percent or more. The crisis first hit the Bangkok foreign exchange market in early July 1997 when the Thai central bank was forced to float the Thai baht. The value of the baht was cut in half almost immediately (with the dollar initially rising against the Baht from Bt 25/$ to Bt 50/$).
The collapse of the baht soon set off speculation against the Malaysian ringgit, the Indonesian rupiah, the Korean won, and other Asian currencies. Why was there such widespread contagion? The most important reason is that firms in all of these countries had loaded up on dollar debt and other foreign currency debt. Once rumors of depreciation spread in the market, these firms rushed to hedge their foreign currency liabilities, which had the effect of driving down their currencies. If a fire breaks out in a ballroom, every one heads to the exits at the same time.
Stock market investors suffered grievously. The Asian emerging markets as a whole returned—32.1 percent per annum in 1997–98. The stock markets of Thailand, Malaysia, and Korea all fell by 60 percent or more (in dollar terms). The contagion even spread to Latin America where markets fell 7.6 percent per annum over the two-year period. Within a few years afterward, emerging markets as a whole had recovered most of their lost ground. But in the case of the Asian stock markets, the index return per annum over the whole period from 1988 to 2012 is still over 8 percent per annum below what it was at the end of 1996!
The Asian crisis is not an isolated incident. Other markets have been prone to crisis. Consider three other important examples: Mexico in 1994, Russia in 1998, and Argentina in 2000–2002.
- The Mexican crisis was precipitated by a currency collapse just as in the case of Thailand. In December 1994 following the inauguration of President Ernesto Zedillo, the peso depreciated from Ps 3.5/$ to Ps 7.0/$. The depreciation led to widespread bankruptcies among Mexican firms (including major banks) because so much debt was denominated in dollars. The impact on the stock market was dramatic. The Mexican market fell by 60 percent (in dollar terms). It took several years for the Mexican economy to recover from this disaster.
- The Russian crisis involved a default by the Russian government on its debt rather than currency depreciation. The Russian stock market began a dramatic decline a year before the actual default, which occurred in July 1998. Between September 1997 and a year later, the Russian stock market declined (in U.S. dollar terms) by over 80 percent. The bond default itself precipitated a fall in many bond markets worldwide.
- The Argentine crisis began as early as 2000 when the long-established peg to the U.S. dollar began to be seriously questioned. In January 2002, Argentina was forced to float its currency and put controls on financial outflows. By that time, the stock market had already plummeted. From February 2000 until June 2002, a few months after the crisis, the Argentine market fell over 80 percent in dollar terms.
Even in the absence of specific crises, these markets tend to be highly volatile. Consider the example of China once again. China’s stock market is like a roller coaster. In the two years starting in December 1993, China’s market fell 58 percent. It recovered most of this ground by 1997, but in August 1997 it fell sharply again as the Asian crisis hit. Within a year, the Chinese market had fallen by almost 80 percent (measured in dollar terms). Investors must be prepared for volatility if they invest in these markets.
Prior to the 2008 crisis, emerging markets returns soared over 85 percent from December 2005 to December 2007. So it has been hard to convince investors of the risks of investing in emerging market stocks. Of course, the plunge by 53 percent in 2008 may help.9
SO WHY INVEST IN EMERGING MARKETS AT ALL?
Investors remain excited about emerging markets despite past episodes of crises and market plunges. One reason is that these markets have done so well recently. Investors seem to pay a lot more attention to recent returns than longer records of past returns. Why else would investors be excited by commodities and, in particular, gold as an investment? But another reason is the inherent belief that high growth will eventually reward investors. Most experts believe that emerging market economies will grow faster than the tired, old industrial economies of Europe, Japan, and the United States, with their aging populations and debt-ridden governments.
Let me not stand in the way of this excitement. After all, the previous section has already warned investors about the risks of emerging markets. In fact, the emerging markets have come alive in recent years. The catalyst, if you believe in magic, was a speech by Jim O’Neill of Goldman Sachs in November 2001 that introduced the term “BRICs” standing for Brazil, Russia, India and China. Shortly after O’Neill’s speech, BRIC returns started to soar. But so also did the returns on emerging markets in general.
Figure 9.5 presents the returns in the four BRIC countries as well as emerging markets as a whole. The chart divides returns into two periods: 1995 to 2001 and 2002 to 2012.10 For the seven years of the first period, only Russia provides attractive returns for investors. China loses 16.8 percent per year over this period, and the emerging markets as a whole lose 4.1 percent per year.
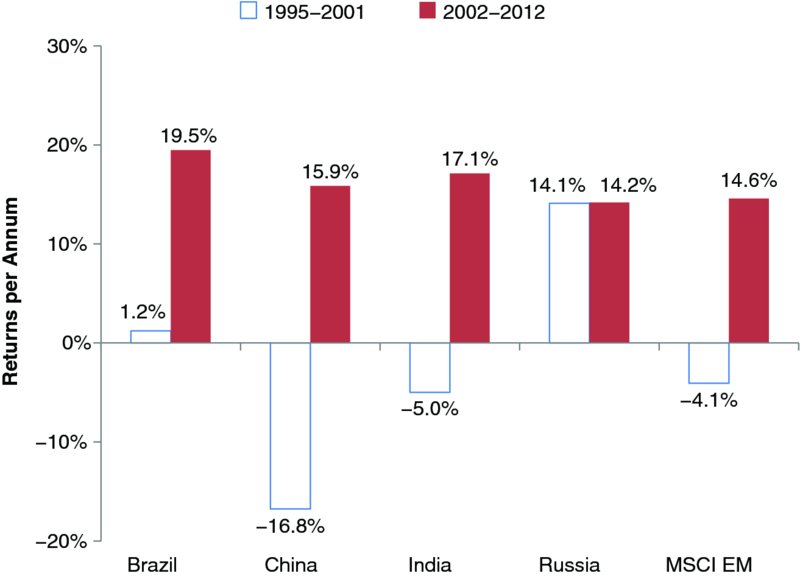
FIGURE 9.5 Returns in the BRIC Countries and Emerging Markets as a Whole
Data source: MSCI.
Once the BRICs are introduced, however, the whole emerging markets sector comes alive. For the 11 years ending in 2012, the average return in the emerging markets is 14.6 percent. And in Brazil, the top performer among the BRICs, the average return is 19.5 percent. No wonder the term BRICs has caught on so well.
Here is the crucial question facing investors: Now that the emerging markets have begun to fulfill their promise, will they continue to thrive? Are we justified in believing that their higher growth rates (compared with those of the industrial countries) will be translated into higher stock returns? One leading investor believes so. In the annual report of the Yale Endowment, David Swensen and his staff always provide estimates of investment returns that Yale expects to receive in the future. The horizon is not measured in years, but decades (as is appropriate for an endowment that has been around for centuries). In the latest report, Swensen estimates that emerging market stock returns will be 1½ percent higher than those in the United States and the other industrial countries. Given the prospect of higher returns, it may make sense for even ordinary investors to have an allocation to emerging market stocks.
CONCLUDING COMMENTS
The world’s stock markets are divided into developed and emerging for a good reason—emerging markets are riskier. The dividing line between the countries themselves is somewhat arbitrary, but the division between the assets of these two sets of countries is a meaningful one. Consistent with higher risks, emerging market stocks have delivered stellar returns, especially during the last decade, and promise higher returns in the future.
NOTES
REFERENCES
- Marston, Richard C. 2011. Portfolio Design: A Modern Approach to Asset Allocation. Hoboken, NJ: John Wiley & Sons.
- MSCI/Barra. 2009. MSCI Market Classification Framework (June).
- Standard & Poor’s. 2010 and 2012. Global Stock Markets Factbook. New York: McGraw-Hill.
- World Bank, World Development Indicators Database. 2013. www .worldbank.org.
