
CHAPTER 2
The Building Blocks of a Portfolio: Bonds and Stocks
Investors can invest in a variety of assets from bank deposits to real estate. But it’s best to begin a discussion of investment returns by studying two basic assets: stocks and bonds. These are the two fundamental assets in any economy. Bonds promise a steady stream of coupons (at least in nominal terms). Stocks offer dividends, but provide investors with upside potential from capital gains. We will discuss a wider array of assets later in the book, but many of them are highly correlated with U.S. stocks and bonds.
In this chapter, only one type of bond will be considered: the U.S. Treasury bond. By studying Treasury bonds, we can ignore the default risks associated with private sector bonds such as corporate bonds or mortgage-backed bonds. Treasury bonds are not without risk, but these risks stem from the volatility of bond prices and the eroding effects of inflation. We will discuss these risks later. A series for the 20-year U.S. Treasury bond extends all the way back to 1926, so this bond will be analyzed in detail.
Similarly, only one series for stocks will be considered, the S&P 500 stock index. This is a series for large capitalization stocks also extending back to 1926. Investors are often interested in a wider variety of stocks. Indeed, we will have chapters ahead to discuss other types of U.S. stocks as well as foreign stocks. But the S&P is often used to represent the overall U.S. stock market. The S&P 500 consists of only 500 of the 7,000-plus stocks in the U.S. market, but those 500 stocks represent over 90 percent of the total capitalization of the U.S. stock market.1
Bonds and stocks are both risky, therefore it is useful to compare their returns with a risk-free asset. Of course, there is no such thing as a perfectly safe asset. But the one-month U.S. Treasury bill comes very close. The Treasury bill (like the Treasury bond) has virtually no default risk. And, unlike the Treasury bond, it has virtually no inflation risk. If inflation were to rise unexpectedly, the next month’s Treasury bill would offer a higher interest rate to compensate for that higher inflation (because Treasury bill investors would insist on it). So the Treasury bill is the closest we can come to a risk-free asset.
Although the bond and stock data begin in 1926, we will focus on the postwar period beginning in 1951. That gives us more than 60 years of data while avoiding years of depression and world war (which hopefully we will not see again). But why start so early? Isn’t it better to look at recent market performance? The answer is that we will examine more recent periods, but it’s important to look at a variety of periods with high growth and low growth, high inflation as well as low inflation. This book is about investing for a lifetime. And that means considering what may happen over 30- or 40- or 50-year periods in the future. Surely, it will help for us to look at a variety of periods in the past.
BONDS AND STOCKS SINCE 1951
How much do we earn on bonds and stocks in the long run? Throughout this book, we will quote returns expressed in annual terms, or returns per annum. That’s the way that banks are required to quote returns on bank deposits and the way that investment firms quote returns on mutual funds. As shown in Figure 2.1, the average return on the 20-year Treasury bond is 6.4 percent per annum since 1951. A 6.4 percent return may seem like a lot, but we have not yet adjusted for inflation, which averaged 3.7 percent over the same period. And notice that the 20-year bond does not earn that much more than the one-month Treasury bill, 6.4 percent versus 4.6 percent. If we invest in a one-month Treasury bill and roll over that investment every month, we earn a return that is virtually risk-free. Remember that the 20-year bond exposes us to sudden increases in interest rates. If the interest rate on new Treasury bonds rises, then existing bonds fall in price. In contrast, if the interest rate on new Treasury bills rises, then the next bill that we buy will offer this higher rate.
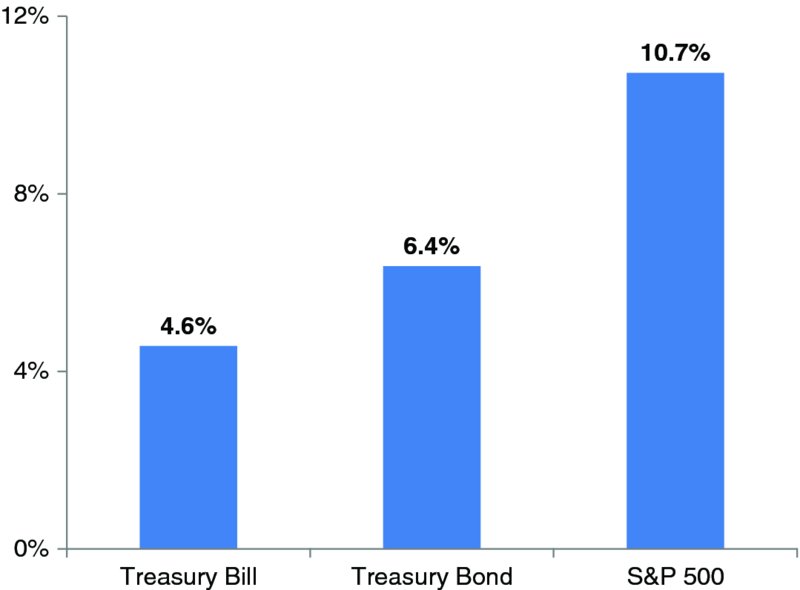
FIGURE 2.1 Compound Returns on Bonds and Stocks, 1951–2012
Source: © Morningstar.
Figure 2.1 shows the average return over a 62-year period. Over shorter periods, of course, 20-year bonds can earn much higher returns than the Treasury bill. Consider returns during the year 2010. During that year, the 20-year return was 10.1 percent while the Treasury bill earned 0.1 percent. The reason why the Treasury bill return was so miserably low is that short-term interest rates were kept very low by Federal Reserve policy. Long-term interest rates were also low relative to historical experience in 2010, but long-term interest rates fell over the course of that year. So the total return on the 20-year bond was higher than the interest rate itself. In some other years, the return on the 20-year bond falls below that of the Treasury bill. Indeed, Treasury bond returns can actually turn negative as they did in 1973, for example. But over the 62-year period reported in Figure 2.1, the return on the Treasury bond exceeds that of the Treasury bill by 1.8 percent.
Figure 2.1 also shows the average return on the S&P 500 as being 10.7 percent since 1951. That’s impressive, particularly compared with a 6.4 percent return on Treasury bonds. The excess return on equity is 4.3 percent over this 62-year period. Experts in finance have given this excess return a special name, the equity premium. It’s the reward that investors receive from taking on the extra risk of equities. Of course, the equity premium is not steady over time. In some years, equities earn lower returns than bonds. In the recession year of 2008, for example, the S&P 500 earned –37.0 percent, while bond returns soared to 25.9 percent. Figure 2.1 shows long-run averages, not short-run returns.
Looking at returns without adjusting for inflation is a little misleading. For example, if a portfolio earns 5 percent but the cost of living rises by 5 percent, then in some real sense wealth has not increased. In the 1970s, there were high bond and stock returns, but, as we will see, investors did very poorly because inflation was even higher.
THE IMPORTANCE OF ADJUSTING FOR INFLATION
The United States has suffered a lot of inflation since 1950. That’s difficult for younger Americans to understand because inflation has been so low for the past decade or so. But there was a time in the 1970s when inflation reached double-digit rates. That was a decade when high inflation combined with slow growth to give us what was termed “stagflation.”
Even with modest inflation, however, the cumulative effects of increases in the cost of living are substantial. Suppose that the inflation rate is 2.5 percent. (This is the inflation assumption used in many investment firms when projecting future price increases). Over a 10-year period, a 2.5 percent inflation rate raises the cost of living by 28 percent. That’s because inflation compounds over time. Over a 20-year period, the cost of living rises over 60 percent. Since the United States has had inflation considerably higher than 2.5 percent, we need to track changes in the cost of living carefully.
For decades, the U.S. Bureau of Labor Statistics has maintained a consumer price index series for urban consumers. Table 2.1 uses this index to calculate how much a $1,000 basket of goods in 2010 would have cost in earlier decades. For example, in 2000 that basket of goods would have cost $790. Further back, in 1970, that basket would have cost only $178!
TABLE 2.1 Cost of Living and Wages over Time in the United States
| Wages in Manufacturing Sector | |||
| Year | Cost of Today’s $1,000
Basket of Goods |
Historical | In 2010 Dollars |
| 1950 | $110 | ||
| 1960 | $136 | ||
| 1970 | $178 | $6,685 | $37,576 |
| 1980 | $378 | $14,760 | $39,069 |
| 1990 | $599 | $22,703 | $37,884 |
| 2000 | $790 | $30,754 | $38,951 |
| 2010 | $1,000 | $39,688 | $39,688 |
Source: Bureau of Labor Statistics and Council of Economic Advisors, Economic Report of the President (Washington, DC: U.S. Government Printing Office, 2011).
The consumer price index is designed to measure the cost of a variety of goods and services. But there is a lot of variation in inflation rates across goods and services. Some manufactured goods have become much cheaper over time, at least measured relative to overall inflation or wage levels. Consider the example of a color television. When color televisions were first introduced in the 1950s, they were quite expensive. But as they became mass-produced, their costs fell. By 1965, a 21-inch RCA cost only $400. What would be the equivalent price for this TV in 2010 if the price had risen as fast as the consumer price index (CPI)? The answer is that this TV (if it still existed) would cost $2,800! In actual practice, the same size TV today, though much more technically advanced, would cost even less than $400. It is technical progress in manufacturing that has driven cost down so radically.
On the other hand, some goods and many services cost a lot more today. Take an example that may irritate many parents—college tuition. When I entered college in the 1960s, the cost of tuition, room, and board at an Ivy League college totaled $3,000 per year. If college costs had increased at the same rate as the Consumer Price Index (CPI), the tab today would be about $21,000. Instead, tuition, room, and board at an Ivy League college is over $50,000 per year. Medical care has seen similar inflation rates over time. These rates of inflation matter to investors. Investors in their thirties and forties often have to save for the college costs of their children. It’s painful when tuition costs rise faster than overall inflation and faster than wages. Similarly, older investors have to contend with rapidly rising medical costs. Those costs are an important factor affecting retirement planning. But we will focus on overall inflation rates, not those in specific sectors of the economy.
Wages are a lot higher today than they were 30 or more years ago. Or are they? Table 2.1 tracks the average annual wage in manufacturing back to 1970. A worker in manufacturing today earns an average wage of $39,688 (including overtime). Back in 1970, that same worker would have earned a wage of only $6,685. But don’t feel sorry for that worker. The cost of living was so much lower in 1970 that this wage was equivalent to $37,576 in today’s dollars. So the next time that an older person brags about how little he or she made as a young worker, be skeptical. It’s real wages, not nominal wages, that matter. Real wages do increase over time, at least in the long run. But the rate of increase is small for the average worker. In fact, between 1980 and 1990 wages actually fell in real terms in the United States, at least in manufacturing. That was not true once benefits are taken into account.
It’s important to take into account inflation in all historical comparisons. That surely is true when it comes to investments. If an investment has doubled in value since 1985, is that good news? Actually, it’s terrible news because the cost of living has also doubled since then, so the investor has earned nothing in real terms. Having seen how important inflation can be, let’s revisit the returns on bonds and stocks and adjust those returns for inflation.
BONDS AND STOCKS ADJUSTED FOR INFLATION
Since 1951, the inflation rate has averaged 3.7 percent per annum. Adjusting for this inflation rate gives us a set of real returns as shown in Figure 2.2.2 The real return on Treasury bonds is only 2.6 percent. The real return on stocks is a more respectable 6.8 percent. That’s still very low.
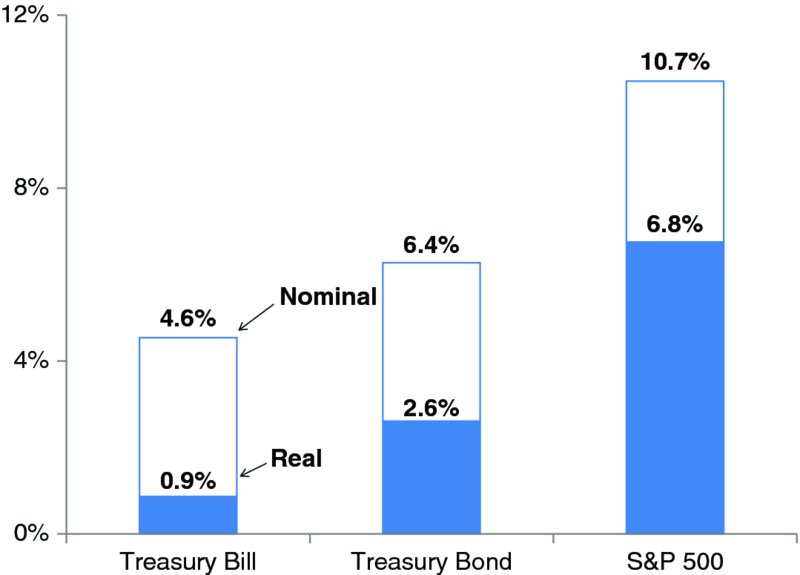
FIGURE 2.2 Real and Nominal Returns, 1951–2012
Source: © Morningstar.
Let’s remind ourselves why we are so concerned about real returns as opposed to nominal returns. The reason is that only real returns provide for future spending. A portfolio must keep pace with a higher cost of living just to stand still. In order to grow over time, a portfolio must earn positive real returns.
The difference between earning 2.6 percent on bonds and 6.8 percent on stocks is enormous. Consider a simple experiment where an investor decides between devoting the entire portfolio to either bonds or stocks. Let’s consider how much $100,000 in initial wealth accumulates over a 20-year period. And, to keep the example as simple as possible, let’s assume the portfolio is tax-free.
The results are shown in Figure 2.3. A portfolio devoted to bonds increases to $167,100 over the 20-year period. Remember that wealth is being measured in constant dollars over the 20-year period. Real wealth increases by $67,100 for a 67.1 percent cumulative return. That’s not much for 20 years of patience! Contrast the bond investment with investment in stocks. Over a 20-year period, the $100,000 grows to $372,800 for a 272.8 percent cumulative return. The equity premium makes quite a difference to long-run accumulation! That extra accumulation might come in handy in retirement. In the next chapter, though, we will have to consider periods when the equity premium fails to materialize for the investor.
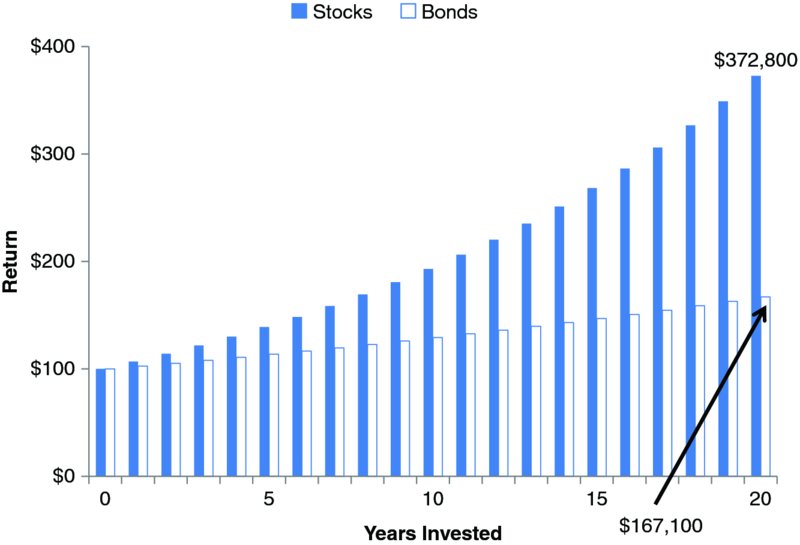
FIGURE 2.3 $100,000 Invested for 20 Years in Stocks or Bonds (2012 Dollars)
How sensitive are these results to the time period? Perhaps the postwar period in the United States has been unusually kind to equities. Earlier in the chapter, we reported that the Treasury bond and S&P series extend back to 1926. For the period from 1926 to 1950, the 20-year Treasury bond earned 2.3 percent, almost matching the return for the post-1950 period. And the S&P return was 6.3 percent rather than 6.8 percent. So for the 25-year period ending in 1950 as well as the 62 years since then, the equity premium was alive and well. It is not merely a fluke of the postwar period.
ASSET ALLOCATION DECISIONS FOR YOUNG INVESTORS: THE CASE OF TIAA-CREF
Because stock and bond returns are so different, it really matters what allocation between stocks and bonds is chosen by the investor. Often investors are asked early in their careers to choose allocations for their 401(k) or other defined contribution programs. And often these allocations remain unchanged for extended periods of time. So it’s important to think carefully about what allocation is appropriate early in your working life.
There was an interesting study of investor choice done a few years ago (Ameriks and Zeldes 2004) using data from TIAA-CREF accounts. Until the 1990s, these accounts were open mainly to university professors as well as other university employees. In 1989, there were only two options available to these “professors”: TIAA was a fixed-income investment that turns into a fixed annuity at retirement and CREF is a broad-based stock fund. The study showed that professors on the whole are not very sophisticated about their investment decisions. Faced with a choice between two investments, a large proportion of professors clustered on two portfolios:
- 25 percent chose an all-bond portfolio.
- 40 percent chose a 50/50 bond/stock portfolio.
Few investment experts would recommend either of these portfolios for young investors early in their accumulation years. Instead, most experts would recommend a higher weighting of stocks than bonds. For example, the “target date” retirement portfolios recommended by firms such as Vanguard and Fidelity call for investors 25 years or more from retirement to devote from 80 to 90 percent of portfolios to stocks. The high allocation to stocks presumes that the equity premium will prevail in the long run, thereby lifting returns over time.
When I was 29 years old, I was faced with the decision about how to invest in TIAA-CREF. I chose an allocation of 75 percent in CREF and 25 percent in TIAA. Looking back now, I would do it all over again. But most highly educated professors seem to have no clue how to proceed with this all-important decision. And they do not have the good sense to seek advice.
Let’s consider how much difference this decision can make. Imagine that professors decide to contribute a fixed amount per year for each year of their career. Often this contribution is matched (at least partially) by a contribution from the employer. Let’s assume that the total contribution is $10,000 per year in constant dollars. This is admittedly unrealistic in that salaries increase in real terms over time, particularly as the professor is promoted from junior to senior faculty positions, so pension contributions also increase. But let’s keep the example simple.
As the professors save, they are assumed to earn returns on their stocks and bonds at the average real returns given in Figure 2.2. That is, bonds earn 2.6 percent in real terms and stocks earn 6.8 percent in real terms. The professors are assumed to choose a bond/stock allocation at the beginning of their work years and leave it unchanged thereafter. Later we will consider “target date” mutual funds that change the bond/stock allocation as the investor gets closer to retirement, but here we assume that the professors are too preoccupied with their research to bother with mundane financial matters. So they leave the allocation unchanged throughout their careers.
Table 2.2 shows the total accumulation at the end of each decade depending on the bond/stock allocation chosen. All figures are measured in constant dollars. Professors are assumed to adopt four alternative strategies ranging from all bonds to all stocks. Professors who invest only in bonds accumulate $446,100 after 30 years. That may seem like a lot, but they have saved a total of $300,000 ($10,000 for 30 years). In contrast, professors who invest 75 percent in stocks and only 25 percent in bonds accumulate $756,600. And those who plunge their whole portfolio into stocks are rewarded with $911,300.
TABLE 2.2 Accumulation in Retirement Account Based on Bond/Stock Allocation
| Allocation | ||||
| Bonds | 100% | 50% | 25% | 0% |
| Stocks | 0% | 50% | 75% | 100% |
| Accumulation | ||||
| 10 years | $112,500 | $124,000 | $130,300 | $136,900 |
| 20 years | $258,000 | $320,400 | $358,100 | $401,100 |
| 30 years | $446,100 | $631,200 | $756,600 | $911,300 |
Assumptions: Real bond return = 2.6%, real stock return = 6.8%. $10,000 saved per year (in 2013 dollars).
Crucial financial decisions are often made casually even by smart, well-educated people. What segment of the population is better educated than college professors? Professors or other investors who elect all-bond portfolios may make this choice because they believe bonds are less risky than stocks. But what risk are they preoccupied with? If it’s short-term volatility, then is that appropriate for a decision about long-run accumulation? Should a 30-year-old be worried about the possibility of market crashes when they are 39 or 47? Or should they focus on how much wealth they will have when they retire at 66?
I remember the market crash of 1987. Stocks fell 25 percent in the space of two days. Since I was far from retirement in that year, I didn’t think twice about my retirement allocation. As a finance professor, I was fascinated with the crash. But it didn’t matter to me personally. I was confident that the market would rebound. I didn’t know when the rebound would occur, but I surely knew it would be before I retired. If I had been about to retire or even a few years from retirement, this nonchalance would have quickly disappeared.
WHAT ARE THESE LONG-RUN AVERAGES MISSING?
This analysis based on 60 years of data does ignore an unpleasant fact. Stock and bond returns do vary a lot over relatively long periods. Investors who experienced the decade of stagflation during the 1970s know this is true. So Chapter 3 will examine the postwar period in greater detail. It matters to investors when they do their accumulation. Before turning to that chapter, let’s ask a simple question about the postwar period. Did it matter when you retired? Were those handsome returns reported in Table 2.2 earned by investors retiring in 1980 or in later decades?
Let’s keep the analysis simple by assuming that the investor kept everything in stocks. Like the TIAA-CREF investor, this investor saved $10,000 per year for 30 years. If the investor had hidden the savings under a mattress, the total saved would have been $300,000 in nominal terms. But because of inflation, the total accumulation in constant dollars would have been much less depending on the period. Suppose that an investor saved for 30 years and retired in 1980. How much would he or she have accumulated? And what if the investor started saving 10 years later and retired in 1990? Here are the accumulations in a stock account after 30 years for those investors retiring in 1980 or 1990 or 2000 or 2010, all measured in constant dollars:3
- Retire in 1980: $529,000
- Retire in 1990: $689,900
- Retire in 2000: $1,832,800—quite amazing!
- Retire in 2010: $847,800
Look at those lucky retirees who finished accumulating in 2000. They had just experienced two decades of bull markets in both stocks and bonds. No wonder they had accumulated more than three times more than those who retired in 1980. Retirement is not the end of the investing process, of course, and those who retired in 2000 were facing a “lost decade” on returns thereafter.
What’s the moral of this story? The moral is that it’s not enough to marvel at the long-run equity premium. Stocks outperform bonds in the long run, but we must worry about the huge variation in returns in the postwar period. And we must worry about whether future returns will be lower than in the past. Bill Gross of PIMCO talks about a “New Normal” of low returns. Is this what investors are facing in the years ahead?
NOTES
REFERENCES
- Ameriks, John, and Stephen P. Zeldes. 2004. “How Do Portfolio Shares Vary with Age?,” Working Paper, Columbia Business School.
- Ibbotson Associates. 2012. 2012 Ibbotson Stocks, Bonds, Bills, and Inflation (SBBI) Classic Yearbook. Chicago: Morningstar.