
CHAPTER 10
Investing in Bonds: The Basics
Bonds are the bedrock of any portfolio. As with buildings built on bedrock, portfolios with bonds have a solid base. We don’t expect to earn high returns with bond investments. After all, bonds provide fixed coupons with little upside, at least in normal times. But we expect our bond investments to be safe.
Unfortunately, bonds have weaknesses. These solid rocks crumble when inflation occurs. In the inflation-ridden decade of the 1970 s, bonds lost ground to inflation. So bond investors ended up poorer than at the beginning of the decade. This is something to keep in mind when we examine the history of bond returns. We should also be mindful of credit risk. If a bond provides a much higher yield than offered on U.S. Treasury bonds, the bond probably has credit risk to worry about.
This chapter will study U.S. Treasury bonds, bonds that are free of default risk (despite the views of one rating agency).1 That will allow us to examine the impact of inflation on bond yields. We will also study how bond yields vary by maturity. In this chapter we will also discuss various strategies for investing in any type of bonds (not just Treasuries). Strategies will include “buy and hold,” “laddering” the bond portfolio, and investing in bonds via mutual funds. Then in the next chapter we will study non-Treasury bonds like those issued by corporations. Credit risk is obviously an issue with some of those bonds. Finally, we will examine municipal bonds. The tax advantages of municipals are examined, but so also are the credit risks of this sector of the bond market.
BOND YIELDS AND BOND RETURNS
Bonds are often favored by investors because they provide “fixed income” in contrast to the variable returns offered by equities and by most other assets. A stream of fixed income payments is often viewed as essential to retirees as well as many institutional investors because of their need for steady income. Yet bond yields represent only part of the return on bonds. The variation in yields over time leads to capital gains and losses on existing bonds that sometimes dominate the total return from holding these bonds. In the 1970 s, for example, bond yields were quite high relative to long-run averages. Yet bond returns were quite abysmal because of capital losses. As inflation and interest rates rose over the decade, existing bonds fell in value. So the total return on these bonds, consisting of capital gains as well as coupons, was far lower than the coupons themselves. Returns on bonds in the 1970 s were lower still when adjusted for inflation.
How does inflation affect interest rates? In the short run, central banks often play a critical role in setting short-term interest rates. Inflation plays only a secondary role. For example, the Federal Reserve directly controls the Federal Funds interest rate, the rate at which banks borrow in the interbank market. And other short-term dollar interest rates rise in tandem, such as the 30-day Treasury bill interest rate and the interest rate on short-term bank certificates of deposit (or CDs). So if the Fed raises the Fed Funds rate by 25 “basis points,” or 0.25 percent, the Treasury bill rate, bank deposit rates, and interest rates on money market mutual funds are likely to rise by a similar amount (in normal times, at least). In the long-run, however, the role of the Federal Reserve is very different. In the long run, U.S. interest rates are primarily determined by inflation. And it is the Fed’s role in helping to determine the inflation rate that matters.
Recall the history of U.S. interest rates since the mid-1950 s as shown in Figure 3.3. Except for a temporary bout of inflation during the Korean War, inflation remained low in the United States throughout most of the 1950 s and 1960 s. Inflation peaked following two oil price shocks in 1973–1974 and 1979. Beginning in the late 1960 s, interest rates slowly but surely responded to rising inflation as inflation expectations became imbedded in bond yields. The 10-year Treasury yield reached double digits by late 1979. The same inflation expectations led to rising wage demands and to downward pressure on the U.S. dollar. To lower interest yields from their highs in the late 1970 s, it was necessary for the Federal Reserve to pursue a tight monetary policy. This shift in policy began in 1979 with the appointment of Paul Volcker as chair of the Federal Reserve Board. The low interest rates that we experience today were “made” at the Fed. But in the long run, low interest rates result from low inflation, not from the Fed lowering the Fed Funds rate.
To provide further evidence of the link between inflation and interest rates, consider the bond returns earned on long-term Treasury bonds in each decade since 1950 as shown in Figure 10.1 This chart shows the nominal bond return and the inflation-adjusted “real” bond return, both measured per annum. The latter is obtained by deflating the nominal return by the inflation rate. The low bond yields of the 1950 s were more than matched by inflation. So the investor actually lost money once inflation was taken into account. During that decade, the investor earned 1.2 percent per annum on average measured in nominal terms, but inflation averaged 1.8 percent per annum.2The value of the investor’s bond portfolio was smaller at the end of the decade than at the outset once the rise in the cost of living was taken into account. Over the next two decades, the 1960 s and 1970 s, inflation expectations evidently lagged behind actual inflation so bond holders earned even larger losses on their bonds with negative real bond returns of –1.6 and –3.8 percent (per annum), respectively, in these two decades! Fixed income earners were deceived by the “steadiness” of the coupons on their bonds. The real value of the bonds was being eroded by inflation, and the coupons themselves were being debased by rising price levels.
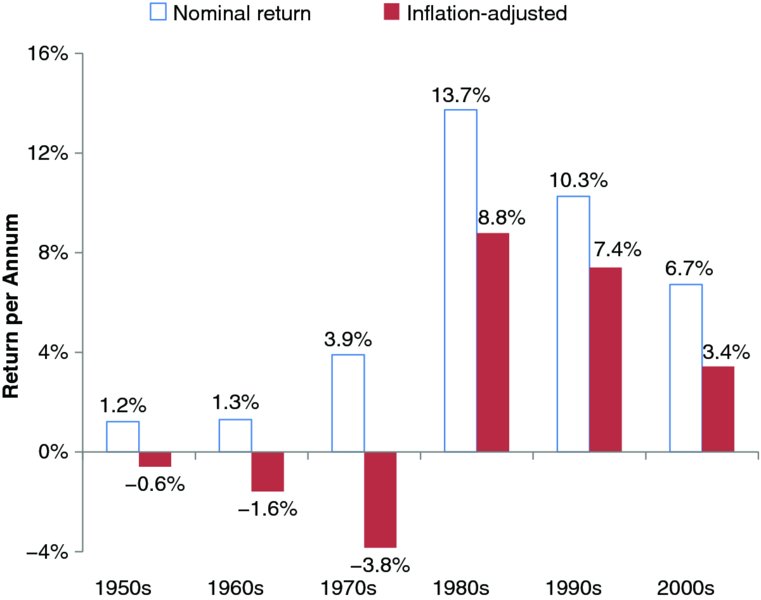
FIGURE 10.1 Nominal and Inflation-Adjusted Treasury Yields by Decade
Data source: Morningstar.
The terrific returns earned since 1981 are a direct result of the Fed’s policy of fighting inflation. Over this period, bond yields and inflation expectations lagged behind actual inflation once again. But in this case, bond holders were surprised by falling inflation and they were rewarded with unusually large real returns on their bonds. In the decade from 1981 to 1990, the compound real return on the long-term (20-year) Treasury bond averaged 8.8 percent/annum. That return was followed by a 7.4 percent/annum compound return in the 1990 s. Returns like these can be earned when inflation falls from 13.5 percent to its current level and when bond yields fall from almost 15 percent to less than 5 percent.
The wide range of returns over the 60-year period is of concern in itself. To see decade-long, inflation-adjusted returns ranging from –3.8 to +8.8 percent is quite alarming. But that shows the potential vulnerability of “safe” bond investments to inflation. It’s true that the average real return over the full six decades is close to longer-run averages. From 1951 to 2010, the inflation adjusted return on the 20-year Treasury was 2.3 percent. If the period is extended back to 1926, the average return rises to 2.4 percent. But the long-run averages hide a lot of variation.
What influences Treasury returns besides inflation? Treasury yields are certainly influenced by the maturity of the bond. Usually, longer-term bonds earn higher yields than shorter-term bonds. So in most periods, the “term structure” of interest rates is upward sloping, which means that 20-year Treasury bonds, for instance, pay higher yields than five-year Treasuries. Consider Figure 10.2, which shows the “term structure” of yields on U.S. Treasury bonds in three different years, 1985, 1995, and 2005. In all three years the economy was growing, so the term structure of yields had its normal upward slope. (If a recession had occurred in one of these years, the term structure of yields could have been inverted temporarily, particularly if the Federal Reserve had recently raised short-term interest rates to cool the economy.) Over the three decades shown in the figure, inflation and interest rates were dropping. So the whole term structure of yields fell over time. Thus the figure illustrates two of the three determinants of bond yields: inflation and the maturity of the bond. The third factor, default risk, is negligible in the case of Treasuries.
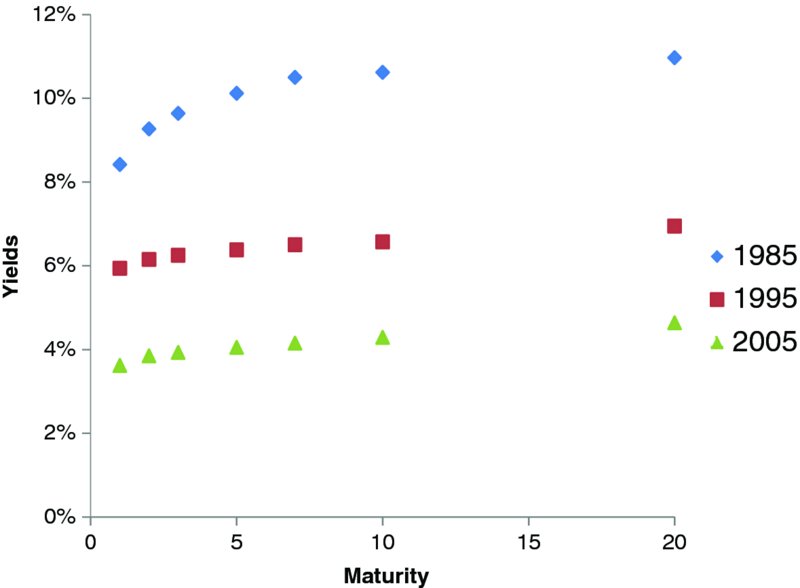
FIGURE 10.2 Term Structure of Yields on Treasury Bonds
Data source: Federal Reserve Board.
Bond yields are only one component of bond returns. Bond returns reflect both the coupon paid and the capital gain over the holding period of the return. Table 10.1 breaks down the bond return into two components: the income earned on the bond plus the capital gain. The table reports bond returns for two maturities of U.S. Treasuries. The long-term bond is a 20-year Treasury bond, while the medium-term is a five-year Treasury. First consider returns for the 30-year period ending in 2010 (at the bottom of the table). In periods of falling interest rates, such as those in the 1980 s until present, long-term bonds should outperform medium-term bonds. That is indeed the case. In the table, the return on the 20-year bond is 2.2 percent higher than on the five-year bond during the period from 1981 to 2010. During this period, the capital gain component of the bond return contributed 3.1 percent to the total return of the 20-year bond.
TABLE 10.1 Treasury Bond Returns: Income and Capital Gains
| Income Return | Capital Gain | Total Return | |
| 1951—1980 | |||
| Long-term | 5.2% | –2.9% | 2.3% |
| Medium-term | 5.1% | –1.1% | 4.1% |
| 1981—2010 | |||
| Long-term | 7.7% | 3.1% | 10.9% |
| Medium-term | 6.8% | 1.9% | 8.7% |
Notes: The long-term Treasury bond has a maturity of 20 years, while the medium-term Treasury bond has a maturity of five years.
Data source: Morningstar.
These results are reversed in the earlier period ending in 1980 when inflation was rising. Even though both Treasury bonds have about the same income during the earlier period, the capital loss on the 20-year bond is much larger than on the five-year bond. So the total return on the longer-term bond is only 2.3 percent compared with a 4.1 percent return on the five-year bond. These are miserably low returns in a period when inflation averaged 4.3 percent/annum. Both returns, as discussed above, would be negative if inflation was taken into account.
What are the lessons from this table? Bond returns are more variable the longer the maturity of the bond. In periods of falling inflation and falling interest rates, bond returns are maximized if you own longer-term bonds. In periods of rising inflation and rising interest rates, bond returns are worse if you own longer-term bonds. One lesson from the table is that it is best to hold long-term bonds if interest rates are falling. That’s the lesson that all investors learned well over the past 30 years. It was a glorious period of falling interest rates. But what if interest rates are likely to rise in the future? Then you shorten maturities.
BUT WHAT IF I BUY AND HOLD?
Some investors may decide to avoid capital gains by buying and holding a long-term bond. In that case, so the reasoning goes, an investor can avoid suffering from exposure to market fluctuations. That is, the investor’s investment statement will show a constant value for the bond investment (if the statement reports the so-called “book value” of the bonds). But is the investor really protected from the market?
Why is it so important to ask this question? In early 2013, Treasury yields are near all-time lows. Let me go out on a limb to say that these yields will not stay low forever. And if yields do rise, we need to know how investors can best protect themselves. If they buy and hold, will that protect them?
Let’s consider a simple example. Suppose that an investor buys a 20-year bond in early 2013 with a yield of 2.5 percent. And let’s imagine that bond yields rise to 5 percent within the next five years. That’s not too farfetched because real (inflation-adjusted) interest rates average about 2.5 percent in the long run. With even moderate inflation, a nominal yield of 5 percent could easily prevail. If new bonds yield 5 percent, then the price of the investor’s existing bond will fall. But let’s ignore this change in the bond’s price. After all, the investor thinks that the book value of the bond and the coupon of the bond are all that matters. In what sense has the investor suffered a loss? Well, until the bond matures, the investor is foregoing the opportunity to earn 5 percent interest rather than 2.5 percent. That’s as much of a loss as is suffered by the bond investor who sells the original bond and realizes a capital loss. Buying and holding does not shield the investor from losses when interest rates rise.
It might be helpful to look at actual investment experience during the time of rising interest rates in the late 1960 s and 1970 s. Suppose that an investor bought a $10,000 10-year bond at the beginning of 1965 with a yield of 4.2 percent. This investor would see a steady income of $4,200 each year for the next 10 years. But in the meantime, yields on new bonds were rising. If the investor paid attention to the value of the existing bond, it fell as yields rose. But let’s assume the investor held the bond until maturity. Let’s examine the investment performance by comparing the investor’s return with that of another investor who held short-term securities (called Treasury bills). Consider Figure 10.3 where the yield on a 10-year Treasury bond in 1965 is compared with a succession of yields on one-year Treasury bills. When the 10-year bond is first issued, the one-year interest rate is below the 10-year. But the interest rate on the one-year Treasury is higher by the time of the first rollover. In fact, as seen in Figure 10.3, the one-year interest rate keeps rising until 1969 and never declines back to the original 10-year Treasury yield.

FIGURE 10.3 Buy-and-Hold Strategy for Bonds When Yields Rise
Data source: Federal Reserve Board.
The potential risks of a buy-and-hold strategy are exacerbated if the real returns on a bond are measured rather than nominal returns. Inflation became a serious problem in the 1960 s. Indeed, interest rates were rising because of rising inflation. Over the 10-year period starting in 1965, inflation averaged 5.2 percent. With the investor stuck in a 4.2 percent bond, the average inflation-adjusted return on this bond was actually negative at –1.0 percent. It’s true that at maturity the investor was fully paid what was promised by the government. Both principal and interest were paid on schedule. But by the end of the 10-year period, the investor was poorer in real terms than when the investment was made. If a 10-year bond had been purchased 10 years later at the beginning of 1975, the yield would have been a much higher 7.4 percent. But over the subsequent 10 years, inflation would rise to an average of 7.3 percent per year. So the investor barely broke even in real terms. Of course, if the investor persisted for another 10 years when inflation started to fall sharply, he would have been amply rewarded. But the point is that locking in bond yields does not shield the investor if inflation rises.
It wouldn’t be fair to recount experiences with bond investing in the 1960 s and 1970 s without also examining the past few decades of falling yields and falling inflation. Let’s imagine that in 1981 an investor decides to invest in a 30-year Treasury bond yielding 14.5 percent. The investor chooses this bond at a time when inflation is still running at a 9 percent rate (having fallen from over 12 percent in 1980). Paul Volcker, the Chair of the Federal Reserve Board during this period, is busy trying to bring inflation down, but most investors remain skeptical that the Federal Reserve can stick to its anti-inflation policies. Certainly support for Volcker in the Reagan Administration and Congress is lukewarm. Most observers blame Volcker’s policies for the double-dip recession that is occurring. (The U.S. economy emerged from a brief recession in July 1980 only to fall back into recession in July 1981. That recession was a deep one that saw unemployment rates peak at 10.8 percent.) Despite uncertainty about whether the Fed’s policy would continue, this investor decides to buy the 30-year bond. How will the investor fare?
Now let’s imagine that the investor were to “fast-forward” to 2011, the year when this 30-year bond matures. The investor has enjoyed 30 years of high coupons. There is no doubt that this bond investment has been a real triumph. What is the investor’s annual return during this period? The answer is simple: in nominal terms, the investor has made 14.5 percent per annum. In real terms, the result is almost as dramatic because inflation has declined so sharply during the period. The average real return is 11.1 percent. This was a very astute investor, or at least a very lucky one. Readers will wish that they had bought the 30-year bond along with this investor. If only we had all known how successful the Fed would be in bringing down inflation and interest rates!
BOND INVESTING WHEN INTEREST RATES ARE AT RECORD LOWS
What are the lessons from these past experiences? The late 1960 s and the 1970 s were a disastrous period for bond investors. There is no reason to believe that U.S. history is likely to repeat itself. We will probably not see double-digit bond yields anytime soon. Nonetheless, bond investors should be wary about the current environment of record low interest rates. If interest rates were to rise significantly, we could very well experience periods of negative bond returns. And, even if nominal bond returns remain positive, investors could see negative real (or inflation-adjusted) bond returns. If this is the case, locking in long-term bond yields may not make much sense. Investors in a long-term bond might be able to sleep well at night knowing that their interest payments will be stable (at least in nominal terms). But these investors should be more concerned with their bond returns than their bond yields.
If interest rates are headed higher, what should an investor do? The simplest answer is to shorten bond maturities. Instead of investing in long-term bonds with maturities of 10 to 30 years, investors might choose bonds with maturities less than five years. This strategy would be costly in terms of yield. In May 2013, a five-year Treasury bond provides a yield of only 0.84 percent, whereas a 10-year Treasury has a yield of 1.93 percent and a 20-year has a yield of 2.73 percent. But a five-year bond would be less exposed to interest rate risk.
When I said that investors should pay attention to the maturity of their bonds, I wasn’t being precise enough. Investors worried about future increases in interest rates should pay more attention to the duration of their bonds than to the maturity of those bonds. Duration takes into account cash flows that occur prior to the maturity of the bond, so it is a better measure of the average maturity of all of the bond’s cash flows.3 The duration of a bond tells the investor how sensitive is the bond’s return to increases in the interest rate. For example, the return on a bond with a duration of three years will fall 3 percent if the interest rate rises by 1 percent. The return on a bond with duration of 15 years will fall by 15 percent in response to the same increase in interest rates. So the latter bond is five times as sensitive to interest rate increases!
In the spring of 2013, it makes sense for investors to keep the duration of their bond portfolios lower than five years. If they do so, investors will still suffer losses if interest rates increase. But the losses will be much smaller than from a long-term bond portfolio.
LADDERING THE BOND PORTFOLIO
Is there an alternative to “buy and hold?” One obvious alternative is to invest in a diversified portfolio of bonds with varying maturities. For an investor with moderate wealth, a diversified portfolio can be obtained through investing in a bond mutual fund. A mutual fund can mix a variety of maturities. And, jumping ahead to the next chapter’s topic, a mutual fund can provide a mixture of different types of credit risk.
Yet many investors want to own bonds directly. Is there a way to invest in bonds without betting on a single maturity? Many investors elect to “ladder” a bond portfolio, buying bonds every year so that there are a variety of maturities in the portfolio at any given time. Consider a stylized bond portfolio as shown in Figure 10.4 consisting of 10 bonds maturing in each of the next 10 years. One bond in this portfolio will mature at the end of 2013. That bond had been purchased nine years ago when 10-year bond yields were 4.1 percent. This bond has just one year of maturity left, but its interest rate is quite different from that of a one-year bond issued at the beginning of 2013 (which bears an interest rate of 0.15 percent). The portfolio also has a new 10-year bond that will mature in 2022 bearing an interest rate of 1.9 percent.

FIGURE 10.4 Bond Portfolio Laddered with 10 Bonds
What does a laddered portfolio provide to the investor? It certainly reduces the volatility of yields within a portfolio. Consider Figure 10.5 where the yields on a laddered portfolio are compared with yields on pure 10-year and one-year bond portfolios. Notice how volatile the one-year yield is. As stated earlier, the Federal Reserve controls very short-term interest rates through the Fed Funds rate. But even one-year yields will be significantly influenced by Fed policy. When a recession hits, as in 2000, the Fed drives interest rates down with active intervention in the short-term market. So the one-interest rate falls sharply. The 10-year interest rate also might react to the Fed stimulus, but this rate will move much less sharply.
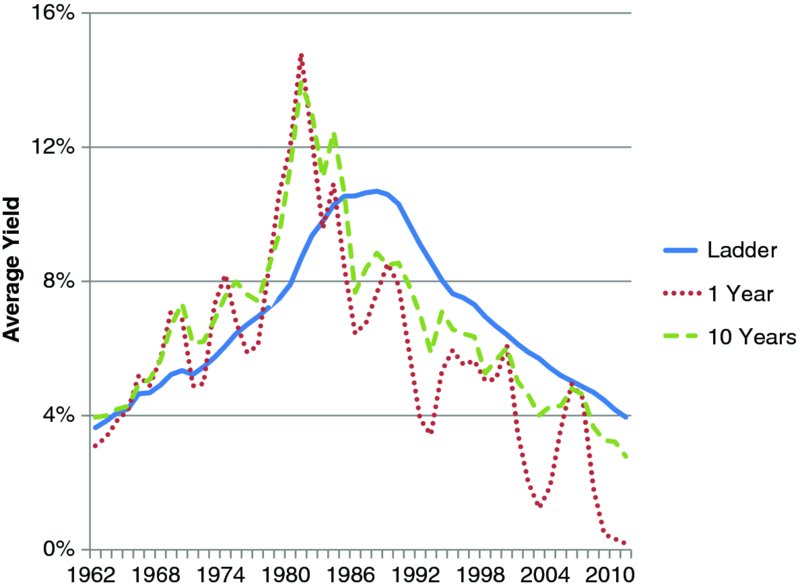
FIGURE 10.5 Yields on a Laddered Portfolio Compared with One-Year and 10-Year Yields
Data source: Federal Reserve Board.
Why is the yield on the laddered portfolio so much smoother? The reason is that this yield is an average of past and current interest rates so changes in yield cannot occur abruptly. In times of rising inflation such as the 1970 s, the laddered portfolio will delay the arrival of higher yields. And it will smooth the abrupt changes in yields (as experienced in the late 1970 s). The peak for yields on the laddered portfolio actually occurs as late as the mid-1980 s. By the same token, a laddered portfolio will delay the decline in yields as inflation falls. That is also seen in Figure 10.5. For the entire period from the mid-1980 s on, the laddered portfolio provides higher yields than the 10-year and one-year bonds.
A laddered portfolio does not solve problems posed by current low yields. If interest rates rise from current levels, the longer-term bonds in the portfolio will suffer more than proportionately. So the longer the duration of bonds in the ladder, the worse the portfolio will fare. It’s true that a laddered portfolio will suffer fewer losses than a portfolio of long-term bonds held by a “buy-and-hold” investor because the ladder includes shorter-term bonds. But losses will still occur if bond yields rise. If investors fear rising interest rates, they need to keep the average duration of their bond portfolios relatively short whether or not they invest in a laddered portfolio.
Now let’s contrast this laddered portfolio with a bond mutual fund. To make the contrast as clear as possible, let’s imagine that the mutual fund manager decided to build a laddered portfolio with the same bonds as in the portfolio described in Figure 10.5. (Usually fund managers would have strategies more complex than this one). How would the two portfolios differ?
- The mutual fund manager would charge a fee for the mutual fund. Fees range from less than 0.10 percent for index mutual funds to over 1 percent for some actively managed funds. The laddered portfolio instead incurs transaction expenses. There may be direct brokerage fees involved. But just as importantly, there will be hidden expenses because the buyer of a bond pays the ask price while the seller of a bond receives a (lower) bid price. And for lightly traded issues, these two prices can be quite different. (It should be noted that an investor can buy a Treasury bond directly from the U.S. government thereby minimizing such hidden expenses). Of course, the mutual fund manager also has to pay an ask price when the manager buys a bond. But because of the large scale of mutual fund purchases, the manager is likely to pay a lower price for the bond than an individual investor. That is, the bid-ask spread faced by a mutual fund manager is likely to be smaller than that facing an individual investor. So don’t necessarily assume that the mutual fund route is the more expensive one. In fact, it’s hard to beat the cost of some of the index mutual funds.
- The second difference is that the mutual fund manager would be required to “mark to market” the portfolio, telling the investor exactly how much return was earned each month. So during a period of rising yields, the return on the portfolio would be lower than the yields reported to an investor in the laddered portfolio. Of course, both portfolios have the same return because we are assuming they consist of the same set of laddered bonds. The difference is that the mutual fund investor knows the total return on the bond portfolio (including capital gains and losses), whereas the investor in the laddered portfolio can remain blissfully unaware. Maybe ignorance is bliss, but it’s important to understand that gains and losses on the laddered portfolio exist whether or not we acknowledge them.
There is an advantage of mutual funds that is hard to beat with an individual bond portfolio. A bond mutual fund can diversify credit risk and provide the investor with a wide range of different types of bonds. That is a considerable advantage once the investor moves beyond (ultrasafe) U.S. Treasury bonds.
The next chapter considers three types of bonds worthy of attention by investors. First, there are U.S. taxable bonds issued by corporations and other entities. Then there are Treasury Inflation-Protected Securities (or TIPS), a new type of bond begun in the late 1990 s. Finally, there are tax-exempt municipal bonds.