
CHAPTER 12
Investing in Real Estate: REITs
For ordinary investors, real estate is often the only type of investment that is considered outside of stocks and bonds. Real estate provides equity-like returns that are relatively low in correlation with traditional equity. In his book Unconventional Success (2005), David Swensen of the Yale endowment recommends that ordinary investors consider real estate for as much as 20 percent of their portfolios rather than pursue the other, more exotic types of alternatives that Yale and other large institutional investors focus on.
By real estate, we mean commercial real estate such as office buildings, shopping malls, and apartment buildings. The reason why these investments are accessible to ordinary investors is that they can buy real estate investment trusts (or REITs) which in turn invest in a mix of properties. REITs were developed in the 1960s to package commercial real estate properties. The underlying properties usually provide a stream of investment income based on the rents charged to tenants. There may also be capital gains when the properties are sold. So they resemble stocks in their payout structures, although real estate usually provides higher rents than the dividends offered by stocks. Residential homes are not usually considered part of the investment portfolio, though many home owners may regard them as investments. We will discuss homes in the next chapter.
Some investors choose real estate as their principal form of investment, not just one asset in a larger diversified portfolio. These investors own apartment buildings or perhaps an office building or even a small shopping mall, counting on the rents from these buildings to provide a steady stream of future income. These investments are the equivalent of a concentrated stock market investment in IBM or AT&T or GM shares. There may be little diversification in the type of real estate that is owned. And, just as important, there may be no diversification across locations. Owning real estate in Nevada prior to the financial crisis, or in Houston in the 1980s, is almost as risky as owning an individual stock. REITs, in contrast, allow investors to obtain extensive diversification.
The total amount invested in commercial real estate can be measured by tracking the sources of capital for real estate, both debt and equity, at least the capital that can be easily measured. According to a 2012 report on commercial real estate by the Urban Land Institute and PricewaterhouseCoopers, there was a total of $3.9 trillion invested in real estate in 2011.1 Of that total, almost 70 percent represents debt, both public and private, rather than equity. That should not be surprising since real estate has always been a highly levered investment. The equity portfolio totals a little less than $1.2 trillion in value. About one-fifth of that equity is provided by REITs, with most of the rest coming from institutional investors, including pension funds, and “private investors” including real estate partnerships.
These figures do not account for all of the commercial real estate in the United States. Instead, they represent the real estate that can be easily tracked because it is owned either by big institutional investors or by REITS. There are doubtless trillions of dollars of commercial real estate that are owned by smaller investors. Think of all of the office buildings, retail space, warehouses, factories, and apartment buildings in any city. Surely only a fraction of these facilities are easily tracked in national figures. Real estate is more important to the economy than these figures indicate.
REAL ESTATE INVESTMENT TRUSTS (REITS)
Real estate investment trusts, or REITs, were developed in the 1960s as a liquid alternative to direct ownership of real estate.2 REITs own, and in most cases operate, income-producing real estate such as apartments, shopping centers, offices, hotels, and warehouses. REITs are corporations that invest in real estate but are set up to pay little or no corporate income tax. To qualify for tax exemption, the REITs must distribute 90 percent of their income each year to investors.3 REITs may be publicly or privately held just like other corporations. Publicly traded REITs typically trade on stock exchanges such as the NYSE and NASDAQ.
Prior to the 1990s, the total capitalization of the REIT sector was less than $10 billion. But in the early 1990s, laws were changed to allow long-established real estate operating companies to package properties they owned into REITs. This led to an IPO boom that sharply increased the size of the REIT sector. In 1992, REITs totaled only $11.2 billion, but that total rose to $78.3 billion four years later and to a peak of $400.7 billion in 2006.4 After falling sharply during the financial crisis, the REIT market recovered enough so that in 2012 the value of REITs rose over $500 billion.
Since the early 1970s, NAREIT has maintained indexes of REIT returns that are widely used in the investments industry. NAREIT has an index for mortgages, but this chapter will focus only on the equity REIT index. The REITs included in the index must have at least $100 million in capitalization and must have a minimum amount of turnover.5 Figure 12.1 gives the breakdown of properties included in the equity NAREIT index in 2012. The largest sector is retail with 17.6 percent in regional malls, 8.8 percent in shopping centers, and the rest in freestanding retail real estate. The residential component representing 16.1 percent of the index consists largely of apartment buildings. Health care complexes and office buildings are the next two largest categories. Thus there are a variety of different types of property included in the index.
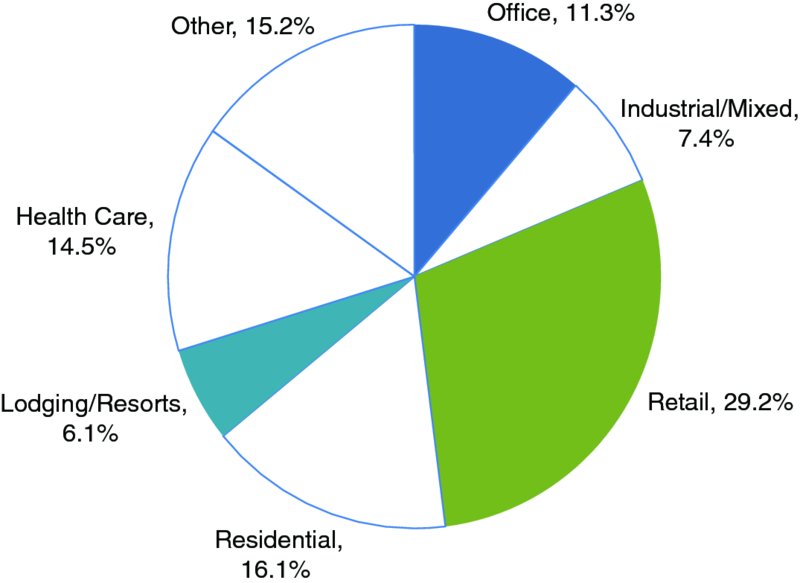
FIGURE 12.1 Property Sectors in Equity REIT Index
Source: NAREIT, 2013.
NAREIT provides monthly returns starting in 1972. Because the REIT market was so small until the early 1990s, we will present REIT returns over two periods, from the start of the series in 1972 to present and from 1992 on. Table 12.1 compares REIT returns with large-cap and small-cap stocks. For the period 1972–2012, small caps are represented by the Ibbotson Small Cap Index. For the shorter period, small caps are represented by the Russell 2000 Index.
TABLE 12.1 NAREIT Returns Compared with Stock Returns
| 1972–2012 | 1992–2012 | |
| NAREIT Index | 12.1% | 11.2% |
| S&P 500 Index | 10.0% | 8.2% |
| Small-Cap Index | 13.0% | 8.9% |
Data sources: NAREIT, S&P Dow Jones Indices, Russell®, © Morningstar.
The results are quite interesting. Let’s focus on the most important comparison, between REITs and the S&P 500. In both periods the NAREIT index has a higher return than large-cap stocks. The difference is particularly striking in the shorter period beginning in 1992. Despite the precipitous decline in the REIT index during the financial crisis of 2007–2009 (discussed below), REITs beat the S&P index by 3 percent over the 21-year period starting in 1992.
Since most REITs are classified as small-cap stocks, it’s interesting to compare the NAREIT index with small-cap indexes. Over the full period beginning in 1972, the Ibbotson small-cap stock index beats the REIT index by 0.9 percent. Recall from Chapter 6 that small-cap stocks performed unusually well in the 1970s. Over the period beginning in 1992, however, the REIT index beats the Russell 2000 small-cap index by over 2 percent. So there is no doubt that REITs provide attractive returns. But how do they fit in a portfolio?
HOW WELL DO REITS FIT IN A PORTFOLIO?
As stated at the outset of this chapter, real estate is the one investment alternative to stocks and bonds that is widely held by ordinary investors. Private equity, hedge funds, commodities, and other relatively exotic investments are held by very wealthy families and by institutional investors like endowments and pension plans. But few investors of modest wealth choose these investments (or are eligible to invest in them). Many of these investors instead add real estate to their portfolios. That has been especially true since REITs were introduced over 40 years ago.
How much real estate is appropriate? Judging from the weight of real estate in total stock market capitalization, the answer is not much. REITs constitute only 2.7 percent of stock market as measured by the Wilshire 5000 index. Equity real estate as a whole, as measured in Emerging Trends in Real Estate, totals almost $1.2 trillion, or about 9 percent of the value of the stock market. So if we think of REITs representing all real estate investment, we could justify an allocation equal to 9 percent of the equity portfolio. But if equity constitutes only 50 to 70 percent of most portfolios, then that leaves relatively small allocations to REITs.
Contrast this with the recommendation of David Swensen of the Yale Endowment in his book aimed at ordinary investors entitled Unconventional Success (2005). Swenson argues that ordinary investors do not have the luxury of investing in a wide range of assets other than stocks and bonds. Yale and other institutional investors can invest in private equity and venture capital, hedge funds, oil and gas properties, and timberland. But the average investor does not. So Swensen recommends that an ordinary investor devote 20 percent of the entire portfolio to real estate. Why so much?
One reason why real estate is attractive to investors is that it is relatively low in correlation with stocks. The emphasis is on the word “relatively.” Different segments of the U.S. stock market, like small-cap stocks versus large-cap stocks or value stocks versus growth stocks, tend to be very highly correlated with one another. Real estate is less correlated. But don’t expect real estate to always zig when stocks zag. Both are influenced heavily by the business cycle. When the economy is booming, there is a demand for more office buildings, more malls, more factories and distribution centers. A booming economy also drives up stock prices. The opposite can be said of a recessionary economy.
Yet real estate does sometimes have a life of its own. Consider the recession that followed the collapse of the NASDAQ in 2000. According to the National Bureau of Economic Research (NBER), this recession began in March 2001 and lasted until November 2001. As explained in Chapter 3, the S&P 500 reached its peak in August 2000, seven months before the recession began and reached its trough in February 2003. Over this period, the S&P 500 return totaled –42.5 percent, while the NAREIT return was +24.9 percent. This was fortunate indeed for investors who had diversified their portfolios by adding REITs.
Does real estate always buck the trend of stock markets? The answer is that the recession of 2001 was unusual. In normal recessions, you would expect REITs to suffer along with stocks because both types of investment depend on a healthy economy. Consider Table 12.2, which examines S&P 500 returns and REIT returns in the five recessions from the mid-1970s to the present. In every recession except for that of 2001, REIT returns turn negative along with stock returns. It’s true that in the very bad recession of the early 1980s, REITs did not fall nearly as much as stocks did. (If the S&P 500 provides a –16.5 percent return, investors should be grateful that REITs fall only 0.2 percent). But in the three other recessions, REITs either matched the poor performance of stocks or performed even worse. That was particularly the case in the most recent recession brought on by the financial crisis.
TABLE 12.2 REITs and Stocks During Recession
| Recession | Peak/Trough of S&P | S&P 500 | NAREIT |
| Mid-1970s | Jan. 1973/Dec. 1974 | –36.2% | –34.6% |
| Early 1980s | Nov. 1980/July 1982 | –16.5% | –0.2% |
| Gulf War | June 1990/Oct. 1990 | –14.1% | –17.4% |
| NASDAQ | Aug. 2000/Feb. 2003 | –42.5% | +24.9% |
| Financial Crisis | Oct. 2007/Mar. 2009 | –46.7% | –63.4% |
Data sources: NAREIT and S&P Dow Jones Indices.
Figure 12.2 shows the movement of the S&P 500 and NAREIT indexes during the past two recessions. Notice that the S&P 500 dips down sharply in 2000 while the NAREIT index, having fallen somewhat in 1997, just keeps rising as the NASDAQ and broader stock market indexes decline. This is in sharp contrast with the most recent recession. This recession began in December 2007 (months before Lehman Brothers failed) and ended in June 2009. But the stock market peaked two months earlier in October 2007 and fell until March 2009. Over this period, the S&P 500 returned –46.7 percent. But over this same period, the NAREIT index fell a distressing 63.4 percent. The performance of real estate in this period deserves a closer look.
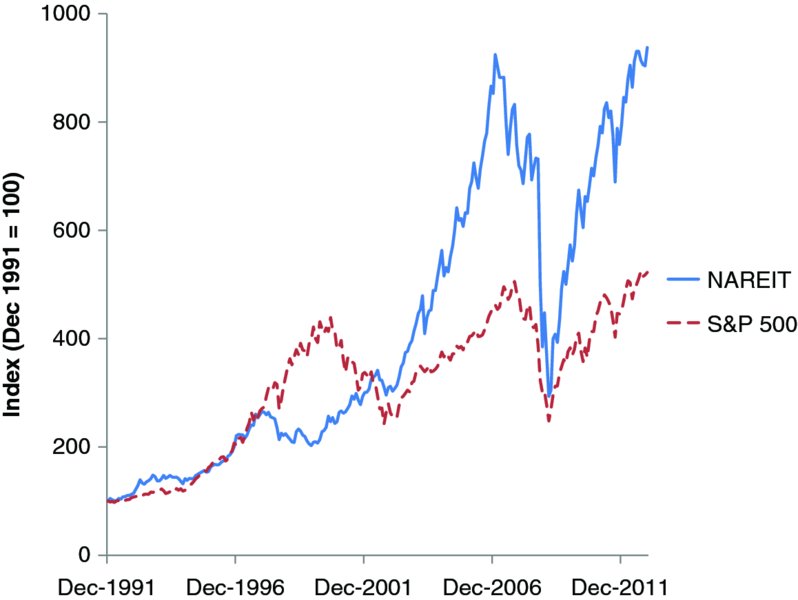
FIGURE 12.2 NAREIT and S&P 500 Returns, 1992–2012
Data sources: NAREIT and S&P Dow Jones Indices.
REITS AND THE FINANCIAL CRISIS
The financial crisis of 2007–2009 began as a real estate bust. It was not only a bust in residential real estate, the first nationwide decline in housing prices since the Depression of the 1930s, but also a bust in commercial real estate. Financing for both types of real estate virtually dried up. During the boom period in mid-decade, commercial real estate came to depend heavily on commercial real estate mortgage-backed securities (or CMBS). After reaching a peak in early 2007, the CMBS market collapsed soon after. Banks are the other major source of funding for real estate transactions. The financial crisis crippled many major banks. So real estate loans dried up overnight. The real estate boom was fueled by readily available financing at bargain basement rates. The end to this financing led to a collapse in real estate values.
All sectors of commercial real estate suffered during the crisis, although the retail and hotel sectors were hurt the most. Property values fell and sales declined sharply. But the size of the reduction in REIT prices caught many observers by surprise. To see returns fall by over 60 percent must have been a shock to many investors. That’s the price that investors pay for having marked-to-market pricing of real estate. If investors are spooked by a decline in real estate values, they will sell their REIT holdings. The fall in REIT prices may exaggerate the actual decline in real estate values.
Whether that is the case is a matter for debate. Institutional investors rely on real estate appraisals to judge the value of their holdings. Since the early 1980s, the National Council of Real Estate Investment Fiduciaries (NCREIF) has collected return data on real estate owned by institutional investors (the great majority of which are pension funds). The NCREIF returns consist of two elements: net operating income (gross rental income less operating expenses) and the capital gain on the property. The capital gain measure is based on periodic appraisals using standard commercial real estate appraisal methodology. Since these appraisals are done only periodically, the NCREIF index responds only sluggishly to changes in real estate values. So it’s probable that the NCREIF index underestimates the actual decline in real estate values during the crisis.
Figure 12.3 compares the two indexes, NAREIT and NCREIF, starting at the peak of the NAREIT returns in the first quarter of 2007. Notice how the NAREIT return starts to react negatively to the first signs of financial distress in the summer of 2007. At that time, two Bear Stearns hedge funds that were heavily committed to CMBS securities ran into difficulty. In the meantime, the NCREIF index kept rising through the second quarter of 2008. This index based on appraisals kept rising even after Bear Stearns collapsed into the arms of JP Morgan in March 2008. It was only in the fourth quarter of 2008, after Lehman Brothers had failed, that the NCREIF index started to fall sharply. But the 8.3 percent drop in the fourth quarter of 2008 paled by comparison with the 38.8 percent drop in NAREIT returns in that quarter. Investors in REITs panicked as they saw the financial sector teeter on the brink of collapse.

FIGURE 12.3 REIT and Institutional Real Estate Returns during Crisis
Data sources: NAREIT and NCREIF.
Although the two indexes behaved differently during the crisis, Figure 12.3 shows that both have rallied strongly since then. By the end of 2012, the NAREIT index was almost 8 percent above its previous peak in the first quarter of 2007, having risen more than 200 percent from its bottom in early 2009. (Recall that if a market falls 65 percent, it must rise almost 190 percent to get back to where it started). Over the same period, the NCREIF index rose by 24 percent. So the worst financial crisis since the Great Depression of the 1930s has not permanently crippled the commercial real estate sector. However, it did give heartburn to many investors.
REITS AS A SOURCE OF INCOME FOR INVESTORS
I have saved one of the best features of real estate for last. REITs pay higher dividends than stocks do. One reason is that they are required to distribute 90 percent of their income so as to avoid corporate income tax. Consider Figure 12.4, which compares the dividend yields of REITs with those of S&P 500 stocks since 1972. At no time during this period were dividends on stocks as high as on REITs. Dividend yields do vary over time. When REIT prices fell during the financial crisis, for example, dividend yields rose sharply. That’s not because dividends rose, but because prices fell. After all, the dividend yield is the ratio of dividends to prices. Imagine that you are an investor lucky enough (or astute enough) to purchase REITs at the bottom of the financial crisis. In December 2008, the average dividend yield on the NAREIT index was 7.6 percent! That’s a big change from a dividend yield of 3.7 percent in December 2006.
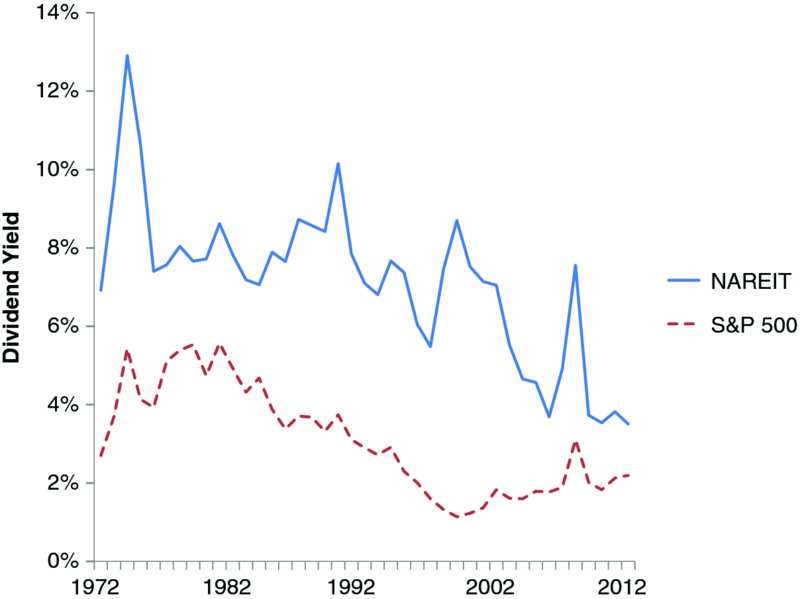
FIGURE 12.4 Dividend Yields of NAREIT and S&P 500
Data sources: NAREIT and Standard & Poor’s.
Let’s compare dividend yields over time. Table 12.3 reports the dividend yields of the NAREIT and S&P 500 indexes over two periods: the full sample period beginning in 1972 and the past 10 years ending in 2012. Dividend yields have been declining for both stocks and REITs over the longer period. The S&P 500 has seen its dividend yield change from an average of 4.6 percent in 1972–1981 to 3.9 percent in 1982–1991 to 2.0 percent in 1992–2001 and to 2.0 percent in 2003–2012. That is one reason why investors have had so much trouble living off the income from their portfolios. But it’s clear from Table 12.3 and Figure 12.4 that REITS have consistently retained their income advantage over stocks. Over the past 10 years, for example, REITs offered an average dividend yield of 4.6 percent compared with a dividend yield of 2.0 percent for stocks. That’s quite an advantage if you are in retirement and need current income.
TABLE 12.3 Average Dividend Yields of NAREIT and S&P 500 Indexes
| 1972–2012 | 2003–2012 | |
| NAREIT Index | 7.1% | 4.6% |
| S&P 500 Index | 3.1% | 2.0% |
Data sources: NAREIT website and www.econ.yale.edu/~shiller, which updates Shiller (2000).
CONCLUDING COMMENTS
There is a strong case for adding REITs to a stock and bond portfolio. First, REITs offer stock-like returns. In fact, REITs have consistently outperformed the S&P 500, at least over the longer run. Second, REITs offer diversification beyond that provided by choosing different types of stocks for the portfolio. At times in the past, particularly in the recession of 2001, REITs have helped to cushion the impact of stock market declines. Third, REITs have consistently provided investors with higher income than stocks. That’s particularly important in today’s low rate environment. Investors need to consider allocating part of their portfolio to REITs.
NOTES
REFERENCES
- National Association of Real Estate Investment Trusts and FTSE. 2006. “FTSE NAREIT U.S. Real Estate Index Series: Frequently Asked Questions.” www.ftse.com/FAQs.jsp.
- Shiller, Robert J. 2000. Irrational Exuberance. Princeton, NJ: Princeton University Press
- Swensen, David. 2005. Unconventional Success: A Fundamental Approach to Personal Investment. New York: Free Press.
- Urban Land Institute and PricewaterhouseCoopers. 2012. Emerging Trends in Real Estate, 2012. Washington, DC: Urban Land Institute.