
The purpose of this chapter is not to get you going on the hardware and the software but to show you how the interconnection between the hardware and software happens in the IoT. You’ll get an introduction here to this concept and then later in Chapter 5 you’ll learn how to do the hardware and software setup when I show you how to install Raspberry Pi, Arduino, and other devices from scratch.
This chapter is designed to show how the entire system is tested and made ready to implement a machine learning model. I will show you step by step how to use the hardware and software to get data from IoT sensors and store that data in flat files. After this, you will do machine learning processes, especially my seven-step machine learning lifecycle process from my book Machine Learning Applications using Python, in Chapter 1. Figure 3-1 shows a block system diagram of how the communication between hardware and software components is going to happen in this chapter.
Testing the Raspberry Pi Using Python
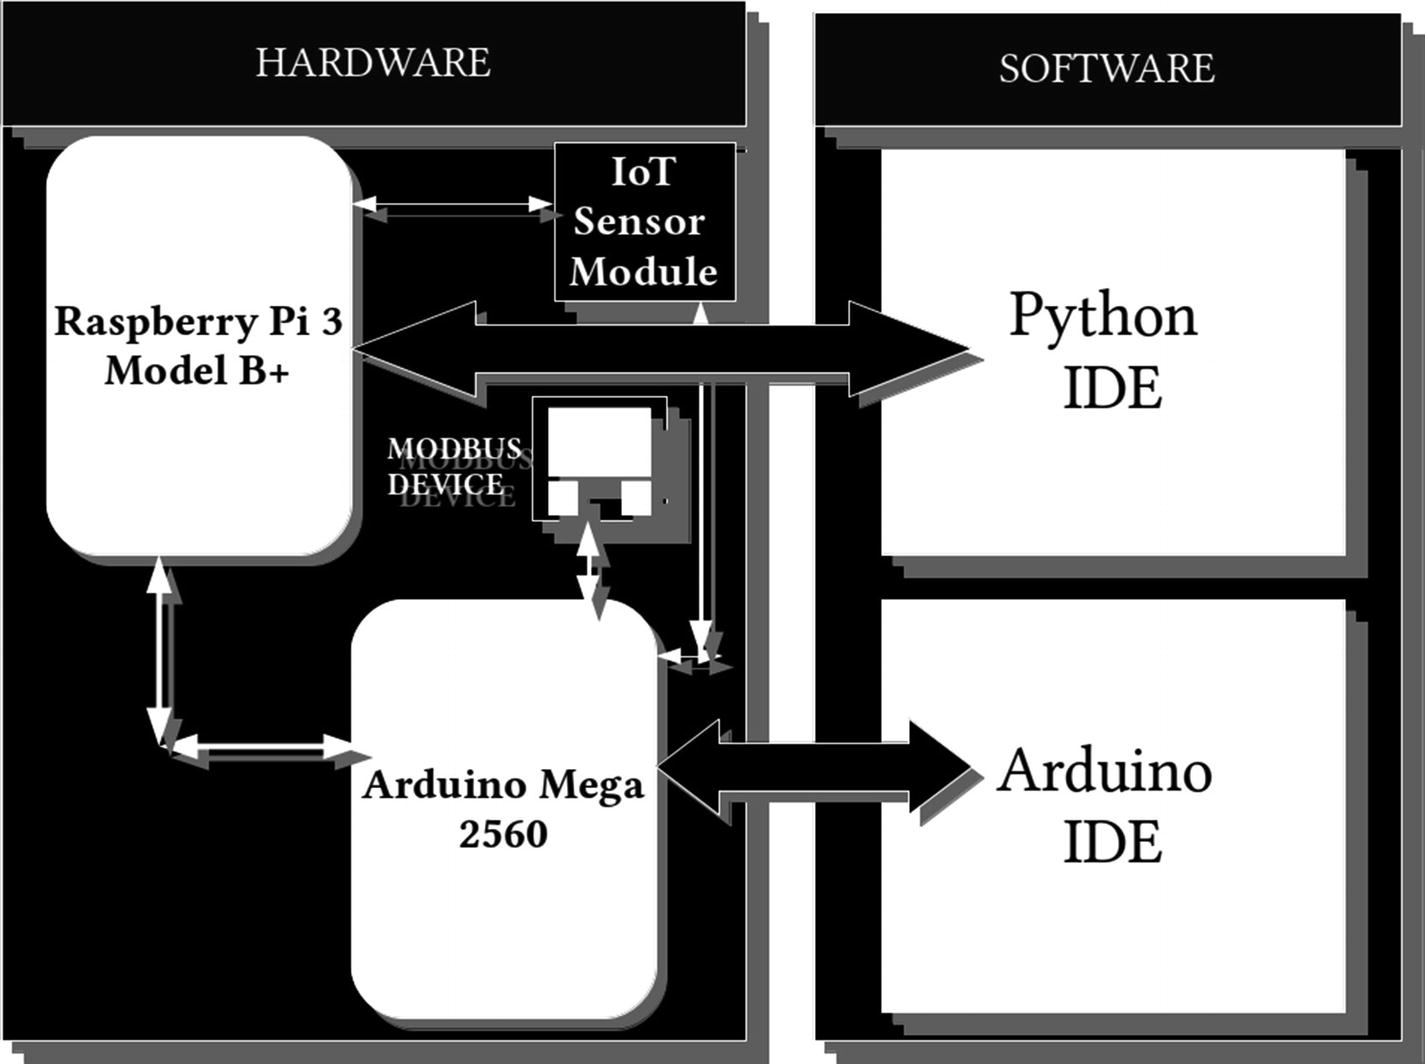
Block system diagram
You can clearly see the two blocks in the system diagram named Hardware and Software. It is important to distinguish between them so you get a clear understanding of the way the IoT- and IIoT-based solutions work. The software layer communicates with the respective hardware component with its own programming integrated development environment (IDE). The Python IDE here is the Thonny IDE on Raspbian; it’s the software component that communicates with the Raspberry Pi 3 Model B+, and the Arduino IDE software component communicates with the Arduino Mega 2560 microcontroller. In the hardware section, this is the most important one to understand. The Raspberry Pi 3 Model B+ is the SBC that acts as a master and hosts the software for Python and Arduino. The software components fully run on the Raspbian. The Raspberry Pi hardware component has GPIO pins inside its board through which it communicates with IoT sensors (remember from Chapter 2 that most IoT sensors are common to Raspberry Pi and Arduino). Raspberry Pi also communicates with the Arduino Mega 2560 via its USB serial port cable and fetches data from it. Please remember that you can add many more devices to the Arduino, especially ones that need Modbus communication to the microcontroller board, than the Raspberry Pi because it has more pins available on its board. The Arduino Mega 2560 communicates with the Modbus devices such as energy meters, etc. Then it gets the data to Raspberry Pi 3 Model B+ back through its USB serial port. In order to create a robust system, you will need to test the communication from the Raspberry Pi Python code and then to its connected IoT sensors or LEDs. After this, you will test the Arduino communication between the Raspberry Pi and Arduino. Once you get the IoT sensor data, you will store it in a lightweight database, SQLite3. In the real world, you could store this in any other database such as Oracle, db2, PostgreSQL, etc. Once you have the data, you need to then apply the machine learning process on top of it to get any meaningful insights into the workings of IoT or any of the connected Modbus devices. In this chapter, however, you will not be using a Modbus device with Arduino but a simple IoT sensor attached to the Arduino microcontroller to test if the serial communication is happening between the master and slave. Let’s go ahead and start testing the system.
Testing the System

Raspberry Pi bootup

Raspberry Pi 3 Model B+ desktop after booting up
Go to the Start button at the top of your Raspberry Pi desktop, click Programming, and then click the Thonny Python IDE. This is the IDE that you will be using for your programming. Please remember that this is not a very professional IDE but a small one to help you get started on IoT projects. It does not have advanced features that an IDE like PyCharm has, but it is good enough to write code and get it executed on Python IDLE.
hello_world.py

“Hello world” Python code on Raspberry Pi 3 Model B+
Successful output means that most of the common libraries like pandas, matplotlib, numpy, and Seaborn are installed and that Python IDLE is configured to give you output. If you encounter any error in this simple Python program on the Raspberry Pi, it could be due to a typo or a library not being installed on your Raspbian-based Python. In this case, you could try installing it using the pip install <library_name> command. Replace <library_name> with the name of library that is giving you the error, such as pandas, Seaborn, matplotlib, etc.
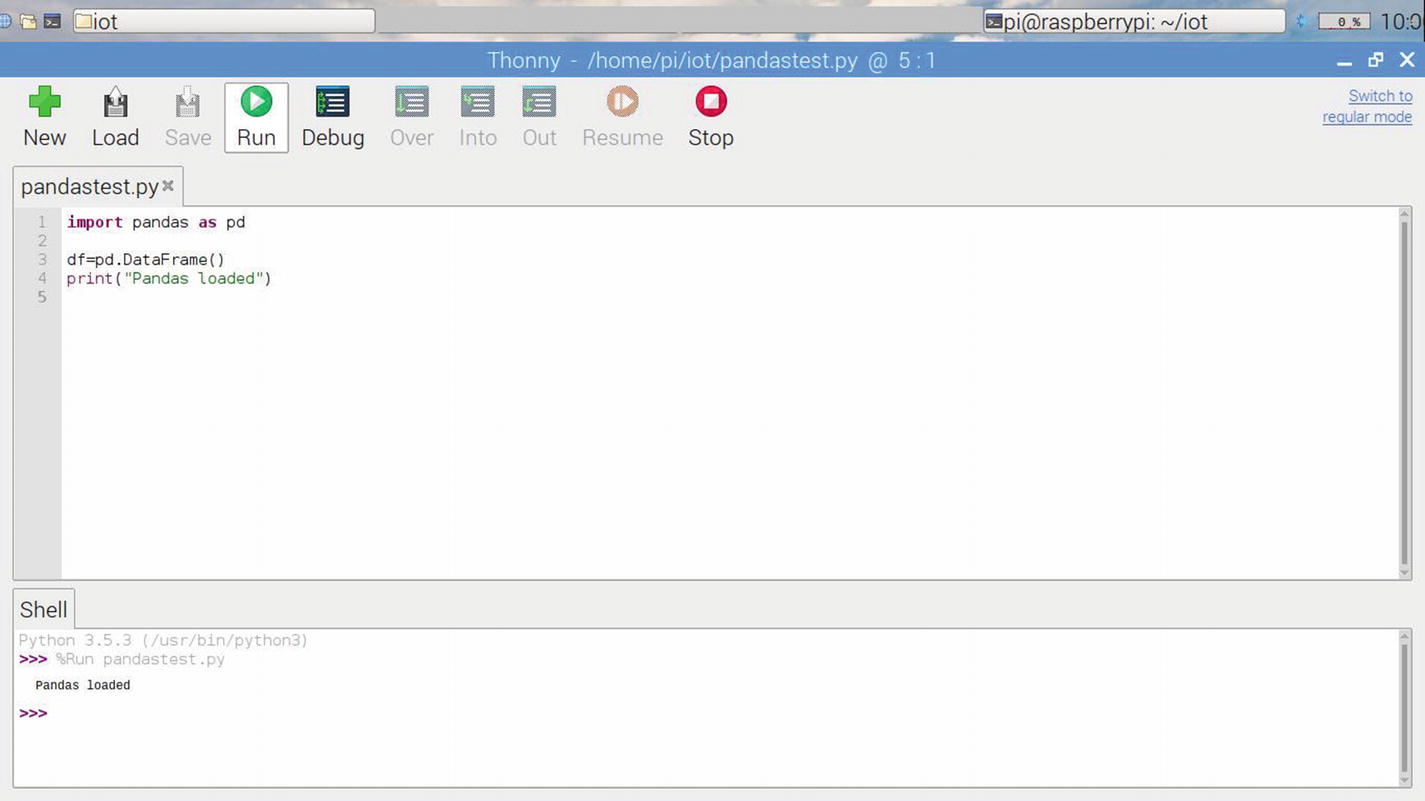
Result of code execution for testing the loading of the pandas dataset

Result of loading scikit-learn on Raspberry Pi
If the scikit-learn library is loaded properly, you should see the output given in Figure 3-6 in the shell section at the bottom. If you get any error from the shell, it means the library is not loaded in your Raspberry Pi system. To load the library, use the command pip3 install scikit-learn. If you need to troubleshoot, refer to the Stackoverflow.com discussion on the topic at https://stackoverflow.com/questions/38865708/how-can-i-run-python-scikit-learn-on-raspberry-pi.
You now have Python and its libraries tested and running. If everything has worked fine so far, the next step is to test Arduino using Python, which you will do in the next section.
Testing Arduino Using Python
Arduino is a microcontroller. As you know from Chapter 2, it is used for communicating with industrial devices using the Modbus protocol. Let’s get started with Arduino.
Arduino programs are written in the Arduino IDE. The Arduino IDE is special software running on the Raspberry Pi system. You are going to use it as a master, and Arduino is going to be the slave that communicates with your IIoT devices such as energy meters. It allows you to write sketches (a synonym for program in the Arduino language) for different Arduino boards. The Arduino programming language is based on a very simple hardware programming language called Processing, which is similar to the C language in its syntax. After the sketch is written in the Arduino IDE, it should be burnt onto the Arduino chipboard for execution. This process is known as uploading to the Arduino microcontroller. In this test, you are going to use the Arduino IDE for testing on a Raspberry Pi 3 Model B+. Please remember Arduino is not a fully functional computer; it does not have its own OS like Raspberry Pi has and that is why it needs a master like Raspberry Pi to monitor, control, and use it. The slave Arduino communicates back and forth between its master and the connected IIoT or IoT devices. Although this looks complicated initially, it becomes easier once you start to test and put together each of the pieces of hardware and software for this system to work.
Arduino Hardware Setup and Communication
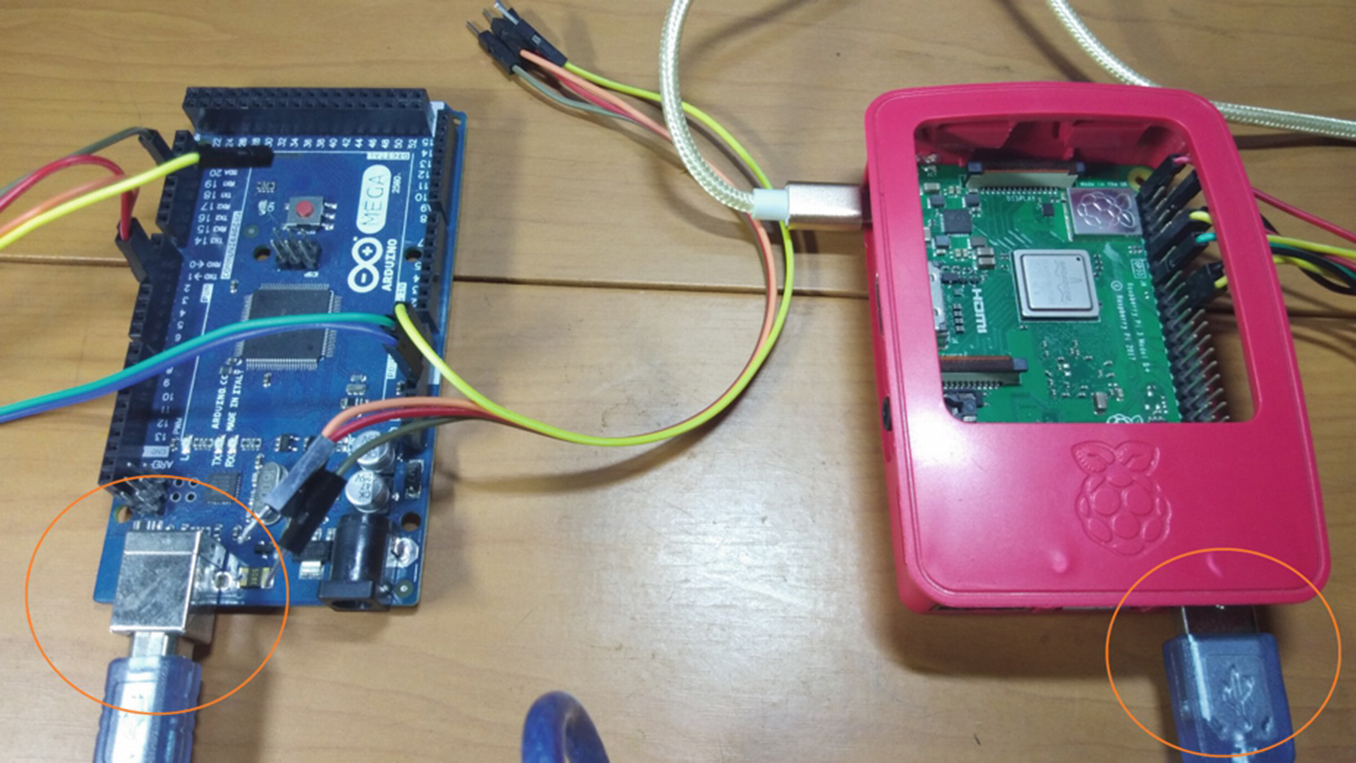
Connected Raspberry Pi 3 B+ and Arduino Mega 2560

Opening the Arduino IDE on Raspberry Pi 3 Model B+
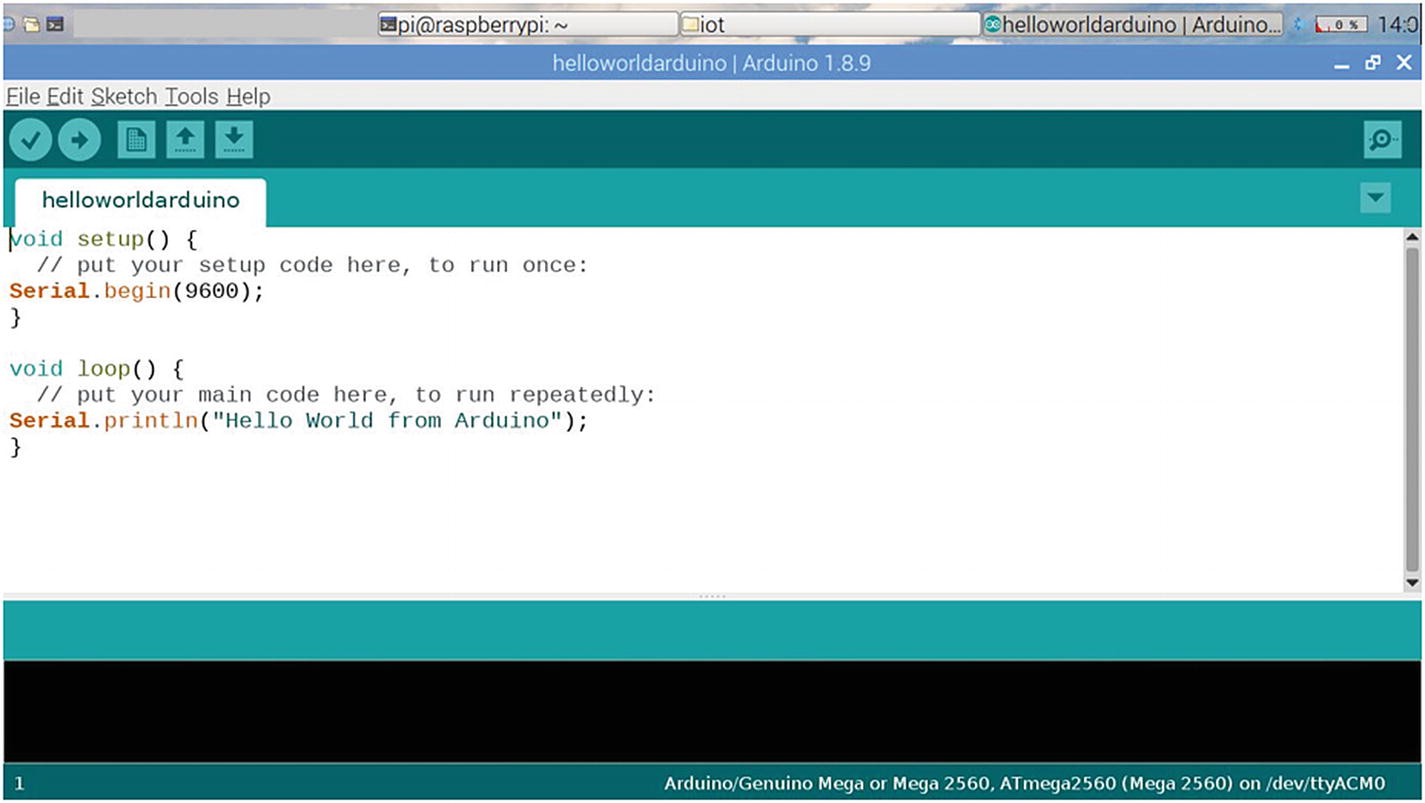
Arduino “Hello world” Program

Default Arduino IDE sketch
The code is self-explanatory and is in the C style and syntax. The first function is void setup() and the comment after the symbol //, which stands for comment, explains that you can put your code here and that you need to run it only once, like initializing any devices or variable values, etc. In the setup function, the body denoted by curly braces, { }, is the area where you write your code. The next function is the loop function, which you want to run in a loop or repeatedly. You may find this confusing if you have a pure software background and may not understand why you need a function that does things repeatedly. Try to understand it this way: a machine or a microcontroller like Arduino cannot function on its own unless there is a program that tells it what to do again and again. It is like having a servant at your disposal who gets bored of staying idle. Similarly, Arduino also needs to do something repeatedly and cannot stay idle. You can ask it to monitor a device and trigger something when a certain event happens or the device is about to malfunction. This is just an example of what you can do with this loop() function ; the applications are limitless. You could turn an LED on or off based on a Modbus device’s input value such as temperature etc. This just requires that the Arduino microcontroller works continuously without stopping, and that is what this loop() function is all about.
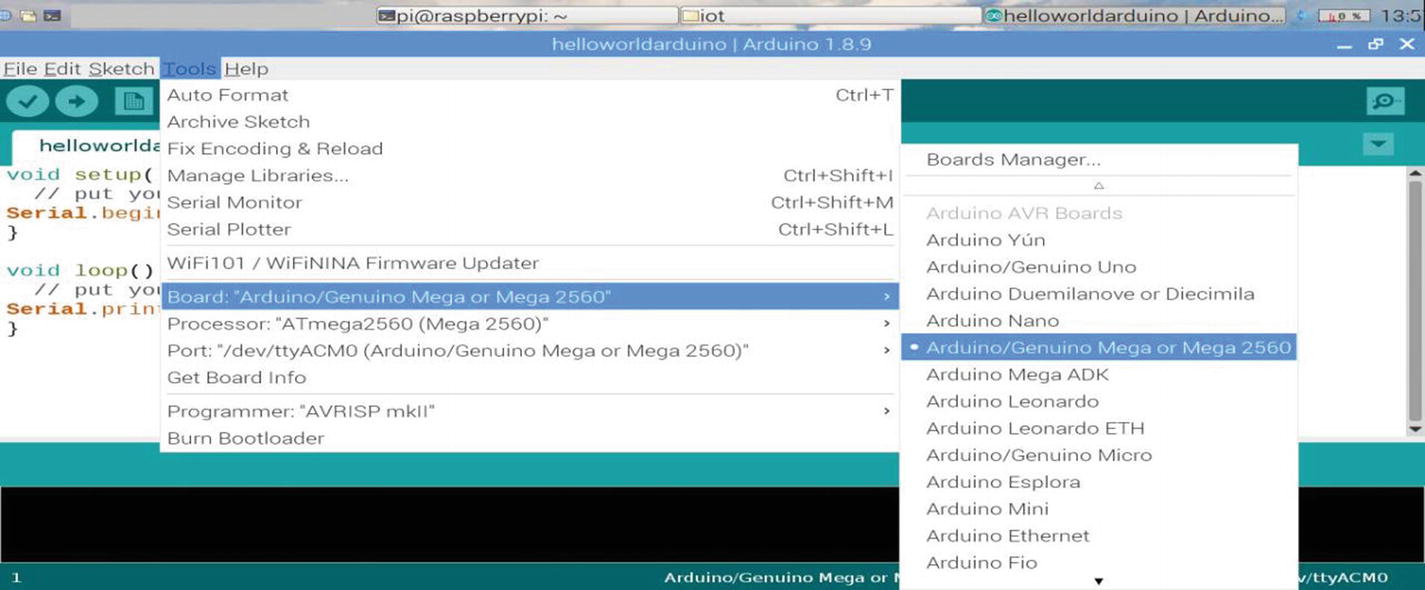
Choosing the Arduino Mega 2560 board
Writing the Hello world program in the Arduino IDE
You will notice that the setup function of the program initializes the serial port with a baud rate of 9600. The loop function contains a print statement to the serial port of the Arduino. In practical terms, this type of program does not mean anything; however, you are trying to test your communication with the Arduino microcontroller. In the next step, if you are able to successfully compile the program, it means you have not made any errors. The common mistakes in this Hello world program are the capitalization of first word (in serial, the letter S has to be capitalized). Another thing to remember is the functions of object serial do not to be capitalized. The begin and println functions are not capitalized. Just like any C or C ++, program every sentence has to end with a semicolon.

Compiling a sketch in the Arduino IDE
Running the Sketch
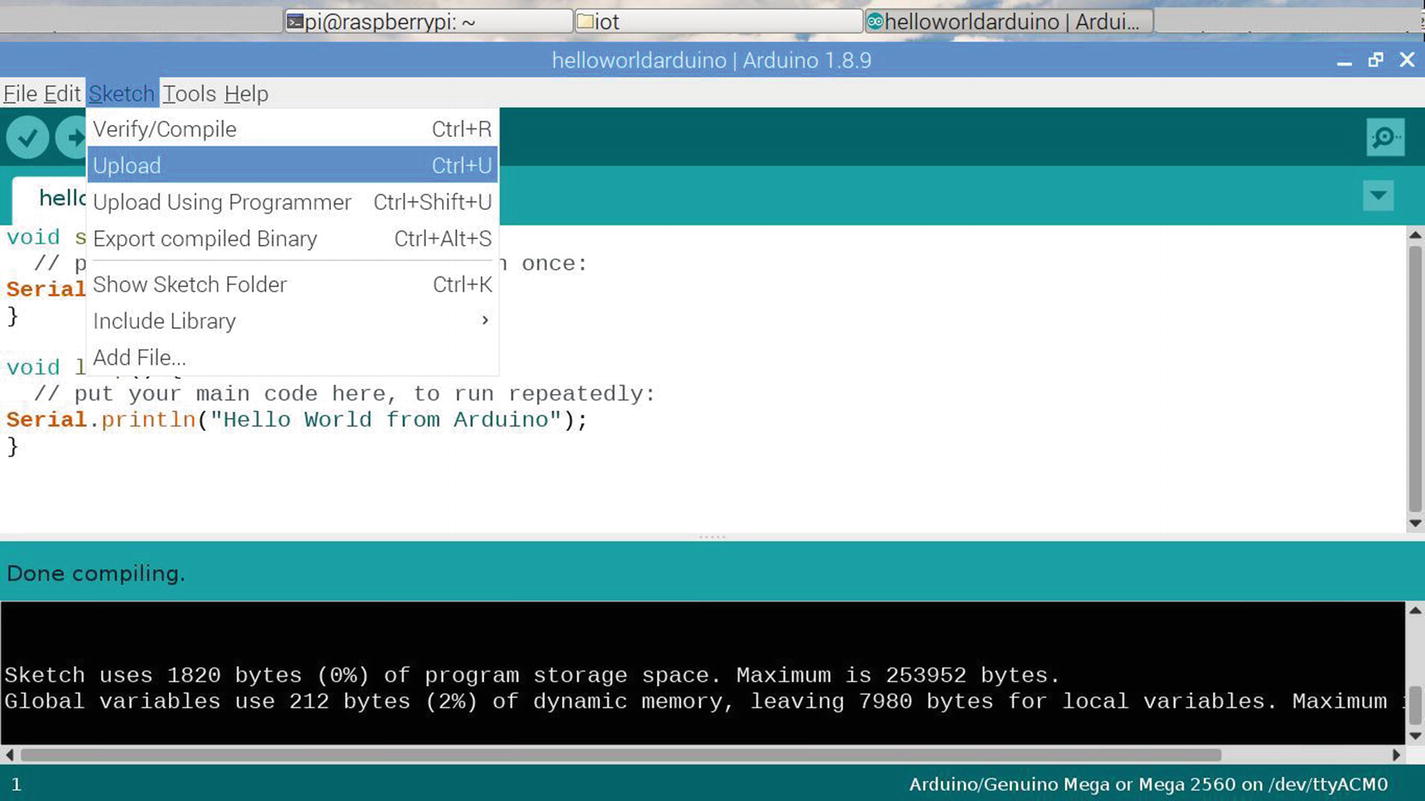
Option in the Arduino IDE to upload the sketch
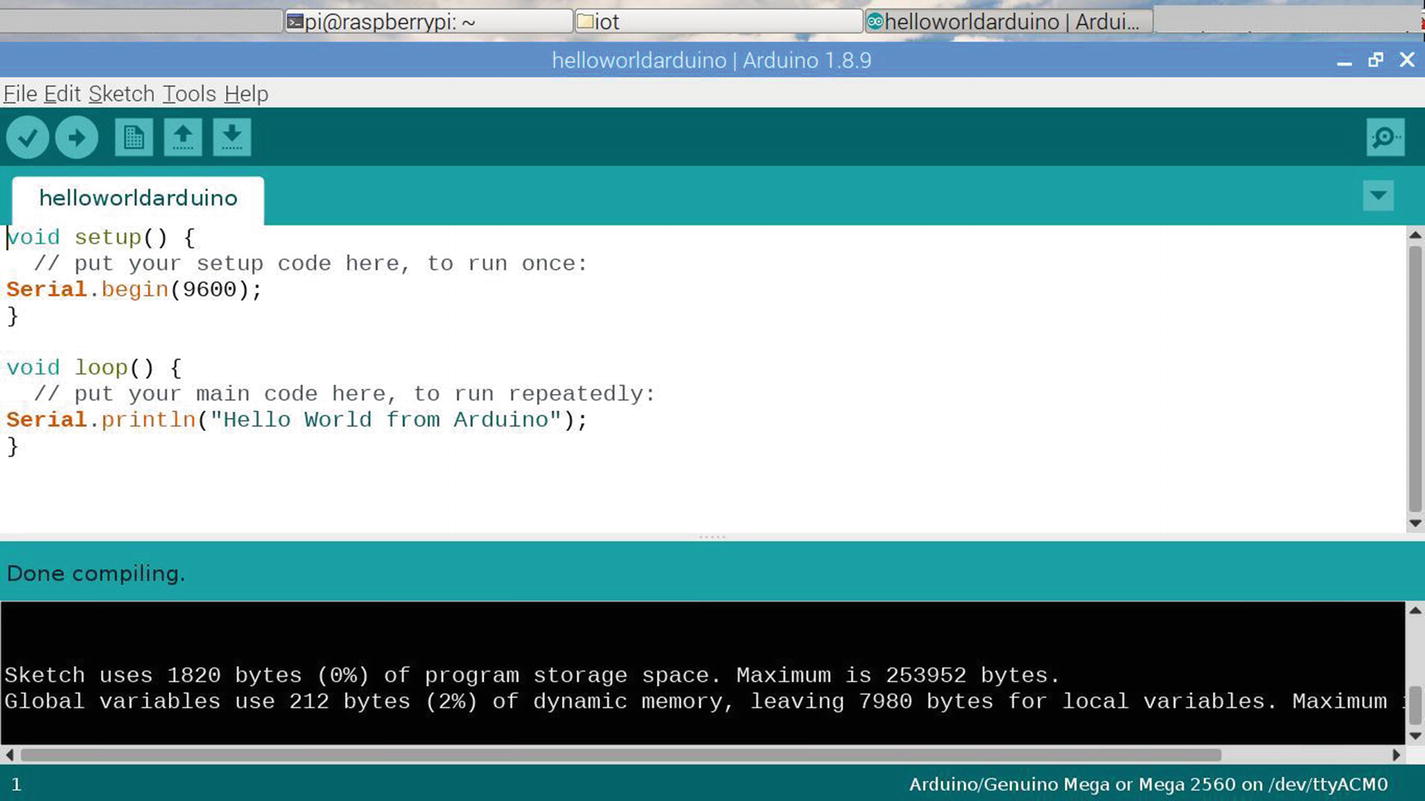
The “done compiling” message on the Arduino IDE
This is the last step of the process to test the Raspberry Pi to Arduino communication. Now you are ready to undertake the next step in getting IoT sensor data from the Raspberry Pi.
Getting IoT Sensor Data with Raspberry Pi Sample Code

Raspberry Pi 3 Model B+ GPIO pin layout
The 40 GPIO pins are clearly visible in Figure 3-15. I explained their use in earlier chapters; however, in this chapter you are going to use them to make a circuit to communicate with things like LEDs and IoT sensors. I will refer to these pin numbers henceforth like, for example, the pin with a red circle with number 1 has 3V marked against it, which means it is to be used to power your device with a 3V current and a pin with 5 volts of power has a red circle, like numbers 2 and 4. Also, you will use the ground pins circled with numbers 6, 9, 14, 20, 30, 34, and 39. The rest of the pins can be used for digital GPIO communication.
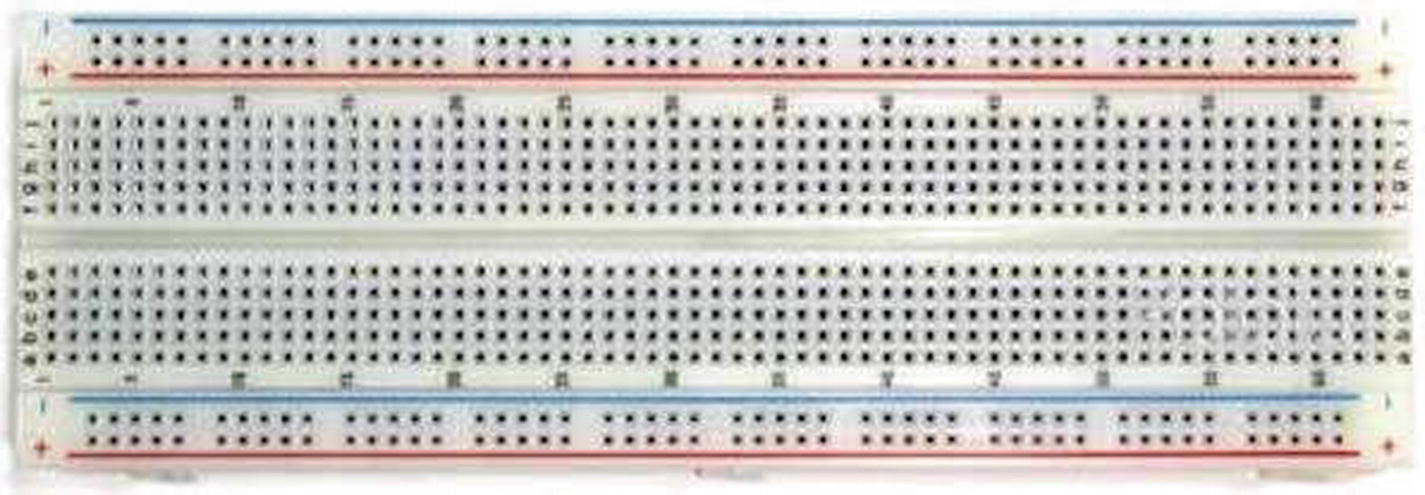
Breadboard for circuit testing
The breadboard, as you can see, has two rails at the top and bottom which have positive and negative holes embedded inside them. The middle partitions with five columns and 64 rows each are used to connect devices such as LED, IoT sensors, or motors. The key thing to note about this breadboard is that underneath the plastic coating is a mesh of circuitry that connects each of the rows together. So if you place a leg of an LED at any middle portion of the row, you should be able to connect to it by placing another wire on the same row. You need not put the wire on the same hole that you insert into the hole the leg of any device. This feature of the breadboard makes it very convenient to work with and does away with the need to solder the circuit together (which is required when working with printed circuit boards). Since the nature of this board is that the entire circuit is based on holes and it is not permanent, you cannot use it for production-level work.
Connecting It All Together
Let’s now connect an IoT sensor on the Raspberry Pi 3 Model B+ board and write a Python program to get data from it. You will learn how to store the IoT sensor data in a database in the next section of this chapter.

Electrical connections diagram of an IoT sensor connected to the Raspberry Pi

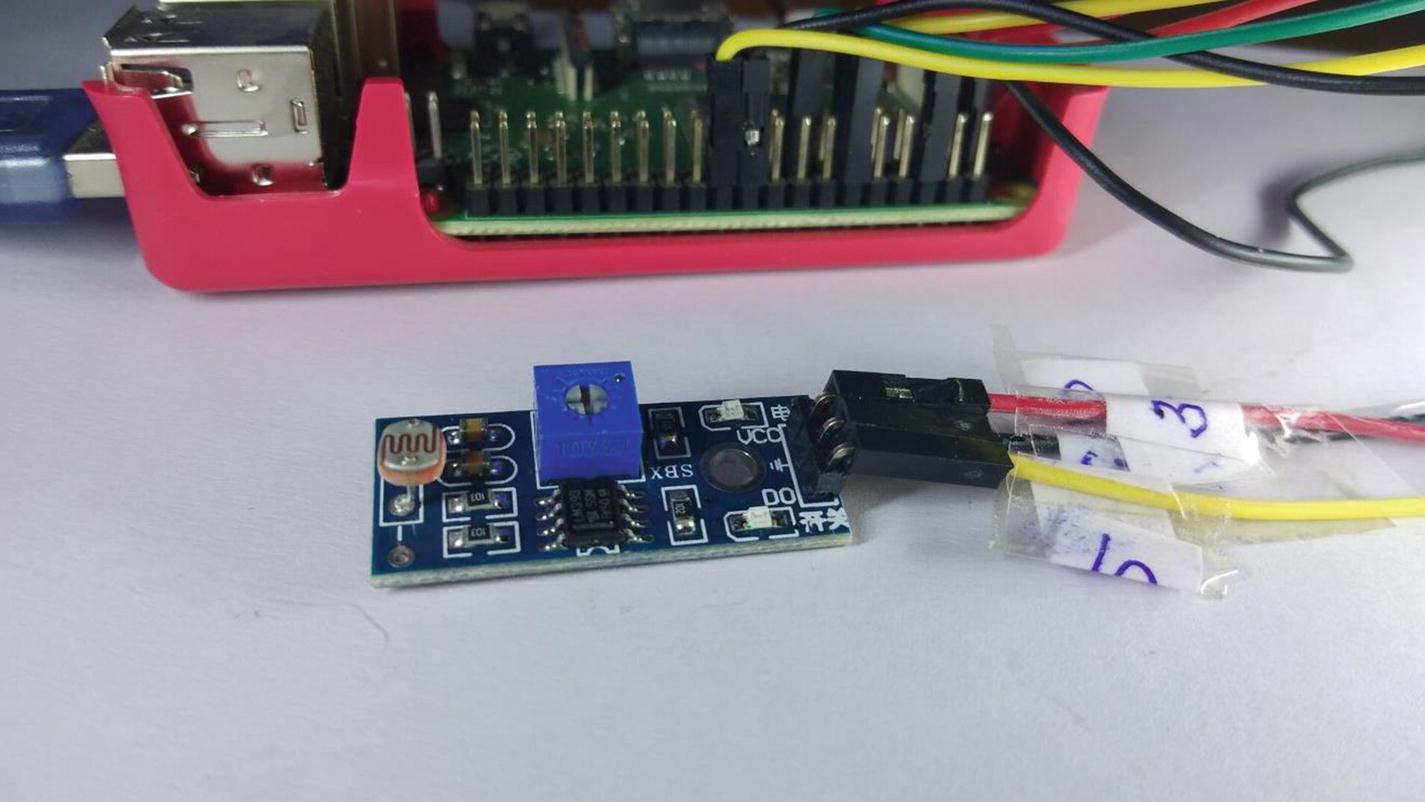
Fully connected LDR module

Fully connected LDR module covering the PE resistor
The point marked 1 in Figure 3-19 is the second LED for digital output, which is off and shows there is no signal being received from the photoelectric resistor to it. The point marked 2 in the diagram is the photoelectric resistor, which is covered by me using a pencil. Anything can be used to cover the PE resistor as long as no light goes through it. Simulation of day and night is for testing purposes; however, in the real world, this sensor works wonders when you place it in an application such as detecting day or night and switching on or off an consumer/industrial appliance based on the result. This data, combined with data from an industrial machine, also helps diagnose critical problems in applications of predictive maintenance, which you will apply in the case studies. You will be storing this LDR IoT sensor data in a database in the next section of this chapter.
Raspberry Pi GPIO Pins to LDR Module Connections
Raspberry Pi | GPIO Pin Number | Light Sensor Module |
|---|---|---|
3.3v Power | 1 | VCC (V) |
Ground | 6 | GND (G) |
GPIO signal pin | 25 | SIGNAL (S) |
Raspberry Pi GPIO pins to LDR module connections
Programming the IoT Sensor LDR Module
Programming the LDR Module IoT Sensor
Output of LDR Python Program
The output is a trial run of the LDR Python program and it works by giving out the floating point values closer to 1, which means it is dark when this program is being run or there is darkness around the LDR sensor module (it may be covered by an object). If you were to light a torch or bulb over the photoelectric resistor of the LDR module, it would start giving a value of 0, indicating there is light around it. You can test this and improve the sensitivity by adjusting the blue square-shaped potentiometer on top of the LDR module PCB. You have come to the end of this section because you are able to achieve getting data from IoT sensors.
Please remember there are many more sensors with many uses and which can be used for simple to complex consumer and industrial applications. The data from any of these sensors would be very similar. The digital output is always on the extreme ends of 0 and 1; however, analog output can be varied and give you in-between readings, which are not in the extremities of 0 and 1. Also, one point to remember is that the accuracy of these IoT sensors deteriorates over time when they are used heavily so you may need to replace sensors that come in contact with water or soil, leading to corrosion of their sensor heads.
Storing IoT Sensor Data in a Database
In this section, I am going to show you how to store data in the SQLite3 database. You will look at how to install this database in Chapter 5 in detail. However, as with previous examples in this chapter, I am making you sit back and have a look at what you can do with the IoT sensors by testing them and putting the system together one by one and accumulating data in a database. In the example in the previous section, you were able to get the LDR module IoT sensor data successfully; however, such data if collected in isolation has no meaning and needs other sets of data to become meaningful. As an example, just knowing whether it is day or night is not enough; if you couple it with temperature IoT sensor data, you can put together a correlation between them to see if light has any relationship to temperature. It would then have some meaning if there was any relationship found.
You will also modify and add new code to the existing code from Listing 3-2 to store it in a SQLite3 database. You can store this data in any other RDBMS or in a flat file like a CSV or JSON format as well; however, here you will use SQLite3 which works well on raspbian.
Configuring a SQLite3 Database

Starting the SQLite3 database
Starting the SQLite3 Database
Once you are logged into the database, it greets you with its version number and the date and timestamp when you have logged in. It displays a prompt sqlite>, which is where you run your commands to work with the databases. There are two sets of commands that work in this prompt: one is the set of commands that start with a dot, such as .databases or .tables, and the other is the set of SQL commands such as select ∗ from <tablename>;. A common beginner mistake is to forget to put a dot before the databases or tables commands and then the SQLite prompt throws out an error. For the SQL commands, do not forget to use a semicolon (;) at the end of each statement; if you don’t, the sqlite> prompt will continue to the next line and your command will not execute.
Code for Database Information for SQLite3

Output of the code for database info commands
Creating the Database Structure
Code for Table Creation to Store LDR IoT Sensor Values

Table creation in SQLite3 for storing IoT sensor data
Inserting Data into the Database
Program to Store LDR Module IoT Sensor Data in a SQLite3 Database
Notice the modifications to the code from Listing 3-2. You added import statements to the SQLite3 Python library; this is necessary to communicate with the SQLite3 database. You also imported the datetime library to get date and time so that you can enter it in the database when inserting the query. The while(true): loop didn’t change; you just added the database insertion code at the end of it. The conn object is used to connect to the iotsensor.db database, where you created a table named ldrvalues; refer to Figure 3-23 for this. The cursor object inside the while loop initializes the cursor with the connection to the iotsensor database. The next statement is an INSERT INTO... statement which enters data into all the three columns: date, time, and ldrvalue. The value entered into time column is taken from the datetime.now() function, which returns the date and time together. Since you want the time and date separately, you first use datetime.date() and then in the second column, you use the datetime.time() function to get only the time value out of it. You separate the date and time instead of creating a single column because when you are doing EDA it becomes convenient if your date and time are in separate columns; it’s easier to find trends with date and time. Although you can do the same operation for taking out date and time from the column during EDA, you save yourself some cumbersome functions at the time of querying it. In a practical world, however, you may rarely find these two values of date and time separate and in the same column known as a timestamp. After the query is done, you use the curr.execute(query) to get the insert into the statement executed by the SQLite database engine. This is the stage when you are likely to get an error if you have a syntax problem in your query.
Checking the Data for Sanity

Program execution result of ldrdb.py
You can see that the program has inserted about 1316 rows in a few minutes. The structure of the table can be seen in the execution of the pragma table_info(ldrvalues); statement . The pragma statement has a function named table_info and takes the argument of the table name of the connected database. In your case, the connected database is iotsensor.db and the table is ldrvalues. It has three columns, which you can see as an output of the pragma statement. The first one is date, the second is time, and the third is ldrvalue. Their respective datatypes in the SQLite3 table are given beside each of them. After this, you run a query of select count(∗) from ldrvalues to get the count of total rows. Next, you look at the count of all the values in ldrvalue column which are not equal to 0.0, which stands for day. Any value in this column shows darkness or night. You should understand through the demonstration of this simple program how the IoT sensor data can be stored in databases and used.
Next, I am going to show you a full-fledged Python program that uses the internal Raspberry Pi CPU to measure its temperature and store it in a database. The program is going to simulate that it is measuring data from an industrial device or an IoT sensor and storing it in a database. After this, through a separate program, it is going to create a graph to display the data as you would do in a real-world IoT application. In the next section, you will apply and build a machine learning model. It is really going to be exciting when you get this data from the internal Raspberry Pi SBC board and then store it in a database for use in a machine learning model later. Let’s get started.
Code for Simulating an IoT-Based Solution
Although what you see is a large chunk of code, the real purpose is to show you how a practical Python-based IoT application is built. The only simulation you are doing is instead of getting data from an actual IoT sensor, you are taking it from the internal hardware IoT sensors embedded in the Raspberry Pi. The concept of temperature and the percent values are applicable to industrial devices such as heat exchangers or boilers, which have a mix of values in temperature and percentages and some absolute values as well. The electrical devices have various values ranging from frequencies to voltages. All this makes up the data you will use in the case study examples because there the data is going to come from the actual IoT sensors connected to the Raspberry Pi and Arduino.
The code first initializes and imports the required Python libraries like CPUTemperature from the gpiozero library. This is the one that is going to get you the internal Raspberry Pi temperature. You also import libraries like datetime to get the time and date of when the data is generated, the pandas dataframe to store the data temporarily, and an imported LED to give a status of green, orange, or red through the lighting of the appropriate one. For example, if the CPU temperature is less than 55 degrees Celsius, the green LED will light up; if the CPU temperature of the Raspberry Pi is greater than 55 but less than 60 degrees Celsius, the orange LED will light up; and if the temperature is greater than 60 degrees, the red LED will light up. This is exactly how you would implement an advance warning system using IoT sensors if you were measuring outside temperature values. After this, you import pygame to ensure that there is a sound coming out of the Raspberry Pi speaker when the temperature reaches beyond 60 degrees Celsius. This is a critical system for your SBC and if something is not done, the system will hang after a while and the board or its components can also burn. Try to imagine this in an IoT-based environment where you would like to implement such a critical alert system. The library pygame is initialized using the init() function and in the next line, it loads example.mp3, a shrill alerting sound, into memory. It does not play it since you have not given the command yet; it is just loaded into the memory.
In the next section of the code, you initialize the LEDs that will light up according to the CPU temperature. The red LED is at GPIO pin number 18, the green LED is at GPIO pin number 22, and the yellow LED is at GPIO number 17. Make sure the LEDs on the Raspberry Pi have been connected to the right pin numbers given in Figure 3-15.
The advance warning system now comprises a sound for the red temperature and a visual alert using LEDs for the CPU temperature. In a real-world application, you will need these alerting systems plus others like SMS or e-mail alerts for which you may need to configure mail and SMS gateway servers on your Raspberry Pi. We will not be doing this as we are undertaking PoC-level code and this is beyond the scope of the book.
Now you need to initialize the LDR, or light sensor module, at pin number 25, which you did in an earlier section of this chapter. After this, you initialize the pandas dataframe to store data in memory. The reason you are using pandas is that it gives a structure to the data and allows to you manipulate and analyze it as per need in Python. Next is the infinite while loop in which first you get the CPU temperature using cpu.temperature and store it in a variable. The next step is to check the value of the temperature. If it is greater than 60, an alert is displayed on the screen saying “RED ALERT CPU EXCEEDING HIGH TEMPERATURE” followed by the red LED being turned on in the program using the redled.on() function. When this event happens, the other LEDs (green and yellow) should be turned off so you use the off() function for these LED objects so that there is no confusion as to the status of the CPU temperature. You do not want all of the LEDs to glow; only the red LED should glow at this time to show the critical status. The pygame is used to play an alerting sound from the Raspberry Pi speaker using the pygame.mixer.music.play() function . Similarly, there are two other conditions. The next is when the temperature value of the CPU lies between 55 and 60 degrees; the status is displayed on the screen as “YELLOW ALERT CPU NEARING HIGH-TEMPERATURE THRESHOLD” and the yellow LED is turned on using the on() function and the red and green LEDs are turned off using their respective off() functions. There is no sound played because this is not a critical situation; the sound plays only when the temperature reaches a critical limit of 60 degrees. You may wonder how I came up with this number of 60 degrees Celsius. I simply referred to the Raspberry Pi manual, which came with it, and it mentions a range of 30 to 60 degrees Celsius. The next is the green status where the CPU is safe and does not need any alerting, but for someone watching the screen, a message of “TEMPERATURE IS NORMAL” is displayed. The green LED is turned on using its on() function and the yellow and red LEDs are turned off using their respective off() functions. Once you have this status of the CPU system in the variable tempstatus, you need to store it in a pandas dataframe and this is done by storing the date and time using the datetime now() function in the df['date'] and df['time’] columns. df['temperature'] stores the temperature from the tem variable. The df['tempstatus'] column stores the value that you get after going through the if condition for the tempstatus variable of “GREEN,” “RED,” or “YELLOW.”
Now you need to prepare to write the data into the SQLite3 database, which is done in the import statement import SQLite3. Then you initialize the connection object to the machinemon.db database. A curr cursor object is created after this to help parse the table if needed. Before you can write to the dataframe, it has empty values for some of the columns like cpu_percent, memory_percent, disk_percent, and LDR value. The cpu_percent variable is used for storing the CPU percentage value, the memory_percent variable is used for storing the memory percentage value, disk_percent is used for storing the disk percentage value, and the ldrval variable is used for storing the LDR module value of day or night.
Output of Running machinemon.py
Database Structure for Storing Data from machinemon.py
This database structure needs to be created before you can start the execution of machinemon.py because if the back-end database structure does not exist, it will throw an error and the program will fail. Here you first create a new database connection to the database named machinemon.db and connect to it with the statement SQLite3 machinemon.db. Once this is done, in the code you look at basic data by running the dot commands .databases , .tables, and .schema, which tell you about the database’s path, the tables that exist within the database, and the schema of the tables or the structure of the tables. In your case, the table is machinedata, which comprises of the following columns: date, time, temperature, tempstatus, cpupercent, diskpercent, memorypercent, outage, and ldrvalue. The uses for these columns were shown in the code execution in Listings 3-9 and 3-10.
Creating the IoT GUI-Based Monitoring Agent
Code for Machinemon Application Monitoring Agent
This agent runs on Python 3.6 as the library used is the tkinter GUI library. To run it, you simply type on the Raspbian command line python3 mmagent.py. Please note the use of python3 and not just python. Just typing python will invoke the Python 2.7 compilers whereas typing python3 will invoke the Python 3.x compiler. To make the code in Figure 3-38 compatible with Python 2.7, you may first have to install the Tkinter GUI python library and then change the code to import Tkinter instead of the small case tkinter. The difference between the uppercase and lowercase can make it confusing for people who do not understand the significance. A StackOverflow discussion on this topic may help you understand this better; go to https://raspberrypi.stackexchange.com/questions/53899/tkinter-on-raspberry-pi-raspbian-jessie-python-3-4.

Running the LED Monitoring Agent Application
The entry in the crontab above runs the command python3 /home/pi/iot/mmagent.py each day at 10 a.m. and the LED monitoring agent checks the LED status and outputs the values on the screen and sends an alert through email if the status at that time is RED. You can modify the crontab entry to check every few minutes.
In the last section of this chapter, you’ll apply a machine learning model on the simulated sensor data that you gathered in your SQLite3 database.
Applying Machine Learning Model on the Sensor Data
Machine Learning Application on Simulated Sensor Data
As you can see from the code, it starts by importing the Python libraries you are going to use in your program later, like pandas and SQLite3. You then initialize the connection to the machinemon.db database and create a cursor for the connection object. This time, instead of using a query string to create a query, you use the pandas object pd and the function under it, read_sql_query(), by passing the sql query and the conn object to connect to your database through the SQLite3 driver. The entire machinedata table from the machinemon.db database is transferred to the pandas dataframe df using the code df = pd.read_sql_query("select ∗ from machinedata;", conn).
The next part is EDA where you look at the size and shape of the dataframe df using df.columns and df.size statements. In the next part of the code, you use the astype() function to convert the outage to an integer because it contains values of 1 for Yes to outage and 0 for No to outage. The tempstatus column contains values that are non-numeric (RED, GREEN, and YELLOW); they need to be mapped to 0 for green, 1 for orange or yellow, and 2 for red. You need to do this because the machine learning libraries in Python can’t handle non-numeric values and need numeric data to compute. This conversion is also known as creation of dummy variables through the statement idf['tempstatus'] = df['tempstatus'].map({'RED':2, 'ORANGE':1, 'GREEN':0}) in the code.
The next part of the code is to check if there are any missing values, which is not the case since you have your own program inputting values into the database and there is no human intervention during this process.
You do exploratory data analysis using the df.describe() function of the pandas dataframe object df. After this is done, you then look at the correlation between the variables to check if any strong relationship exists. After determining this, you move to divide your dataframe into a target and features. The target is what you want to predict. In your case, it is an outage. You want to predict the outage and see when it happens. You drop outage from the features since it is your predictor.
Now you can start creating your training and testing datasets. For this, you use the train_test_split function from the sklearn library. You know that outage, which is your predictor, can have a value of either 1 or 0. 1 means there is an outage and 0 means no outage. So this is a classification problem. You use a simple classification algorithm: logistic regression. You can use others like Naive Bayes or SVM to look at how the accuracy of the prediction improves or not.
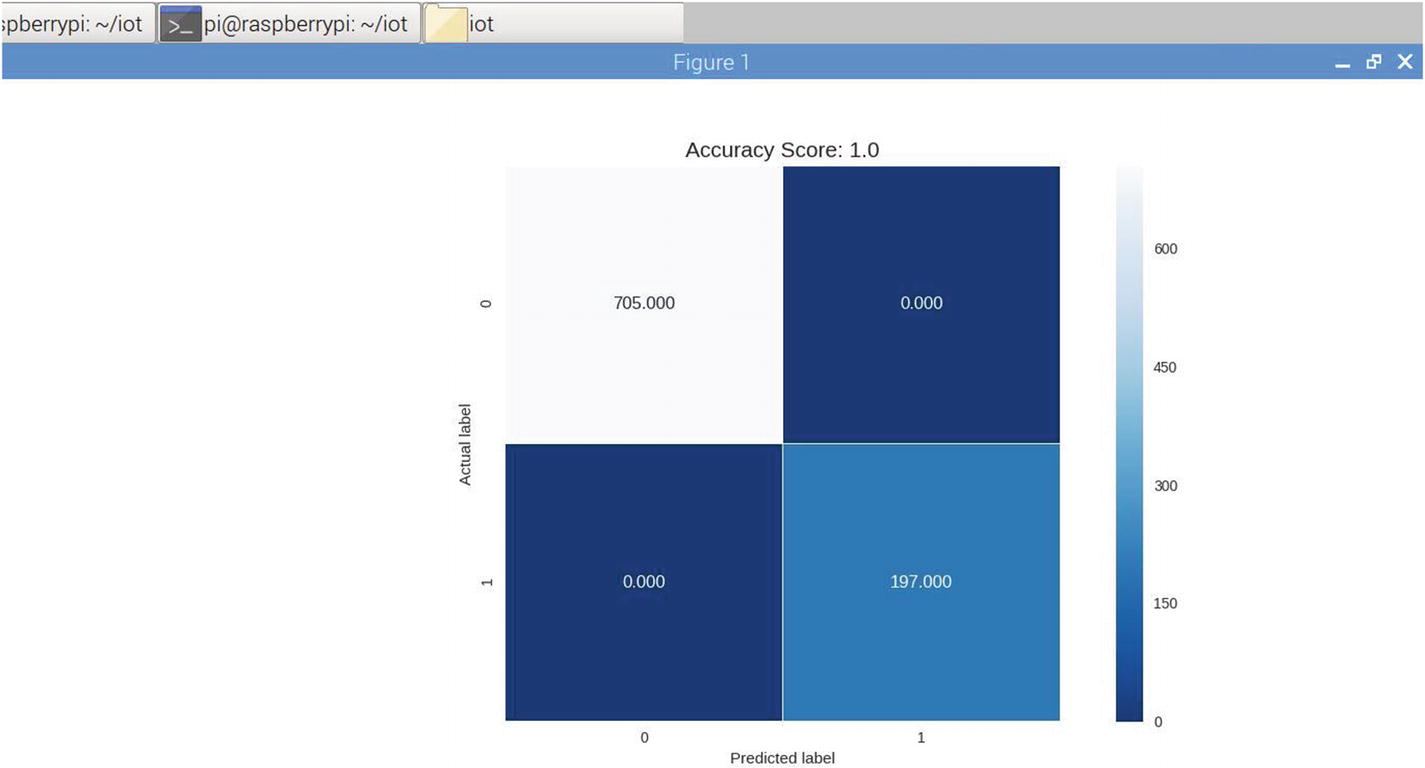
Heatmap of the accuracy score
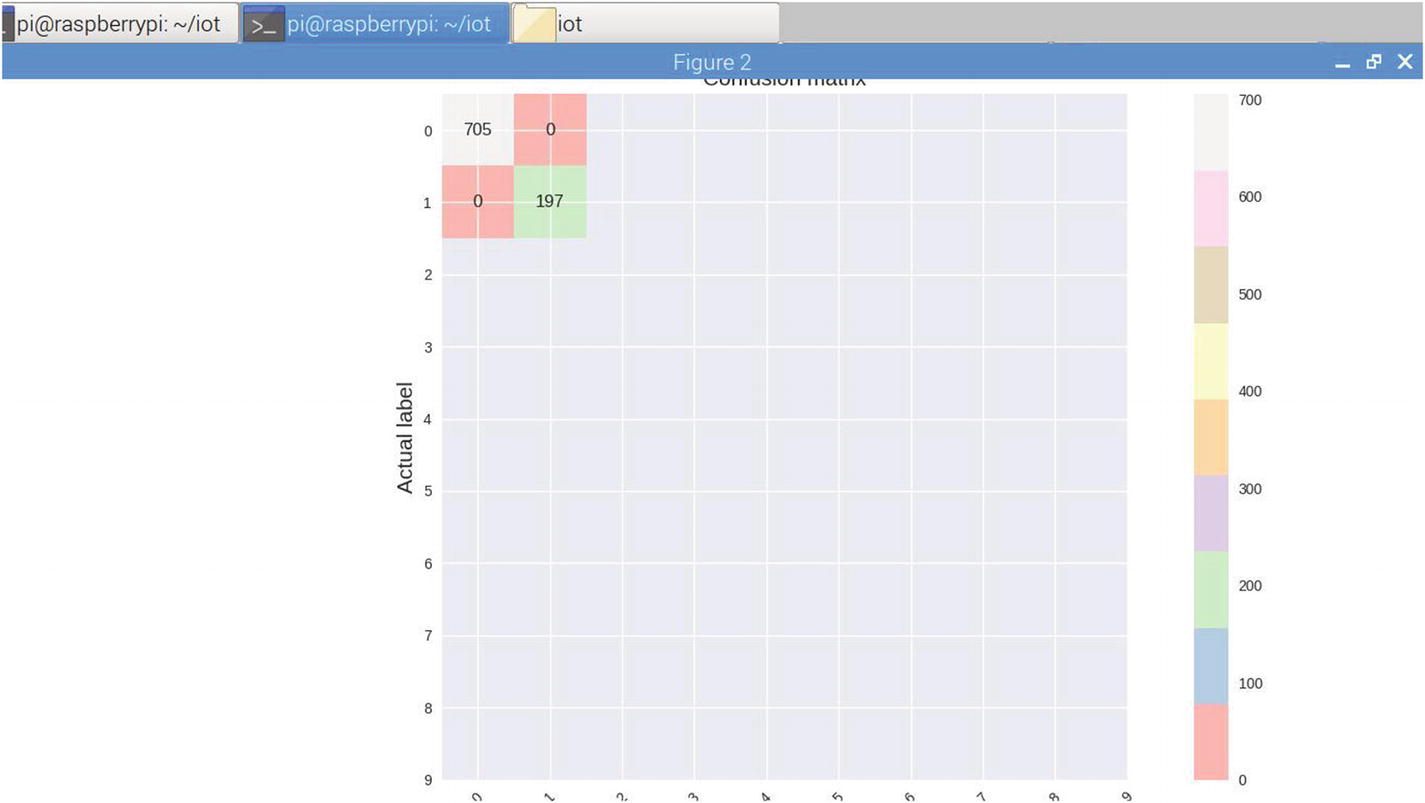
Confusion matrix
Summary
In this chapter, you looked at Raspberry Pi using Python and the overall block diagram of this IoT monitoring application. You tested your system by writing a Python Raspberry Pi Hello world program. Then you tested to see if all the Python libraries like scikit-learn and pandas were loading perfectly or not. Then you tested your Arduino setup using Python to see if it was communicating properly after setting up its hardware. You ran your first sketch by flashing the Arduino's memory with it. Next, you saw how to get IoT sensor data from Raspberry Pi's sample code by first configuring its GPIO pins and then the hardware setup using the breadboard circuit. You then learned to program the IoT sensor light density resistor module through a Python program to detect day and night. The next important part of the program was to store IoT data in a database like SQLite3 by configuring it and creating a database structure. You then ran a Python program to get the data from the LDR module and store it in the SQLite3 database. Then you created a practical Python-based IoT application with advanced warning capabilities based on data from temperature and light statuses, allowing you to create a monitoring agent for it. Then you applied machine learning on top of this collected data from the temperature and LDR module by using a logistic regression algorithm to classify temperature status based on readings from the IoT sensor. You created a visualization of the classification model by building a confusion matrix using the Seaborn Python library and determining the accuracy of your prediction model.
With the visualization of the accuracy score and confusion matrix, I conclude this section and the chapter. You now have a substantial understanding of how the IoT sensor data can be used to apply machine learning on it to get any business results. In Chapter 5, you will look at the setup and installation required in order to execute IoT and IioT applications using Python.