In a continuation to Chapter 5 where you left off by connecting the three-phase Conzerv EM6400 Energy Meter from Schnieder Electric, in this chapter you will do two things. First, you’ll write up the code for getting data from the EM6400 Energy Meter on the Arduino Mega slave and then reading it into Python on the Raspberry Pi master. The second is to set up another energy meter using single phase electrical connections and then read its data directly into Raspberry Pi via the USB serial Modbus protocol. The second setup is to enable those enthusiasts of the IIoT who want to get the feel of how real-life data is generated by industrial devices such as energy meters and machines. In the real world, however, you will see three-phase energy meters and machines like EM6400 communicating through the Modbus protocol. Again, I want to remind the readers that we are using the Arduino Mega 2560 because it is a truly industrial grade SBC that supports connecting multiple devices like energy meters or industrial machines connected to each other serially or in a daisy wheel electrical configuration. If you have just a single device, regardless of single phase, two phase, or three phase, you can connect it directly to a Raspberry Pi 3B+ like I show you in this chapter. So let’s get started writing the code to get data from the EM6400 Energy Meter on the Arduino. The code for this is available in the file named modbus01_EM6400_Tested.ino code bundle that you can download from www.PMAuthor.com/raspbian/. Remember to open it up in the Arduino IDE and configure and test the Arduino IDE like I showed you in Chapter 3 before executing the code.
Coding for the EM6400 Energy Meter
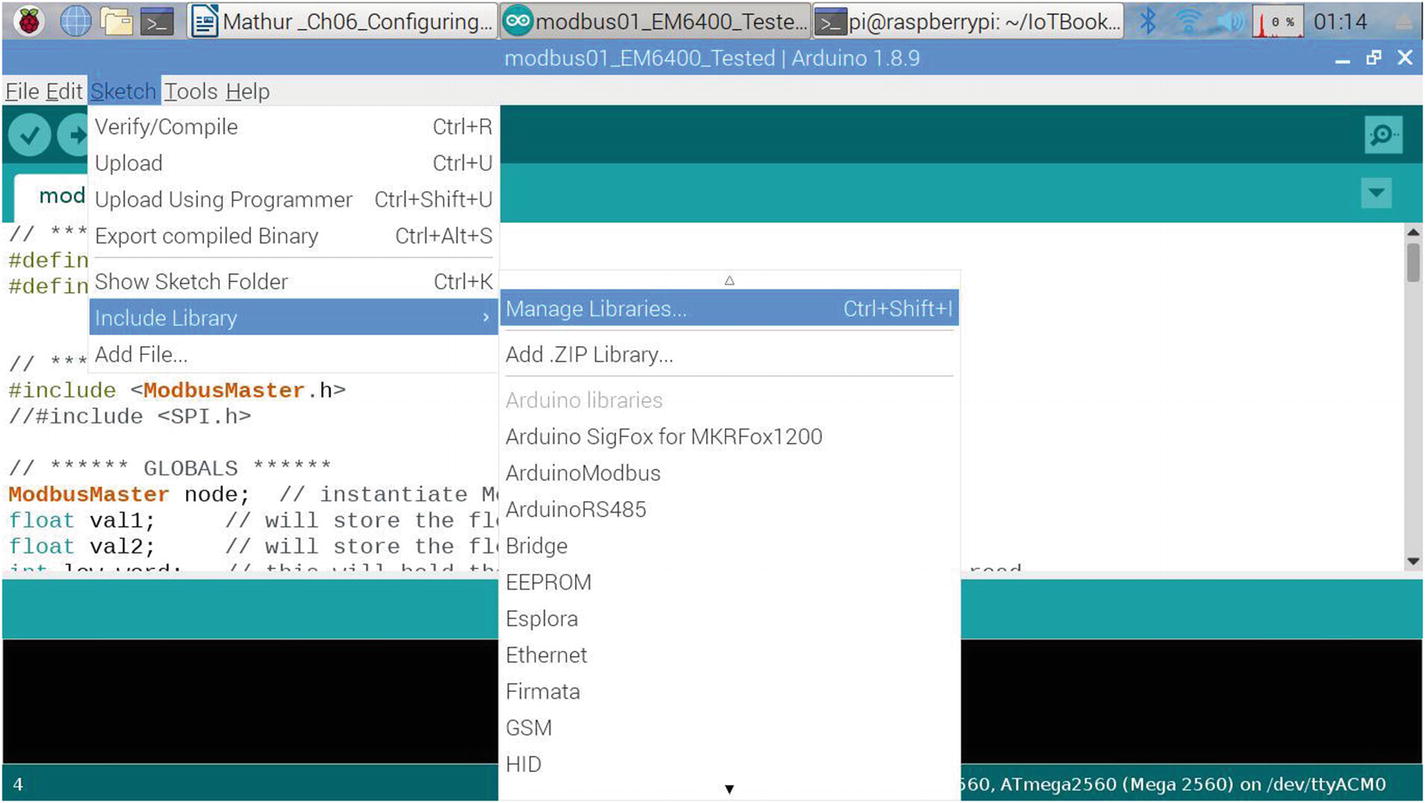
Installing the Modbus libraries in the Arduino IDE is the first step before you start running any code. This is required so that you get some of the C language header files. ModbusMaster.h and SPI.h and other libraries are available to communicate with Modbus through the Arduino slave to your energy meter. You can open the libraries as shown in Figures 6-1 through 6-3.
Figure 6-1
Opening the Manage Libraries menu
Open the Manage libraries menu from Menus Sketch ➤ Include Library ➤ Manage Libraries or use the keyboard shortcut of Control + Shift + I. The Library screen will open up, as shown in Figure 6-2.
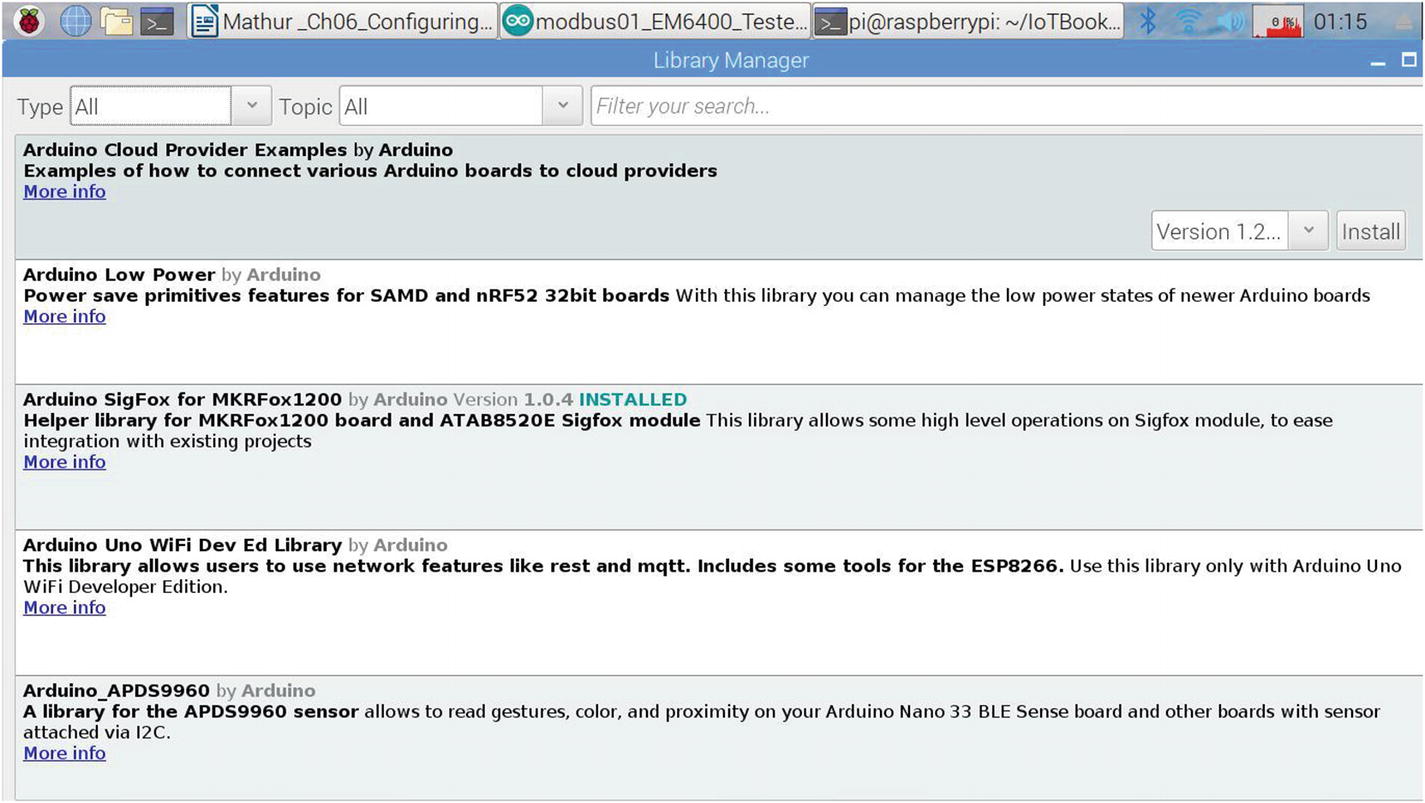
Figure 6-2
Opening the Library Manage section in the Arduino IDE
Now you have the library manager, which is the repository maintained inside the Arduino IDE for libraries installed in its environment. The wonderful things for a developer is that you do not need to worry about where you files are stored or kept or the paths associated with them. The library manager does the job itself; you just need to include the libraries exposed by it in your code. In your case, you need the Modbus library, which provide the two header files noted earlier, so your Arduino program can communicate with the energy meter. Type Modbus in the “Filter your search” field and press Enter to allow the library manager to get you all the libraries that have Modbus within their description. This is shown in Figure 6-3.
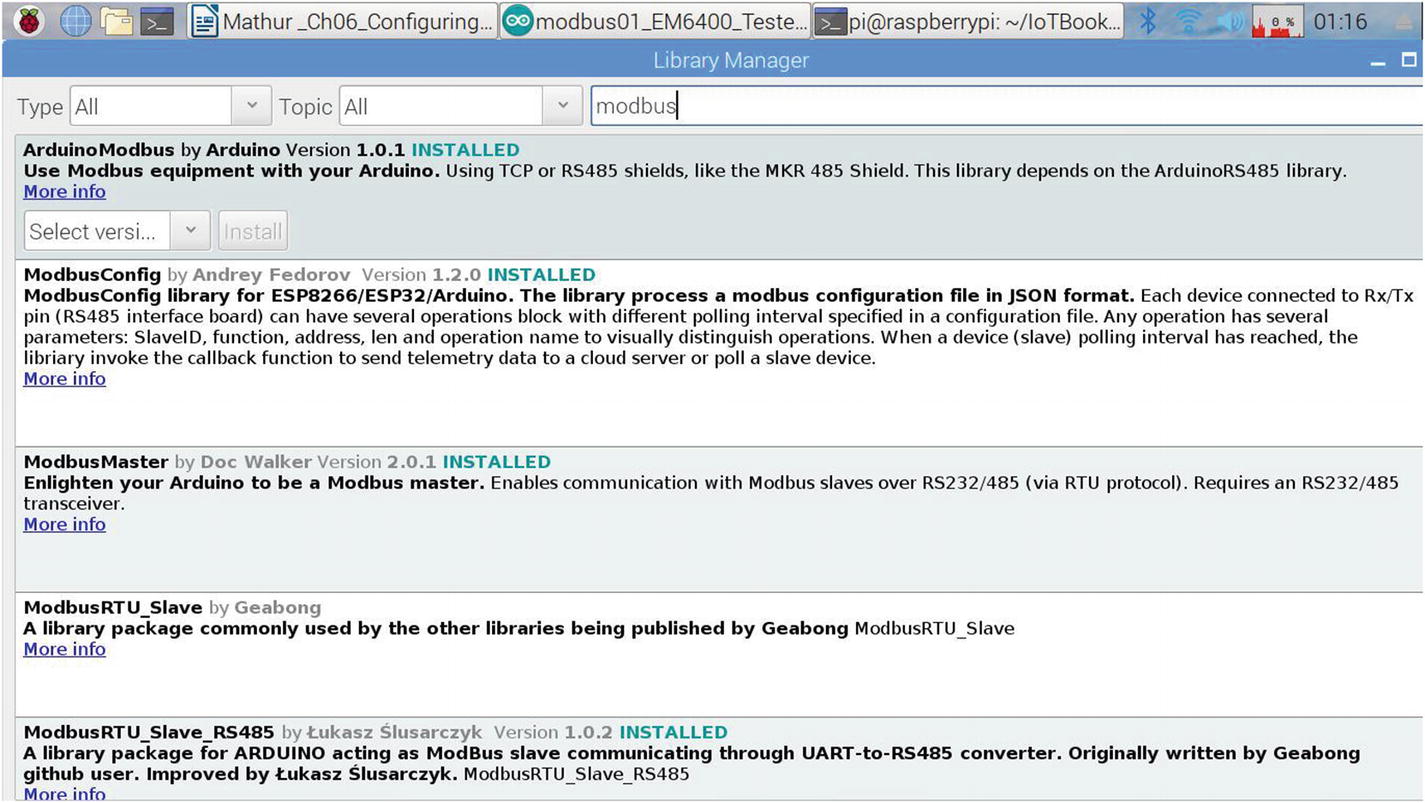
Figure 6-3
Filter search for Modbus libraries
As you can see in Figure 6-3, there’s a listing of many libraries with Modbus in their name. You just need the first one, ArduinoModbus by Arduino, version 1.0.1. Note that you may see a different version when you do this in your IDE because the Arduino organization keeps updating its libraries by fixing bugs and offering enhancements to its users. After you have installed this Modbus library by clicking the Install button below its description, you will see a screen message saying “INSTALLED,” as it says in Figure 6-3. Note that the “Install” button is greyed out because I already have it installed in my environment. After you have successfully done this, you can close the library manager window and return to your code window in the Arduino IDE, as shown in Figure 6-4.
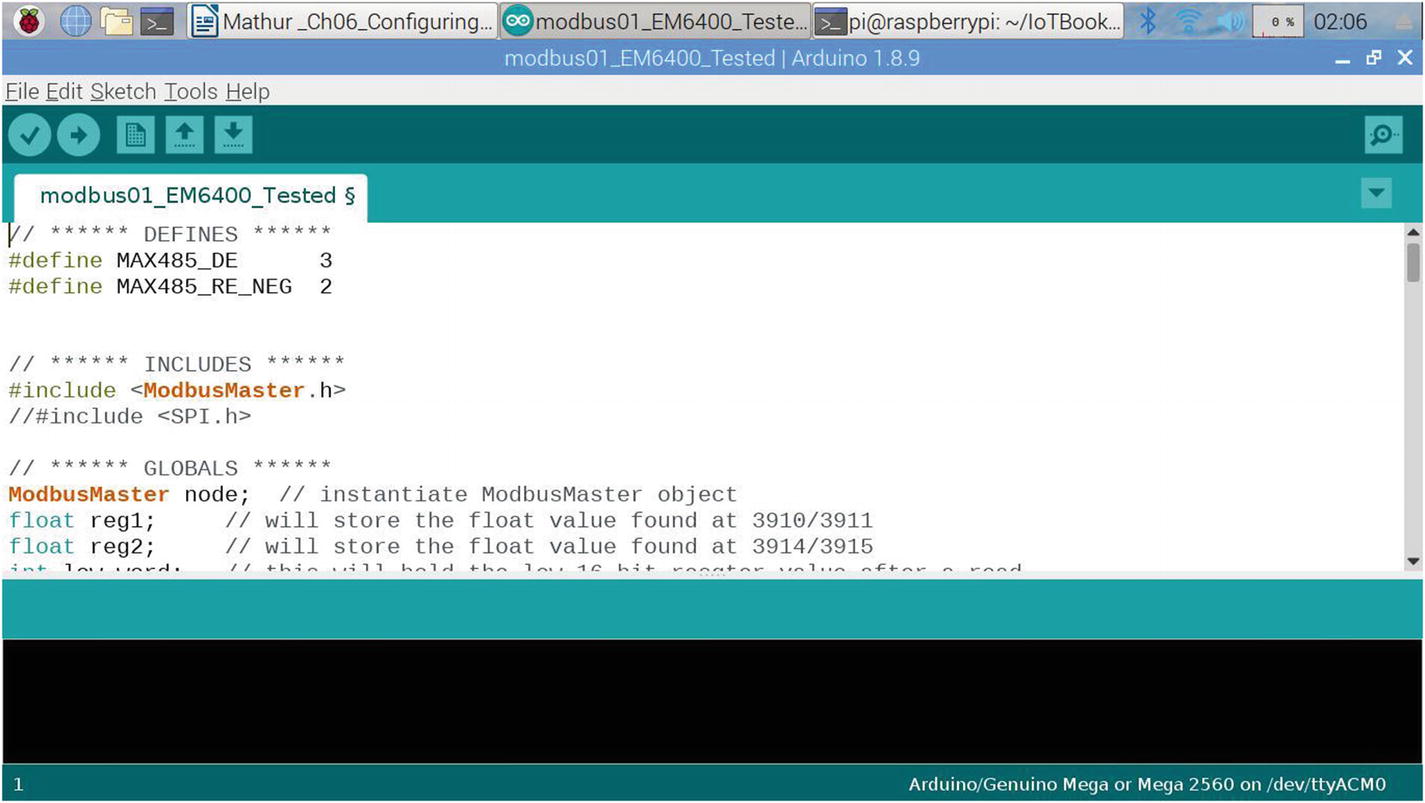
Figure 6-4
Loading the code file named modbus01_EM6400_Tested.ino
In the first few lines of code you see the include statement #include <ModbusMaster.h>. This is the library that has now loaded. After the include statements, you move ahead to declare the global variables, as shown in Listing 6-1.
float reg1; // will store the float value found at 3910/3911
float reg2; // will store the float value found at 3914/3915
int low_word; // this will hold the low 16-bit resgter value after a read
int high_word; // this will hold the high 16-bit resgter value after a read
Listing 6-1
Code for Declaring Global Variables
The first global variable is reg1, which is a float type variable to store the value in registers 3910 and 3911 from the Conzerv EM6400 Energy Meter. The registers are the actual places where values of various energy parameters are found through the Modbus protocol. This information is given in the user manual by Schnieder Electric for the EM6400 at the official URL: www.schneider-electric.com/resources/sites/SCHNEIDER_ELECTRIC/content/live/FAQS/345000/FA345958/en_US/EM%206433%20series%20Communication.pdf. This manual also gives you a simple way to test your protocol using free software under heading “Communication Test” on Page 55. You can try this on your own; it’s beyond the scope of this book so I leave it up to you. The good thing is that the manual describes the entire process with screenshots and it’s extremely easy to understand. Page 57, under the heading “Data Address” gives a detailed table with various electrical data parameters that the energy meter can transmit through Modbus protocol. This table has the individual parameter address and provides information on the register address number that you need to get that particular data. For example, for the data value of Line to Neutral Voltage value (VLN) the register address is 3911. The type of value is float so you use a corresponding variable in the code (Figure 6-5) as float reg1 for register addresses 3910 and 3911 and float reg2 for storing the values of registers 3914/3915. Please note each register is 16 bits so it will have a high word and low word each, so you declare the global variables int low_word; and int high_word; after it is read from the energy meter through the Arduino Mega 2560. Now that you understand the concept of registers and how data is transmitted back from the energy meter through the Arduino Mega, you can look at a union structure for converting them to float values. This is given in Listing 6-2.
// converting to floating point - union structure
union u_tag {
int bdata[2];
float flotvalue;
} uniflot;
Listing 6-2
Union Structure to Store Register Values from the Energy Meter
Here you declare an array of int variable bdata[2], which stores two values: the high and low words from a register. The float variable flotvalue is the one that actually converts and stores the values into a float data type because the actual value that it will be getting is a float data type, which is needed for the program to work. Usage of this union structure will become much clearer during the loop() function of the code, which is later. Now let’s declare some functions that are going to help you complete the process of communicating with the energy meter using the Modbus interface protocol. The sequence of communication is given in Figure 6-5.
Figure 6-5
Communication between the Arduino Mega 2560 and the energy meter
As you can see, there are three transmissions that happen between the Arduino Mega and the energy meter. First there is a pre-transmission, then there is the actual data transmission, and then after the data is communicated back from the energy meter to the Arduino there is a post-transmission. This cycle is important to understand because the code is divided into these three sequences.
You must have noticed in Chapter 5 when you configured the Arduino Mega board and connected the pins to it that there were two pins, yellow and brown, that you connected to pins marked Rx and Tx. These are the ones where the actual communication happens. When data is read through these pins, there is a chip on the Arduino Mega 2560 board named ATMEL MEGA 16U2 whose LEDs light up; you can see them clearly communicating back to the Arduino board as a sign that your connections are correct. This, however, is not a guarantee that you will get back data; that depends on a number of factors such as the correct register and parameter numbers passed in the functions, etc. Pins 2 and 3 are connected to orange and green wires, respectively, on the TTL to RS485 converter module, which in turn is connected to the energy meter. It uses TTL communication to the energy meter; however, with a chip on its PCB it converts it back to the Modbus protocol and vice versa. To get data and to initialize them so that they get ready to transmit data to and fro, you need to define variables, as shown in Listing 6-3.
// ****** DEFINES ******
#define MAX485_DE 3
#define MAX485_RE_NEG 2
Listing 6-3
Defining the Pins for Communicating with the Energy Meter
Please remember that the DX or DE marked by the variable MAX485_DE is communicating through pin number 3 on the Arduino Mega board, which in turn is connected to the Modbus converter module on the corresponding DE male pin marked on it. Similarly, the variable MAX485_RE is negative and is communicating through pin 2 marked on the Arduino board, which in turn is connected to the Modbus converter module on the corresponding RE male pin marked on it.
During pre-transmission and post-transmission the main work of the next functions is to write to these pins to start and end communications. This is shown in the piece of code in Listing 6-4.
// ****** Transmission Functions ******
void preTransmission()
{
digitalWrite(MAX485_RE_NEG, 1);
digitalWrite(MAX485_DE, 1);
Serial.println("preTransmission");
}
void postTransmission()
{
digitalWrite(MAX485_RE_NEG, 0);
digitalWrite(MAX485_DE, 0);
Serial.println("postTransmission");
}
Listing 6-4
Pre- and Post-transmission Functions
The two functions given in the code initialize communication in the function void preTransmission(){} by using digitalWrite(MAX485_RE_NEG, 1);. This function initializes the RE pin# 2 to start writing. The first parameter in the digitalWrite function is the pin number, which is defined in the variable MAX485_RE_NEG, and the second parameter is the on/off binary parameter that enables writing to the pin with value of 1 and stops it by passing a value of 0. Next, MAX485_DE is initialized and then the postTransmission(){} function passes values of 0 to both pins to stop the transmission. Now that you have these functions, you are ready to execute the standard functions for the Arduino Mega, which are the void setup() and void loop(). To recall from Chapter 3, the void setup() function is defined first in the program in order to initialize and set up the code for the Arduino Mega 2560 to start functioning. For this function, you first initialize the output to pins 2 and 3 in order to start controlling the flow of data through them using the Modbus 485 protocol. Once this is done, you need to initialize the receiving mode for the same pins. After which you set the baud rate frequency at which the energy meter has been set to receive and send signals. The default for this meter is 9600 Hz and I don’t intend to change it as it communicates well at this rate. After this, a slave id is defined for this slave. If you have multiple slaves connected to the Arduino Mega board, you can give multiple slave ids to them in this section. After this the preTransmission() and postTransmission() functions are called. As a measure to find out if the communication has happened correctly between the Arduino and energy meter, you can write something like “Hello World.” This is exactly what you see in Listing 6-5.
// ****** STANDARD ARDUINO SETUP FUNCTION ******
void setup() {
// make pins 2 and 3 output pins for Max485 flow control
pinMode(MAX485_RE_NEG, OUTPUT);
pinMode(MAX485_DE, OUTPUT);
// Init in receive mode
digitalWrite(MAX485_RE_NEG, 0);
digitalWrite(MAX485_DE, 0);
Serial.begin(9600); // TX0/RX0 serial monitor
Serial1.begin(9600); // TX1/RX1 Modbus comms
// Modbus slave ID = 1
node.begin(1, Serial1);
// Callbacks allow us to configure the RS485 transceiver correctly
node.preTransmission(preTransmission);
node.postTransmission(postTransmission);
Serial.println("Hello World");
}
Listing 6-5
The void setup() Function
The Serial.println() function is sent as an output to the serial port by the Arduino. So you can use a Python program to read these statements from the Raspberry Pi master to which the Arduino Mega slave is connected. Now that you have your initial configuration for the Arduino done in the void setup() function, you can move on to the last step of defining the main work that you want the sketch to perform with the Arduino Mega. First, you need to read values from the energy meter and for that you need to define variables to hold the results and the data from it, as shown in Listing 6-6.
// ****** STANDARD ARDUINO LOOP FUNCTION ******
void loop() {
uint8_t result;
// Read Line to Neutral Voltage
result = node.readHoldingRegisters(3910, 2);
if (result == node.ku8MBSuccess)
{
high_word = node.getResponseBuffer(0x00);
low_word = node.getResponseBuffer(0x01);
uniflot.bdata[1] = low_word; // Modbus data 16-bit low word
uniflot.bdata[0] = high_word; // Modbus data 16-bit high word
reg1 = uniflot.flotvalue;
Serial.print("Line to Neutral Voltage: ");
Serial.println(reg1);
}
// node.clearResponseBuffer();
delay(500); // small delay between reads
//Read Frequency
result = node.readHoldingRegisters(3914, 2);
if (result == node.ku8MBSuccess)
{
high_word = node.getResponseBuffer(0x00);
low_word = node.getResponseBuffer(0x01);
uniflot.bdata[1] = low_word; // Modbus data 16-bit low word
uniflot.bdata[0] = high_word; // Modbus data 16-bit high word
reg2 = uniflot.flotvalue;
Serial.print("Frequency: ");
Serial.println(reg2);
}
delay(5000); // repeat reading every 5 seconds
node.clearResponseBuffer();
}
Listing 6-6
Code for void loop()
Since this sketch is built on top of C and C++, the functions used in C and C++ and its datatypes also clearly integrate into this language. An unsigned integer of 8 bits is denoted by the datatype uint8_t in the sketch language, which is a compiler with wrapper on a C++ compiler. You define the result variable of this datatype to store the results of the holding registers, which you attempt to do in the next line. The first thing you read is the value of the neutral voltage from the holding register# 3910 using the statement result = node.readHoldingRegisters(3910, 2);. The node object, which is automatically made available in the sketch, is used to communicate with multiple Arduino slaves. In your case, there is only one and you have connected it to the Raspberry Pi. You initialize it using the statement node.begin(1, Serial1);, giving it a serial number slave id of 1 in the void setup() function. So now when you call the node object, the sketch automatically takes it to be this node that you initialized earlier. The second parameter value of 2 indicates the length in bytes of the register mentioned in the first parameter 3910.
The next piece of code uses an if statement to check if the response received from the Arduino slave was okay. In order to check this, you need to first know about the Modbus function codes and exception codes given in the Modbus master library. This is the Arduino library for communicating with Modbus slaves over RS232/485 (via the RTU protocol) (see http://4-20ma.io/ModbusMaster/group__constant.html). While this Arduino library has various variables to use, the specific one you want is ku8MBSuccess, which returns true only when the following checks are found to be okay in the communication between the Modbus master and slave:
1.
The slave ID is valid.
2.
The function code is valid.
3.
The response code is valid.
4.
Valid data is returned.
5.
The CRC is valid. There is no error in transmission of data.
Once this condition is tested as true by the if statement, you get the data values from the register by giving its starting and ending address in the statements high_word = node.getResponseBuffer(0x00); and low_word = node.getResponseBuffer(0x01);. For your reference, 0x00 is the hexadecimal value of 0 for high word and 0x01 is the hexadecimal value of 1 for the second low word. Now you need to concatenate the values of the high_word and low_word variables into a variable of type float. You create a union structure that has a float value variable by name of unifloat. The reg1 = uniflot.flotvalue; statement returns the complete float value of the first register and this is the value of Line to Neutral Voltage. You print out the value using the statement Serial.println(reg1);. Now that you have the value of Line to Neutral Voltage in a variable, you can get the other value of frequency, which is stored in register address 3914. You add a delay of 500 milliseconds; this is optional as it depends on what you wish to do with the data. If you are creating an alerting system that monitors the current throughput to the energy device, you would not want a delay since you want real-time data for both Line Neutral Voltage and the frequency of the current. However, polling the energy meter very frequently can create a load on the Raspberry Pi if you have multiple slaves, and this is an aspect of your application design you will need to keep in mind when you write this portion of the code. The code in Listing 6-7 gets the data from register address 3914, which is also 2 bytes long.
delay(500); // small delay between reads
//Read Frequency
result = node.readHoldingRegisters(3914, 2);
if (result == node.ku8MBSuccess)
{
high_word = node.getResponseBuffer(0x00);
low_word = node.getResponseBuffer(0x01);
uniflot.bdata[1] = low_word; // Modbus data 16-bit low word
uniflot.bdata[0] = high_word; // Modbus data 16-bit high word
reg2 = uniflot.flotvalue;
Serial.print("Frequency: ");
Serial.println(reg2);
}
Listing 6-7
Code for Getting the Values of the Current Frequency
You use the if condition to check if the data transmission from the energy meter to the Arduino slave is successful using the statement if (result == node.ku8MBSuccess). Once it is successful, the if statement block is very similar to the code block in Figure 6-11 except for the use of variable reg2, which you are using to store the float value of the second register, which contains the current frequency value inside the register. Using the statement Serial.println(reg2); you print out the value to the serial bus showing the frequency. Before closing the function void loop(), you add a delay of 2 seconds so that there is some time between successive reads. Again, this delay in time depends on the type of application you are building and can be changed as per the business need of the application. Just remember the less time delay that you have here, the more often system resources like CPU and memory your application are going to put on the three devices: Raspberry Pi 3 B+, Arduino Mega 2560, and the EM 6400 Energy Meter. After this, you clear the response buffer in the statement node.clearResponseBuffer();. This is to ensure that the old values are not collected again and new values come from the register to the buffer and then into the Arduino serial bus.
delay(2000); // repeat reading every 2 seconds
node.clearResponseBuffer();
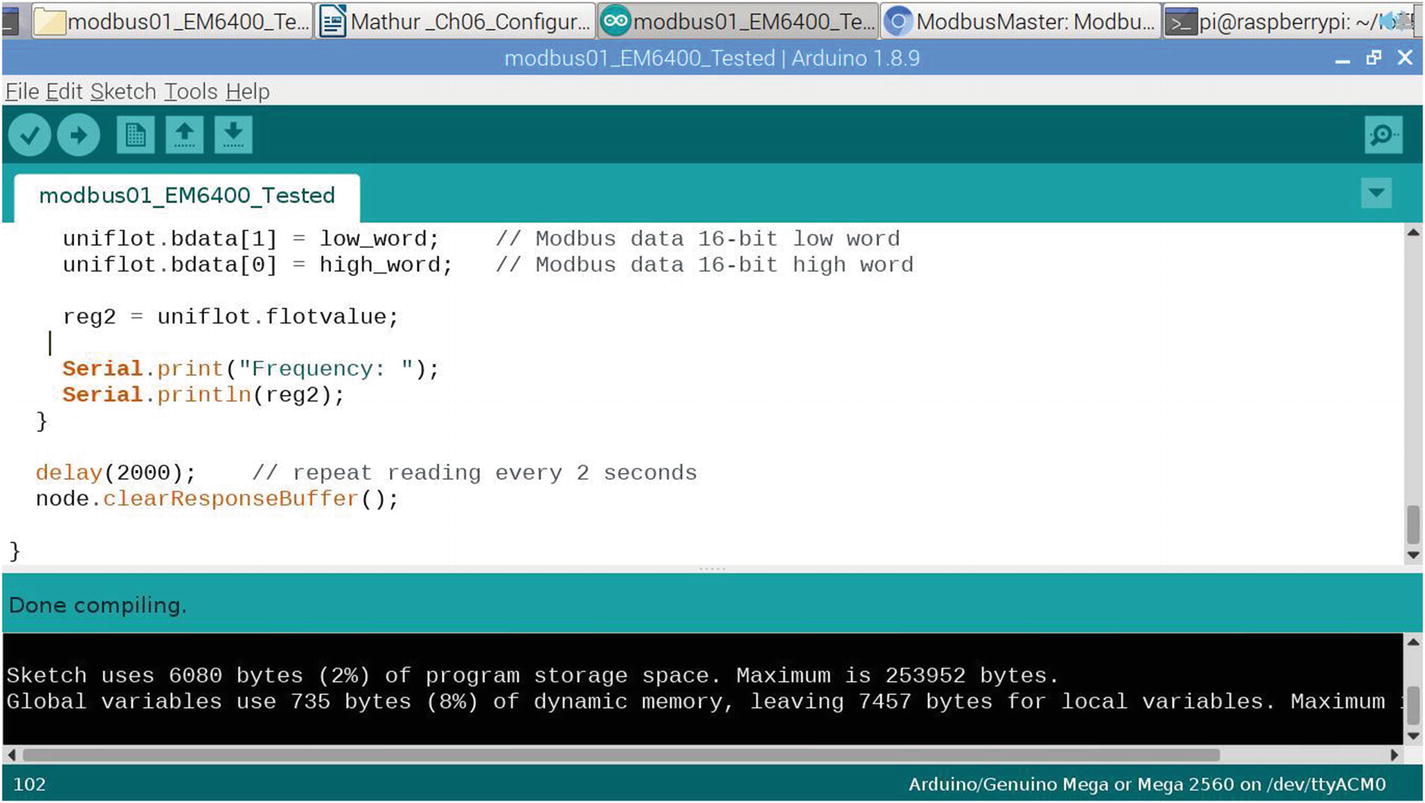
This concludes the code for programming the Arduino side of the program. You can compile it and upload it to the Arduino Mega 2560 by using the steps shown in Chapter 3 and Chapter 5. You should be able to see the code compile success and upload success messages like they appear in Figure 6-6 and 6-7.
Figure 6-6
“Done compiling” message after compiling the code for EM6400
Figure 6-7
“Done uploading” message after uploading the code for EM6400
You are done with the steps from the Arduino side of the code. However, you will not see the results of the Line to Neutral Voltage and frequency in the Arduino side of things. Remember that you wrote everything to the serial port via statements Serial.write(). To read these values, you need to write a very small Python program that shows you what the Arduino Mega 2560 is writing to its serial port.
First, you need to install a Python package or module named serial, which can be done on the Raspberry Pi 3 B+ command line, as shown in Figure 6-8.
Figure 6-8
Installing the serial module in Python on the Raspberry Pi 3 B+
Python installations have this module by default, so you may not need to install it. You can check if it requires an installation by running the simple import statement import serial on the Python prompt as shown in Figure 6-9.
Figure 6-9
Checking if the serial Python module is installed
If you get an error, then the module for your version of Python is not installed. If you do not get an error and the Python prompt >>> returns without giving out any message, it’s an indication that the library module is already present and you don’t need to install it again.
Now that you have the serial library installed, you can go ahead and write the code for Python to fetch the data from serial port. See Listing 6-8.
import serial
ser= serial.Serial('/dev/ttyACM0', 9600)
while 1:
print("Reading...")
print(ser.readline())
Listing 6-8
Python Code to Read Data from the Arduino Serial Port
In this Python program, you first import the serial object and then create an object named ser with the serial.Serial() function by giving the first parameter, /dev/ttyACM0; usually this is the serial port where Arduino communicates. The second parameter, 9600, is the frequency baud rate at which it is communicating from the energy meter. This is frequency value you set in the code block in Figure 6-10. If you have changed that frequency for some reason, you need to change it here to the same value or the communication will not happen due to baud rate frequency mismatch. When you run this Python program, you will see output similar to that given in Listing 6-9. The code ser.readline() reads one line of values from the serial port connected to the Arduino Mega 2560 and then in turn to the EM6400 Energy Meter.
>>> %Run arduino.py
Reading...
b'Hello World
'
Reading...
b'preTransmission
'
Reading...
Line to Neutral Voltage:
221.5
Frequency:
49.67
b'postTransmission
'
Listing 6-9
Sample Output of the Python Program on Raspberry P 3 B+
You can see in the sample output that the program starts with preTransmission written and then prints “Line to Neutral Voltage:” and its value of 221.5 and then it prints “Frequency:” and its value of 49.67. This runs in an infinite loop every 2 seconds and every time the setup runs, “Hello World” is printed in the serial communication output. You can change this to something meaningful like “Setup initialized.” I leave it up to you.
With this you come to the end of configuring and setting up the Conzerv EM6400 Energy Meter. Now, as I promised at the beginning of the chapter, you will get to configure an energy meter with just a single-phase two-wire setup, which is much simpler to set up and configure. This energy meter is by Eastron SDM630, which has a Modbus interface as well. This time you are not going to use the Arduino Mega 2560; you’ll use Python and Raspberry Pi to directly get data from it.
Now you will first be connecting with a single Eastron SDM 630 through a single phase connection. I do not recommend connecting more than one of this meter either in a serial or daisy-wheel fashion because, unlike the Arduino Mega 2560, the Raspberry Pi 3 B+ is not a rugged industrial grade board and it can get burned easily. So the connection system that I am giving here is only for a small project, unlike the Conzerv EM6400 connection and configuration from earlier chapters.
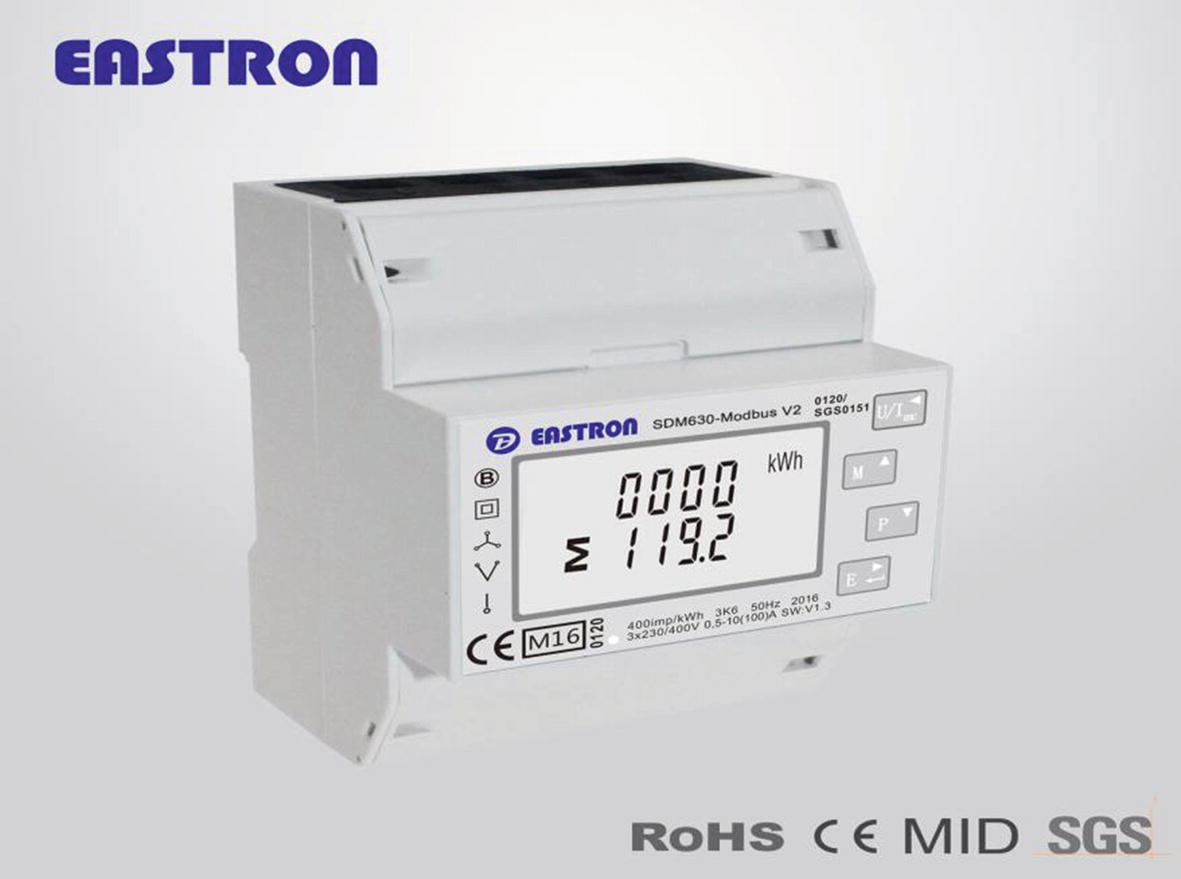
The Eastron SDM630 Energy Meter (Figure 6-10) is made by a Chinese company and is easily available worldwide. You can check out the links on www.pmauthor.com/raspbian if you need one. This smart energy meter is one of the most popular ones for domestic and industrial purposes and supports three-phase connections as well. I recommend this one because I and my team have sufficiently tested it for personal and commercial applications for client projects and it performs well. Although there are a few competitors on the market, we use this popular one the most.
Figure 6-10
Eastron SDM630
The first step is to connect this energy meter to the Raspberry Pi and for that you will need the following components:
1.
RS485 Modbus USB Convertor
2.
At least 1 meter twin wire that can pass 5V current
3.
Eastron SDM630 Energy Meter
4.
Single phase machine such as a motor or a milling machine that has electronic coils and motors to produce reactive power
5.
At least 20W LED bulb to produce active power
All the items listed are mentioned with their specifications at www.pmauthor.com/raspbian/. Let’s get started connecting all of them together.
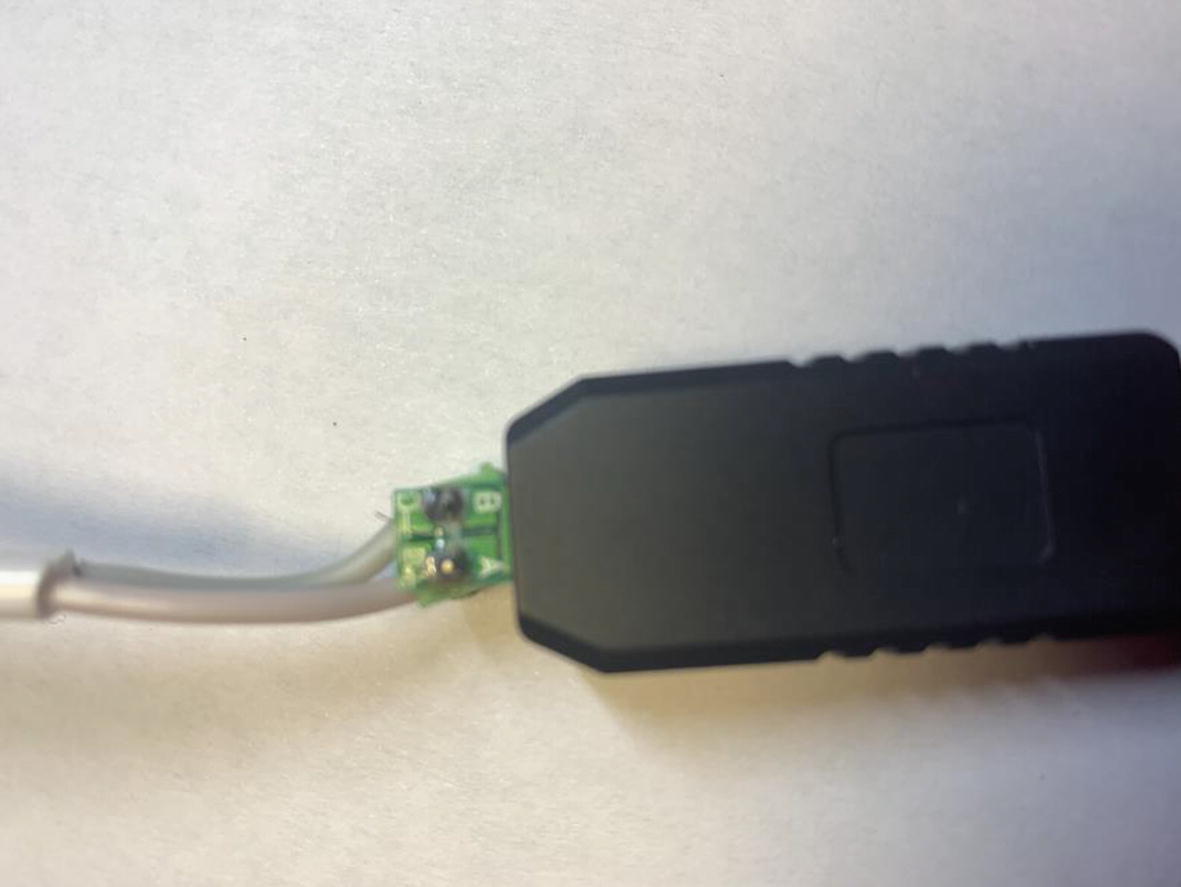
The RS485 USB Convertor needs to be connected with the twin wires, as shown in Figure 6-11. You can see the specific terminals to connect. There are two terminal pins at the base of the USB convertor.
Figure 6-11
RS485 USB convertor
They are marked as A and B. Please note that these are the same terminals in the energy meter that are marked A and B, as shown in Figure 6-12. If you insert the pink wire to the terminal marked A, then you must connect the same pink wire at the other end to the energy meter terminal marked A; if you do the opposite, it may damage the energy meter, so keep this in mind. Similarly, connect the grey wire marked at terminal B in the USB convertor to the one marked B in the energy meter. This completes the USB convertor connection to the energy meter. For your own safety, please ensure that neither the Raspberry Pi nor the energy meter is running. Make sure they are in the off position and unplugged from any electrical terminals. This is to prevent accidental shocks. Also, never connect to the mains unless you have MCB or circuit breakers installed in your electrical system, so that in the eventuality of a short circuit the MCB trips and doesn’t cause damage to the electrical wiring system.
Figure 6-12
Connecting wires to the RS485 Modbus Converter
Have a look at the corresponding wire connections in Figure 6-13, which has the grey wire connected to the B- terminal and the pink wire connected to the A+ terminal on the Eastron SDM630 Energy Meter.
Figure 6-13
Wires connected to the data terminals inside the Eastron SDM630
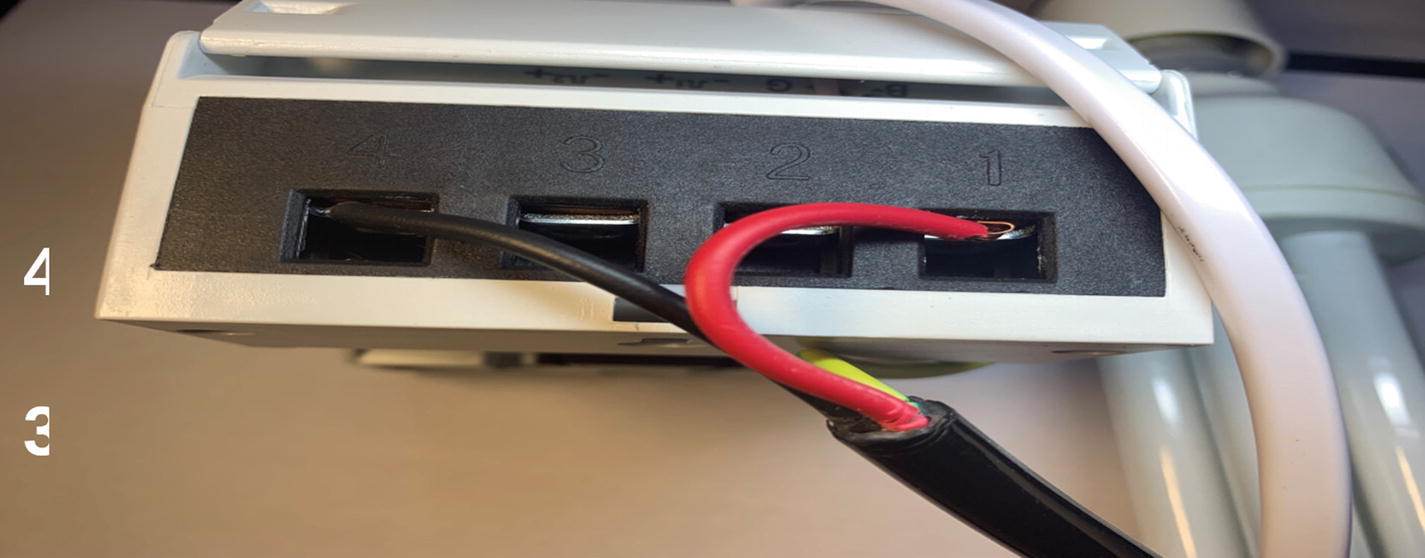
Now that both the ends of the twin wires are connected, you must make two connections to the SDM630 Energy Meter. One is for the input wire connections, which will come from the mains and supply power to the energy meter, and the second is the output wire connections, which will supply electrical current to the load or the source of the current such as an LED bulb, electrical motor, or milling machine. This is depicted in Figure 6-14.
Figure 6-14
Input connections to the Eastron SDM630 Energy Meter
As you can see, there are four terminal wire connections in the input side of the meter. Out of the four terminals, since you are using a single-phase two-wire model in this energy meter, you need only terminal number 4 connected with the black wire or Neutral and terminal number 1 with the red wire or the power cable, also known as live wire. Once you have these wires connected, you can connect the socket end of these wires with a plug. Please note that you are not using the third wire, the ground wire, in this architecture. The plug connection is shown in Figure 6-15 for your convenience.
Figure 6-15
Plug connection to the input wire of the energy meter
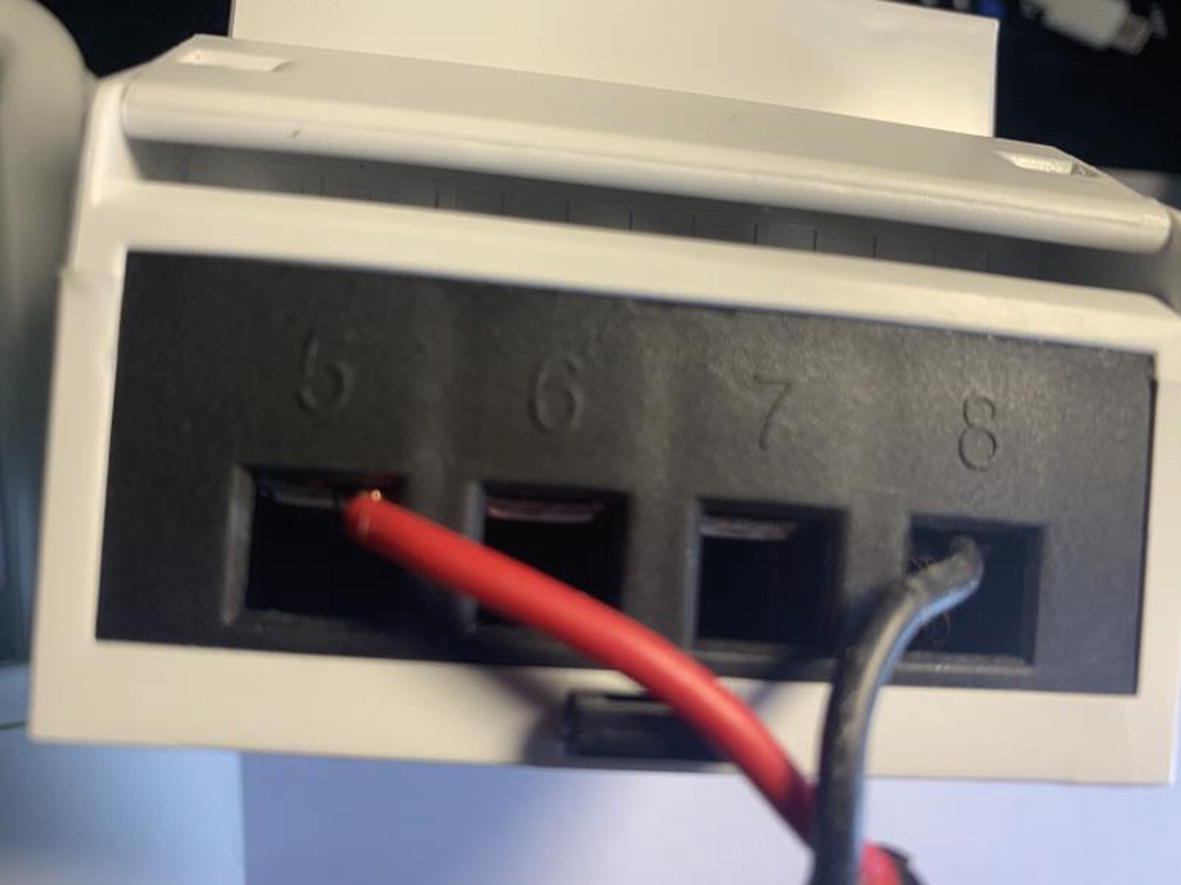
You now have to make the connection to the output terminals of the energy meter and place a load at the other end of it like an LED bulb, electric motor, or milling machine. Remember they all need to be single phase. So connect them up as shown in Figure 6-16, where the output red or live wire is connected to terminal 6 and the output black or neutral wire is connected to terminal 8.
Figure 6-16
Output wire connections to the energy meter
Once this connection is done, you need to connect the other end of the terminal wire to a load such as an LED bulb, single-phase milling machine, or electric motor. In Figure 6-17, you can see an LED bulb connected as the load; however, this will not give very realistic data as the reactive power will always be zero. Nevertheless, it is a good way to test your circuit. The load at the other end can always be replaced with any other within no time.
Figure 6-17
LED bulb connected to the output end of the energy meter
At this stage, all the output and input connections are done and you can power on the energy meter by connecting it to the power socket from the input end. You should see the energy meter come to life and the LED bulb light up, as shown in Figures 6-18 and 6-19, respectively.
Figure 6-18
Eastron SDM630 Energy Meter after power on
Figure 6-19
LED bulb and energy meter after power on
This completes the hardware side of the setup. Please remember that you have not yet connected the Raspberry Pi 3 B+ to the energy meter. This is just to check that all the connections to the energy meter are working and that the load powers on along with the energy meter. If this is successful, you can connect with the Raspberry Pi and then use a Python program to get data from it and store it in a SQLite3 database. After powering on the energy meter, you can power on the Raspberry Pi 3 B+. But before that, please remember to connect the RS485 Modbus converter to a USB port in the Raspberry Pi, as shown in Figure 6-20.
Figure 6-20
Connecting the RS485 Modbus converter to the Raspberry Pi 3 B+
Please note there is no LED light on this RS485 converter module PCB, so there is no way to tell that it is receiving a signal from the energy meter except from the Python software. It’s named sdm630_tested.py and you can unzip it from the bundle pack available at www.pmauthor.com/raspbian/. The entire code is given in Listing 6-10. Before you can run the Python code, you need to install the Python libraries that are required by the Raspberry Pi to communicate with the energy meter using the RS485 Modbus protocol. For this you, need to install a Python library known as minimalmodbus. First, run the commands sudo apt-get update and then sudo apt-get upgrade because it is a good practice to keep the OS libraries and kernel updated and upgraded so that newer Python libraries do not fail due to any dependencies on the newer Raspbian structure. Figures 6-21 and 6-22 show this installation procedure.
Figure 6-21
Updating the Rapsbian kernel
Figure 6-22
Upgrading the Raspbian kernel
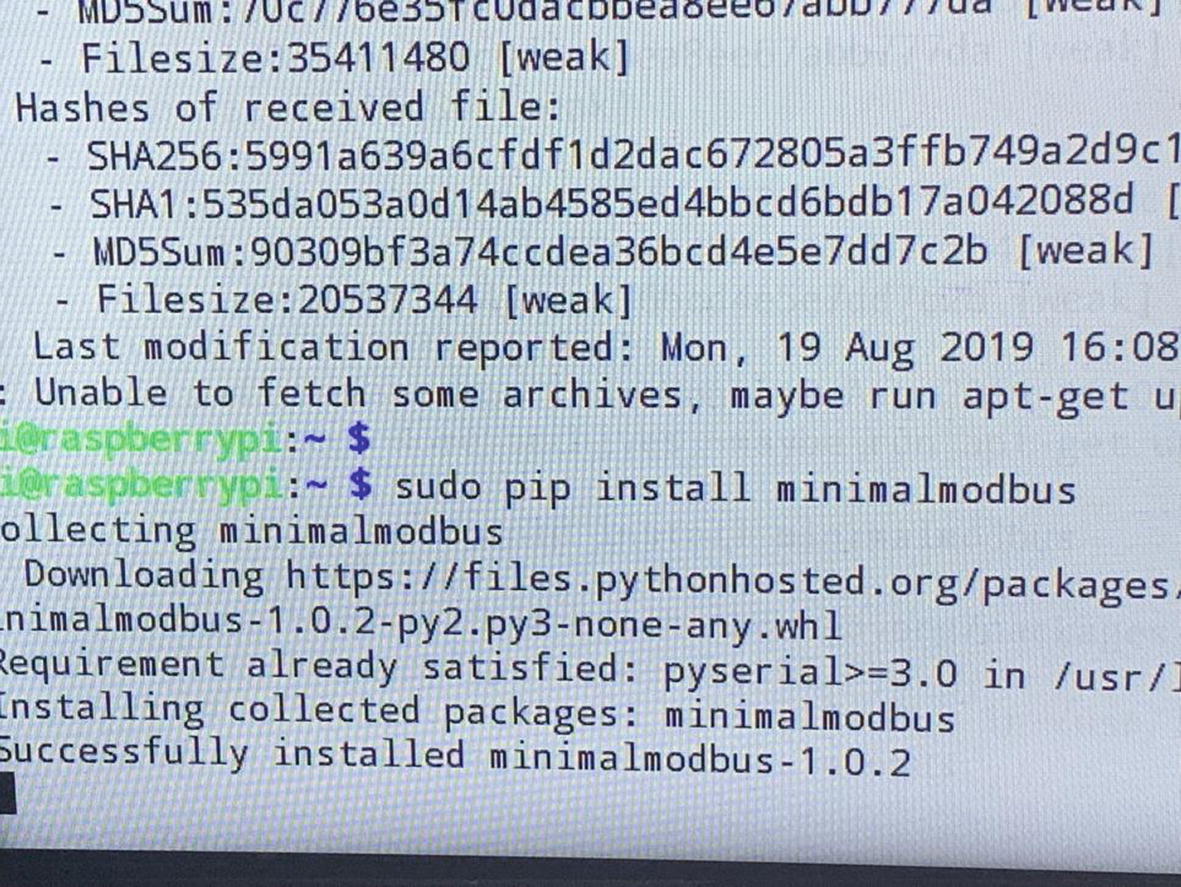
After you have installed the minimalmodbus Python module (Figure 6-23), you can load the Python code and run it (Listing 6-10). Just a reminder: By this time your energy meter should be up and the Raspberry Pi 3 B+ connected using the RS485 Modbus converter.
Figure 6-23
Installing the minimalmodbus Python module
#!/usr/bin/Python
#Loading modbus library
import minimalmodbus
from datetime import datetime
#Initializing searial communication on the modbus library
Python Code to Get Data from the Energy Meter and Store It in a Database
In this code, first you import the minimalmodbus Python library to enable Modbus communication between the Raspberry Pi and the energy meter. Then you import datetime to store a timestamp along with one record of data from the energy meter. Its usage comes later in the code. After this you initialize the Modbus instrument through its Rs485 Modbus USB converter, which is connected on the Raspbian device list as /dev/tty/USB0. This is the default device and should work in most cases; however, if you face any communication errors, use the command lsusb to check which tty port your 485 converter is connected to. Next, you initialize the serial port communication at the frequency baud rate of 9600. This is the default value; if you have changed the baud rate in your energy meter, you need to change it here in the code statement sdm630.serial.baudrate = 9600 to its new value. You initialize the byte size of 8 for a register along with other setup parameters like stopbits and timeout interval. The print(sdm630) prints the object out to the console on the Raspbian so you should see all of the connection setup configuration through this print statement. After this, your setup of the energy meter is done and you can now communicate with it and get data from it. For this, in the next piece of code you use an infinite while loop to get the data continuously printing on the screen and then lastly store it in a SQLite 3 database. This code is very similar to the code for the Conzerv EM6400 Energy Meter so I won’t delve deeper into it. However, the points to note are that you are getting a total of 15 values from the energy meter, including its voltage, current, active power, and reactive power to the current yield. After running the program, you should see output similar to Figure 6-24.
Figure 6-24
Output of the program sdm630_tested.py
The output of the insert into statement used to store data into the SQLite3 database goes into a table named sdm630data. The table creation script is in the file sdm630_db_creation_script.sql, which came along with the zip you downloaded from www.pmauthor.com/raspbian/.
Summary
This completes the setup, configuration, and getting data from the energy meter into a database system. So far you have successfully downloaded the scripts for use in the setup of the energy meter device. You coded for the EM6400 Energy Meter by the use of a Modbus library in the Arduino IDE. You also learned and implemented pre- and post-communication between the Arduino Mega 2560 and the Conzerv EM6400 Energy Meter by writing a small “Hello World” program. Then you wrote code to get data values from the energy meter through its registers. After this, you configured another energy meter, the more commonly available Eastron SDM630. You connected the hardware to it and then loaded the required Python libraries for the Modbus communication between the Raspberry Pi and the SDM360 Energy Meter. Lastly, you wrote a Python program to get data from the energy meter such as voltage, current, and power and stored it in a SQLite3 database.
Next, you will examine some case studies and design some interesting IoT and IIoT solutions.