30. In-Browser Developer Tools
In This Chapter
• Learn how browser developer tools can save you a lot of time
• Familiarize yourself with what Chrome’s Developer Tools offer
All of the major browsers—Google Chrome, Apple Safari, Mozilla Firefox, and Microsoft Edge (formerly Internet Explorer)—do more than just display web pages. For developers, they provide access to a lot of cool functionality for figuring out what is actually going on with the web page that is displayed. They do all of this via what I’ll generically just call the Developer Tools. These are tools that are built in to the browser, and they give you the ability to fiddle with your HTML, CSS, and JavaScript in a lot of neat and interesting ways.
In this chapter, let’s look at these Developer Tools and learn how we can use them to make our lives easier.
Onwards!
I’ll Be Using Google Chrome
For all of the examples you are about to see, I’ll be using Google’s Chrome browser. While each browser provides similar functionality for what I’ll be describing, the exact UI and steps to get there will vary. Just be aware of that, and also note that the version of Chrome you may be using might be more recent than the one that is used in this chapter.
Meet the Developer Tools
Let’s start at the very beginning. When you navigate to a web page, your browser will load whatever document it was told to load:
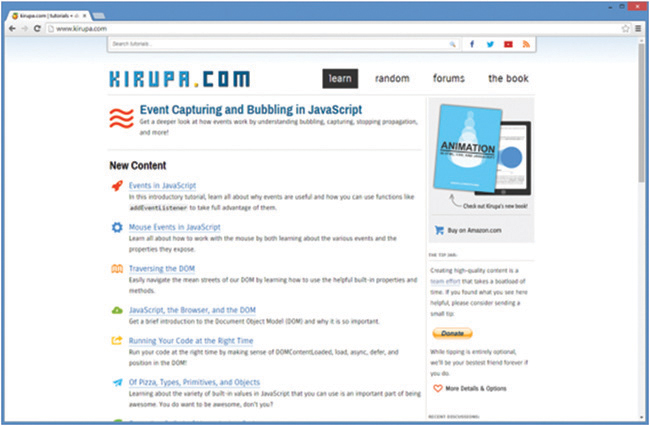
This should all be very familiar for you, as this part of the browser functionality really hasn’t changed much since the very first browser that was released in the 1800s...or therabouts. While using Chrome, press (Cmd-Opt-I) on the Mac or the F12 key [or Ctrl+Shift+I] in Windows.
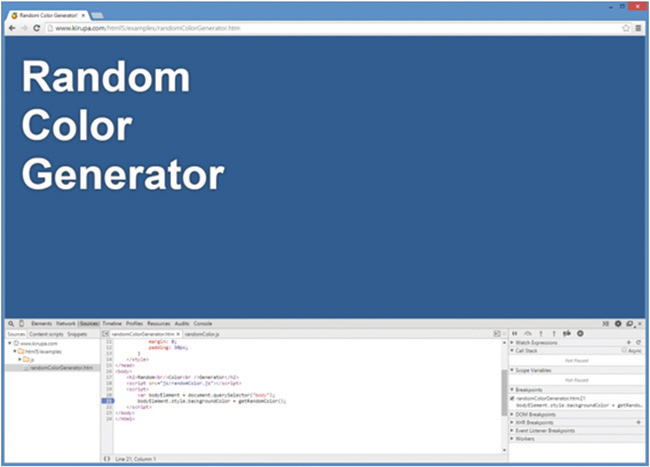
Once you’ve pressed those key or keys, notice what happens. While you may not hear heavenly music followed by the earth rumbling and laser beams shooting across the sky, you will see your browser’s layout change to show something mysterious (usually) toward the bottom or right of the screen as shown in Figure 30.1.
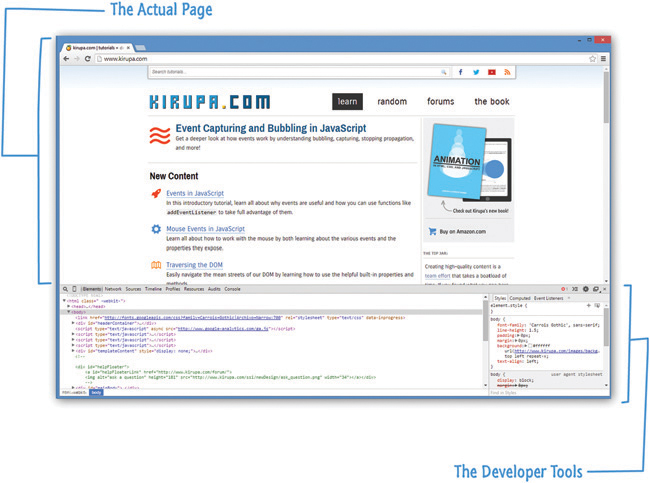
FIGURE 30.1
Your browser with its developer tools displayed right below it.
Your browser will split into two parts. One part is where your browser deals with displaying your web pages. We like this guy and have known him for quite some time. The other part, the new guy whom we eye suspiciously from a distance, provides you with access to information about the currently displayed page that only a developer such as yourself would appreciate. This guy is better known as the Developer Tools.
The Developer Tools provide you with the ability to:
Inspect the DOM
Debug JavaScript
Inspect objects and view messages via the console
Figure out performance and memory issues
See the network traffic
...and a whole lot more!
In the interest of time (Game of Thrones is about to start soon, and this is the episode where I believe Ned Stark comes back to life as a dire wolf ), what I’m going to do is focus on the first three items that are directly related to what you are learning about in this book.
Inspecting the DOM
The first Developer Tool feature we will look at is how you can inspect and even manipulate the contents of your DOM. With Chrome launched, navigate to http://bit.ly/kirupaDevTool.
No Browser? No Problem!
Now, if you don’t have a browser handy or simply can’t access that link, don’t worry. I’ll explain what is going on at each step of the way so that you aren’t left out of all the fun.
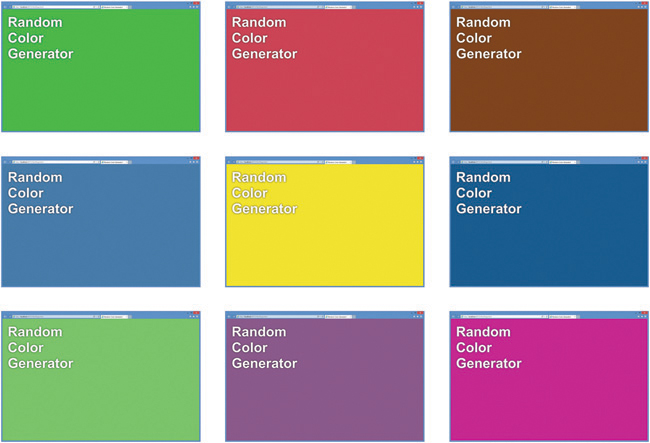
When you load this page, you will see a colorful background with some text displayed:
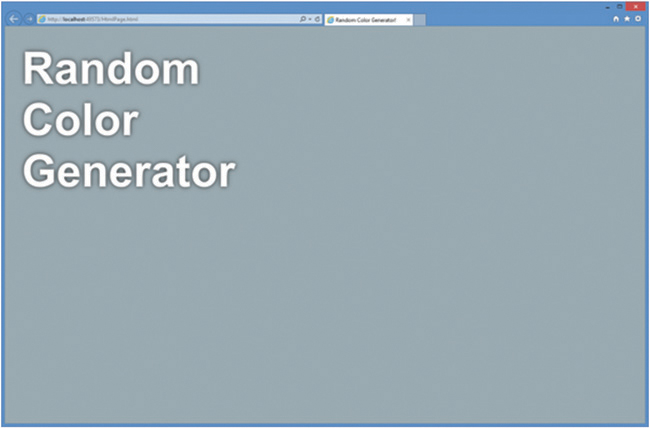
If you reload this page, you’ll see this page showing up with a different background color. As you can guess, each page reload will result in a different background color getting generated:
The first thing we’ll do with this example is examine the DOM to see what is going on. Make sure your Developer Tools are visible, and ensure the Elements tab is selected:
What you will see is a view of your live markup from the page that is currently shown. To be more specific, this is a view of your DOM. The importance of this distinction is that this view provides you with a live version of what your page looks like. Any shenanigans JavaScript or your browser may have pulled on the DOM will be shown in this view.
Using our example as an...um...example, using View Source will result in something that looks as follows:
<!DOCTYPE html>
<html>

<head>
  <title>Random Color Generator!</title>
  <style>
    h2 {
      font-family: Arial, Helvetica;
      font-size: 100px;
      color: #FFF;
      text-shadow: 0px 0px 11px #333333;
      margin: 0;
      padding: 30px;
    }
  </style>
</head>

<body>
  <h2>Random
    <br />Color
    <br />Generator</h2>
  <script src="js/randomColor.js"> </script>
  <script>
    let bodyElement = document.querySelector("body");
    bodyElement.style.backgroundColor = getRandomColor();
  </script>
</body>

</html>
The View Source command simply gives you a view of the markup as stored in the HTML page. Another way of saying this is that View Source gives you a (stale) version of the markup as it lives on the server and not a version of the DOM.
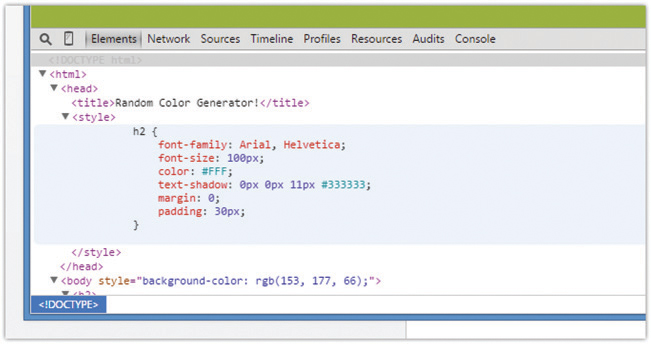
If you use the Developer Tool’s DOM view, you will see a DOM-based representation of your document based on the live version of the page:
<!DOCTYPE html>
<html>

<head>
  <title>Random Color Generator!</title>
  <style>
    h2 {
      font-family: Arial, Helvetica;
      font-size: 100px;
      color: #FFF;
      text-shadow: 0px 0px 11px #333333;
      margin: 0;
      padding: 30px;
    }
  </style>
<body style="background-color: rgb(75, 63, 101);">
  <h2>Random
    <br>Color
    <br>Generator</h2>
  <script src="js/randomColor.js"> </script>
  <script>
    let bodyElement = document.querySelector("body");
    bodyElement.style.backgroundColor = getRandomColor();
  </script>

</body>

</html>
If you pay close attention, you’ll notice some subtle differences in how some elements look. The biggest difference is the highlighted inline background-color style on the body element that only exists in the DOM view but not in the traditional View Source view. The reason is that we have some JavaScript that dynamically sets an inline style on the body element. The following note expands on why this happens!
The Difference Between the DOM View and View Source
The reason for the discrepancy between the two code views goes back to what the DOM represents. To repeat this one more time, your DOM is the result of your browser and JavaScript having run to completion. It provides you with a fresh-from-the-oven look that mimics what your browser sees.
View Source is just a static representation of your document as it was on the server (or your computer). It doesn’t contain any of the liveliness of your running page that the DOM view highlights. If you look at our JavaScript, you’ll see that I specified that our body element get its backgroundColor set dynamically:
let bodyElement = document.querySelector("body");
bodyElement.style.backgroundColor = getRandomColor();
When this code runs, it modifies the DOM to set the backgroundColor property on the body element. You would never see this using View Source. Ever. That’s why the DOM view the Developer Tools provide is your bestest friend in the whole wide world.
As examples highlighting the differences between the source and DOM go, our example was quite simple. To see the real benefit of the DOM view, you should experiment with some element reparentings, creations, and deletions to really see the divergence between viewing the source and examining the DOM. Some of the examples you saw in the previous chapters around DOM manipulation would be good things to inspect as well.
Debugging JavaScript
Moving along, the other big thing that the Developer Tools bring to the table is debuggability. I don’t know if that is a really word or not, but the Developer Tools allow you to poke and prod at your code to figure out what is going wrong (or not wrong). The general catch-all phrase for all this is known as debugging.
In your Developer tools, click on the Sources tab:
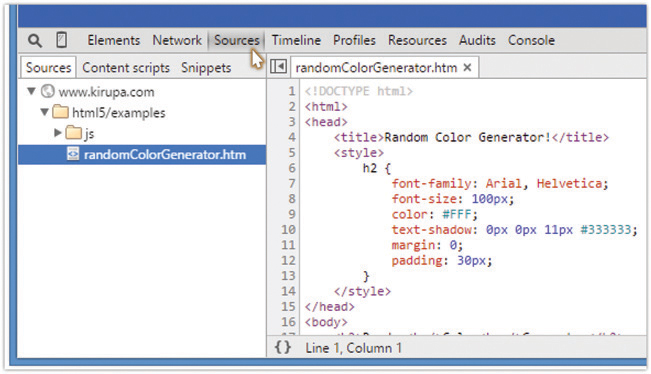
The Sources tab gives you access to all the files that are currently being used by your document. As the name implies, you are looking at the raw contents of these files—not the DOM-generated version from earlier that is your bestest friend.
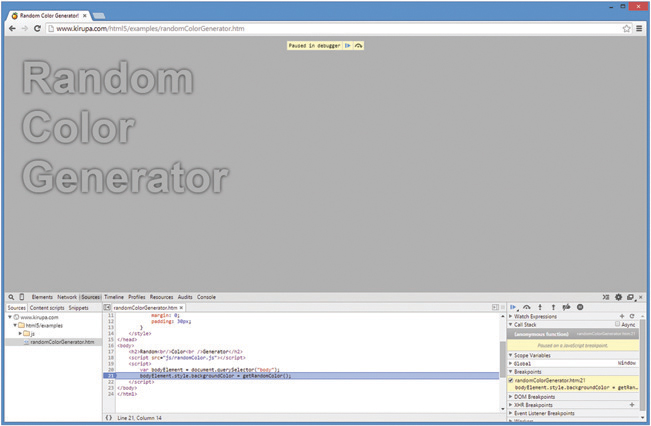
From the tree view on the left, ensure the randomColorGenerator.htm file is selected. This will ensure that the contents of this file are displayed for you to examine on the right. In the displayed file, scroll all the way down until you see the script tag with the two lines of code that you saw earlier. Based on the line counts shown in the left gutter, our lines of JavaScript should be lines 20 and 21.
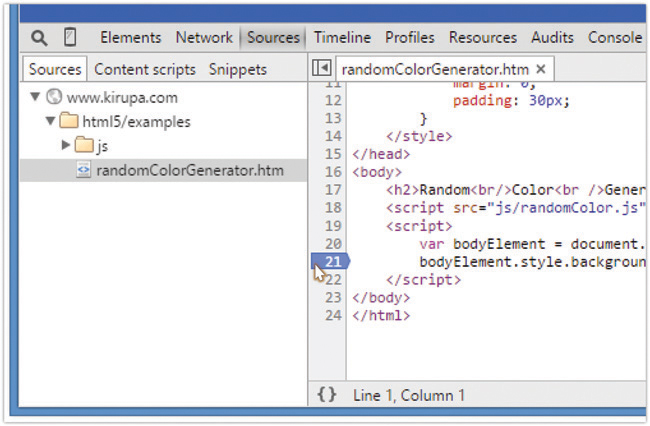
What we want to do is examine what happens when the code in Line 21 is about to execute. To do this, we need to tell the browser to stop when Line 21 is about to get executed. The way you do that is by setting what is known as a breakpoint. To set a breakpoint, click directly on the 21 label on the left gutter.
Once you’ve done that, you’ll see the 21 getting highlighted:
At this point, a breakpoint has been set. The next step is to actually have your browser run into this breakpoint. This is more peacefully known as “hitting the breakpoint.” The way a breakpoint is hit is by ensuring your code runs into it. In our case, all we need to do is just hit F5 to refresh the page, as Line 21 will just execute as part your page loading and executing everything inside the script tags.
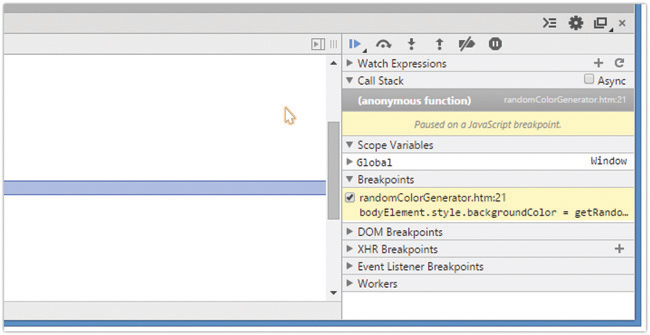
If everything worked as expected, you’ll see your page load and suddenly pause with line 21 getting highlighted:
You are currently in debugging mode. The breakpoint you set on Line 21 has been hit. This means your entire page ground to a screeching halt the moment the browser hit it. At this point, with your browser being in suspended animation, you have the ability to fiddle with everything going on in your page. Think of this as time having stopped with only you having the ability to move around, inspect, and alter the surroundings. If a movie hasn’t been made about this, somebody should get on it!
While in this mode, go back to Line 21, and hover over the bodyElement variable. When you hover over it, you’ll see a tooltip indicating the various properties and values that this particular object contains:
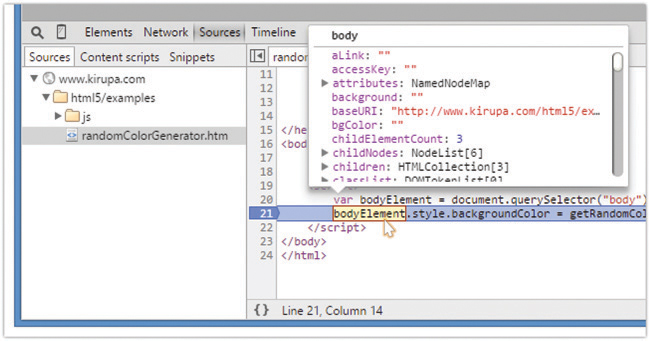
You can then interact with the tooltip, scroll through all the objects, and even dig deeper into complex objects that have more objects inside them. Because bodyElement is basically the JavaScript/DOM representation of the body element, you’ll see a lot of properties that you encountered indirectly from our look at HTMLElement a few chapters ago.
On the right side of your source view, you have more angles through which you can inspect your code:
I won’t be explaining what all of those categories do, but I am pointing that area out just so you know that you have the ability to examine the current state of all your JavaScript variables and objects in much greater detail if you so wanted to.
The other big advantage a breakpoint provides is the ability for you to step through your code just like your browser would. Right now, we are stuck on Line 21. To step through the code, click on the “Step into function call” button found on the right-hand side:
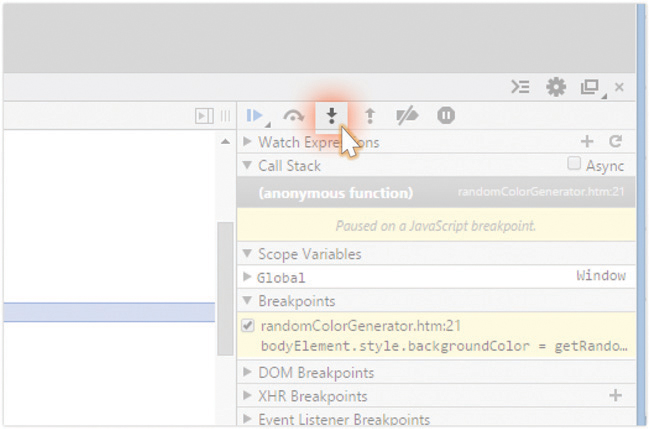
Remember, this is the line of code you are currently broken at:
bodyElement.style.backgroundColor = getRandomColor();
Once you’ve clicked that button, notice what happens. You will find yourself inside randomColor.js where the getRandomColor function has been defined. Keep clicking on the “Step into function call” to continue stepping into your code and going through each line of the getRandomColor function. Notice that you now get to see how the objects in your browser’s memory update as you go line-by-line and execute the code sequentially. If you are tired of doing that, you can Step back by clicking on the Step out of current function button (found to the right of your Step into button) that exits you out of this function. In our case, that is back to Line 21 in randomColorGenerator.htm.
If you just want to execute your app without stepping through any more of the code, click on the Play button found a few pixels to the left of Step into:

When you hit Play, your code will execute. If you happen to have another breakpoint set somewhere in your code’s path, that breakpoint will also get hit. When stopped at any breakpoint, you can choose to Step into, Step out, or just resume execution with Play. Because we only set one breakpoint, hitting Play will just run the code to completion and have your random color appear as the background for your body element:
To remove a breakpoint, just click on the line number that you set the breakpoint on. If you click on the Line 21 label again, the breakpoint will toggle itself off and you can just run your application without getting into debugging mode.
So, there you have it. A whirlwind tour of how to use some of the debugging functionality you have at your disposal. To reiterate something I mentioned at the beginning of this chapter, I am only scratching the surface of what is possible. The resources I provide toward the end should help you out further.
Meet the Console
The other OTHER big Debugging Tool functionality we will look at is using what is known as the Console. The console provides you with the ability to do several things. It allows you to see messages logged by your code. It also allows you to pass commands and inspect any object that is currently in scope.
To show the Console, navigate to the Console tab by clicking (or tapping) on it:
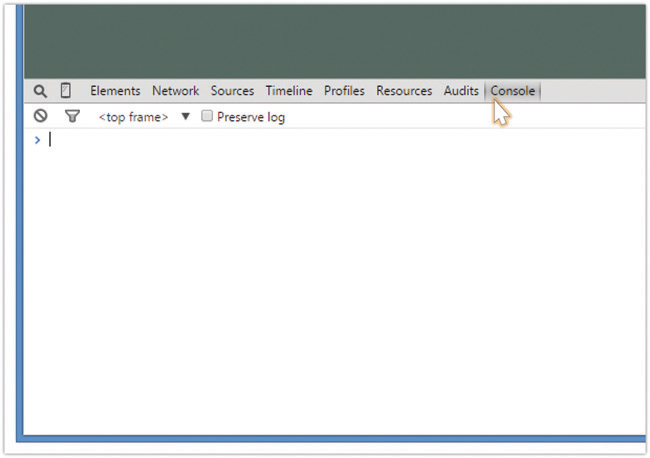
Don’t be afraid of the vast emptiness that you see in front of you. Instead, embrace the freedom and fresh air.
Anyway, what the Console provides you with is the ability to inspect or call any object that exists in whatever scope your application is currently running in. With no breakpoints set, launching the console puts you in the global state.
Inspecting Objects
Where your cursor is right now, type in window and press Enter:
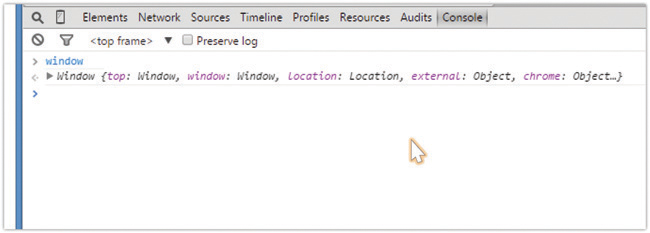
What you will see is an interactive listing of all the things that live in your window object. You can start to type in any valid object or property, and if it is in scope, you will be able to access it, inspect its value, or even execute it:

This is by no means a read-only playground. You can cause all sorts of mayhem. For example, if you type in document.body.remove() and press Enter, your entire document will just disappear. If you did end up deleting the body, just refresh the page to get back to your earlier state. Developer Tools primarily work with the in-memory representation of your page and don’t write back to source. Your experimentations will safely stay in the transient realm.
Refresher on the Scope/State
On several occasions, I mentioned that your console allows you to inspect the world at whatever scope you are currently in. This is basically just applying what you learned about Variable Scope in Chapter 8, “Variable Scope,” to the Console’s behavior.
Let’s say you have a breakpoint set at the following highlighted line:
let oddNumber = false;

function calculateOdd(num) {
  if (num % 2 == 0) {
    oddNumber = false;
  } else {
    oddNumber = true;
  }
}
calculateOdd(3);
When you run the code and the breakpoint gets hit, the value of oddNumber is still false. Your breakpointed line hasn’t been executed yet, and you can verify this by testing the value of oddNumber in the Console. Next, let’s say you run this code, hit this breakpoint, and step through to the next line.
At this point, your oddNumber value is set to true. Your Console will now reflect the new value, for that is what the in-memory representation of oddNumber states. The main takeaway is that your Console’s view of the world is directly tied to where in the code you are currently focusing on. This is especially made obvious when you are stepping through code and the scope you are in changes frequently.
Logging Messages
We are almost done with all of this Developer Tools business. The last thing we will look at is the console’s ability to log messages from your code. Remember all those times where we did something like this?
function doesThisWork() {
  console.log("It works!!!");
}
The “this” being where we used an alert statement to print some value or prove that the code is being executed. Well, we can stop doing that now. By using the console, you have a far less annoying way of printing messages without interrupting everything with a modal dialog box. You can use the console.log function to pass in whatever you want to print into the console:
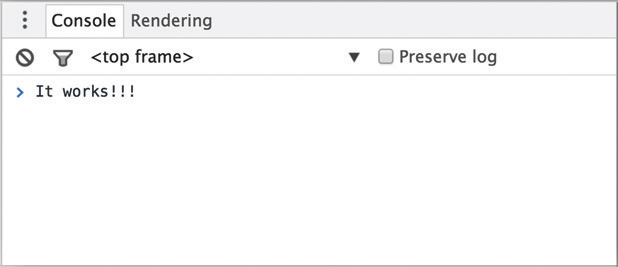
function doesThisWork() {
  console.log("It works!!!")
}
When this code executes, you’ll see whatever you logged get printed in your Console when you bring it up:
Using the console is, in almost every way, superior to using alert for debugging purposes. In future code snippets, you’ll start to see me using console.log over alert in some cases.
The Absolute Minimum
If you have never used a Developer Tool before, I really REALLY think you should take some time to get familiar with one. JavaScript is one of those languages where things can go wrong even when everything looks right. In the very simple examples you’ll encounter in this book, it’s easy to spot mistakes. When you start working on larger and more complex applications, having the right tools to diagnose issues will save you many hours of effort.
To learn more about the Developer Tools (aka Dev Tools as the cool kids call it) in far greater detail than what I’ve covered here, check out the following resources:
Overview of the Chrome Dev Tools: http://bit.ly/kirupaChromeDevTools
Overview of the IE/Edge F12 Dev Tools: http://bit.ly/kirupaIEDevTools
Overview of the Firefox Dev Tools: http://bit.ly/kirupaFFDevTools
Overview of the Safari Web Inspector http://bit.ly/kirupaSafariDevTools