Chapter 7: RAM Memory Forensic Analysis
RAM is a vital source of digital evidence that, historically, has been neglected and ignored. As our knowledge of digital evidence grew, examiners began to realize the source of potential digital evidence that existed in RAM. Ultimately, you have an additional multi-gigabyte source of information that needs to be examined and may contain digital artifacts that do not exist in the traditional locations of the system.
In this chapter, we will cover the fundamentals of memory. We will then look at the different sources of memory and learn to capture RAM using RAM capture tools. By the end of this chapter, you will be able to understand the various methods and tools that can process volatile memory.
We'll be covering the following topics in this chapter:
- Fundamentals of memory
- Random access memory
- Identifying sources of memory
- Capturing RAM
- Exploring RAM analyzing tools
Fundamentals of memory
What information does random access memory (RAM) contain? It will give you the information about the current running state of the system before you shut it down. It will contain information about any running programs; these could be legitimate processes, and it could contain running malware processes as well. If attackers have compromised the host, the malware may be a resident in the RAM.
You will also find information related to network connections the host has with other peers. This could be a legitimate use of peer-to-peer file sharing, or it could show a link to the attacker's host. These connections are breadcrumbs for you to follow if you are investigating a network intrusion or suspect someone may have compromised the host. The user could also be sharing illicit images, and the connection to other computers will give you leads for you to follow and to investigate additional users for the same crime.
If the user is using cloud services, we may never find the data they are creating on the physical disk in the system. We may only see the evidence of the data being hosted in the cloud in the form of RAM.
RAM is the kitchen table of the computer system. Any action the user/system takes within the system will access the RAM. Every mouse click and every keyboard button that's pushed will be processed through the RAM, and you can recover entire files, passwords, and the text that was placed into the clipboard. All of these are potential sources of digital evidence. Sometimes, you can recover the encryption keys for closed encrypted containers that have been created by the user.
In 2004, Rajib K. Mitra was convicted of jamming police radios. The investigation resulted in the seizure of multiple pieces of digital evidence. The lead detective, Cindy Murphy, learned in 2009 that it was possible to recover encryption keys that may have existed only in RAM. Detective Murphy was able to go back and reexamine the evidence and was able to identify the encryption keys Mitra had used to secure his encrypted container. When Detective Murphy opened the encrypted container, she found many illicit images, which led to Mitra being convicted of the possession of the images.
How is analyzing RAM different from analyzing a hard drive? RAM is a snapshot of a live running system, whereas a hard drive examination is static. We have shut the system down, and we are examining data on the physical device. RAM is much more transient, and if you were to take a forensic image of RAM at two different points of time, you will get different results. Capturing the data in RAM will lead to the loss of potential evidence. You are changing evidence when you collect RAM.
So, let's talk about what RAM is.
Random access memory?
RAM is used to temporarily store working data/code on an active computer system. Unlike on traditional storage devices, that is, a hard drive, data can be read/written on RAM at extremely fast speeds. Current technology allows the RAM chips to be created around an integrated circuit chip with metal oxide semiconductor cells. The data stored within the RAM chips is considered to be volatile. We lose volatile data when the computer system is no longer powered on. This is a significant reason the pull the plug tactic when responding to a scene involving activated computer systems is no longer recommended.
You may run into two different types of RAM: static RAM (SRAM) and dynamic RAM (DRAM). SRAM is considered faster and more efficient with respect to energy use, whereas DRAM is cheaper to produce than SRAM. You will typically find SRAM being used as cache memory for the CPU, and DRAM chips being used for memory chips for the computer system.
The following is a representation of a DRAM chip you may come across in your investigations:

Figure 7.1 – DRAM image
Do not confuse RAM with read-only memory (ROM). ROM permanently stores data within the memory chips and is not volatile.
Consider the following: a 32-bit Microsoft Windows-based computer system has a limitation of 4 GB of RAM, while a 64-bit Microsoft Windows-based computer system has a limitation of 128 GB of RAM. That is a considerable amount of potential evidence that, historically, has not been analyzed.
For the CPU to access the data/execute code being stored in the memory chips, there must be a unique location identifier to that data; that is, an address. When we start examining raw memory dumps, we will be dealing with the physical address, which is an offset of the memory dump.
Data stored in RAM is stored in pages that are 4 kilobytes in size, and as the system processes add/read data to the pages in RAM, they are utilizing virtual addressing.
All the operating systems access RAM in the same general manner. Let's talk about some concepts that are common to an operating system:
- Privilege separation: Privilege determines what a user, user account, and the process is allowed to access. It is a form of access control and when used by the operating system, it helps provide system stability by isolating users and the CPU kernel's actions. The operating system operates in trusted mode, that is, kernel mode, while the user applications operate in untrusted mode, that is, user mode, when executing commands in the system.
- System calls: To access resources controlled by the operating system's kernel, the user application must request access. This is done through a system call to the kernel. It is a bridge between the application and the operating system to allow the untrusted mode to become trusted for a specific instance.
- Process management: Program code is executed in memory. The operating system is responsible for managing the processes. Current operating systems operate as multi-programming systems, which allows for multiple processes to be executed simultaneously. As we analyze the memory dumps, we are looking at which processes were being executed at the time of capture and analyzing the data that was being stored within RAM.
- Threads: A process can have multiple threads. It is the basic unit of using the system's resources, such as CPU. When we analyze the memory dumps, we are looking for the processes timestamps and starting addresses, which will help identify the code in the process.
The contents of RAM may include artifacts of what is or has occurred on the system. This can include the following:
- Configuration information
- Typed commands
- Passwords
- Encryption keys
- Unencrypted data
- IP addresses
- Internet history
- Chat conversations
- Emails
- Malware
As you can tell, the potential to acquire significant evidence is enhanced with the collection of RAM. Where do we find data that is stored in RAM? There are several different sources, all of which we will discuss next.
Identifying sources of memory
What happens if you are not the investigator on the scene when the digital evidence is collected in the RAM, and they do not collect volatile data? Is it possible to still access the RAM, despite having the system shut down? While you cannot analyze the RAM, it is possible to examine other sources may contain the same data that was stored in the RAM. This option may not always be viable, depending on the specific set of circumstances surrounding the seizure of the digital evidence.
You need to know that there are potential additional sources that will contain the same or similar data that was in RAM. They are as follows:
- Hibernation file (hiberfill.sys): Hibernation is the process of powering down the computer while still maintaining the current state of the system. In Windows, the RAM is compressed and stored in a hiberfill.sys file. This will allow the system to power down completely, but when the system is reactivated, the contents of the hiberfill.sys file will be placed back into RAM.
Note
If you are examining a laptop, hibernation is usually initiated by closing the laptop. In a desktop, this will be user-initiated. The file header for the hiberfill.sys file can be hibr, HIBR, wake, or WAKE. When the system is repowered, the header of the file is zeroed out. The hiberfill.sys file is a compressed file and will have to be decompressed before you can analyze it.
When analyzing the hiberfill.sys file, the last modification date/timestamp will show when the contents of RAM was added to the file.
Note
Another option if you are on scene and cannot do a live capture of the RAM can be to place the system into hibernation, which will then create the hiberfill.sys file where the current state of the system is saved.
- Pagefile (pagefile.sys): Paging is a method of storing/retrieving data being used in the RAM chips with a virtual memory file stored on a traditional storage device. While not as fast as using RAM alone, it allows programs to exceed the capacity of the physical memory. When using paging, the system will transfer data in pages. The data stored in the pagefile is typically the least requested data being used in memory. When the requests for that data are processed, it then places the data back into the physical memory.
Note
In the Windows operating system, the paging file, pagefile.sys, is stored at the root of the operating system volume. Be aware that the user can change this location. Typically, the page file can be one to three times larger than the amount of physical memory on the system.
- Swapfile (swapfile.sys): With the release of Microsoft Windows 8, Microsoft introduced the swapfile.sys file. It is very similar to the page file we just discussed, but with some differences. The Swapfile was created so that the operating system can use it for paging operations with suspended Metro/modern Windows applications. When the application is suspended, the system will write the application data in its entirety into the swap file. This frees up space in the physical memory, and when the application is resumed, it moves the data back into physical memory.
- Crash dump (memory.dmp): If you have used any version of Microsoft Windows, you might have experienced a system crash or a blue screen of death (BSoD). When that occurs, it may create a dump of memory to store information about the state of the system at the time of the crash.
Depending on the settings, you may get one of the following:
- Complete memory dump: The data contained within the physical memory. (Not very common because of issues with the capacity of the physical memory chips.)
- Kernel memory dump: Will only contain pages of data that were in kernel mode.
- Small dump files: Contains information about running processes/loaded drivers at the time of the crash.
The SYSTEM hive will contain the key to determine which memory dumps may exist on the system you are examining. The key you'll want to explore is as follows:
SYSTEMCurrentControlSetControlCrashControlCrashDumpEnable
The dump files will be in a proprietary format and will need a third-party tool to convert them (available at https://www.comae.com). So far, we have discussed the locations that will provide sources of RAM. Ultimately, you will want to capture the data within the RAM chips, which is our next topic.
Capturing RAM
When the decision is made to capture the RAM from the system, several factors need to be considered before moving forward. The most significant issue is that you will be changing the state of the system when you collect the volatile data.
The Scientific Workgroup on Digital Evidence (SWGDE) has explored the collection of volatile data and offers the following considerations:
- The application used to collect the data in memory will overwrite some contents of the memory.
- The larger the tool and associated files are, the more data it overwrites.
- The system may load the USB device driver into memory.
- The system may load the USB device driver into the registry.
- The application that's used to collect the data in memory will show up in some Most Recently Used (MRUs).
There is the potential that the collection of RAM may cause a system lockup or instability in the system. The digital forensic investigator must be aware of how the tool being used may affect different operating systems.
After calculating the risk versus the reward, you have decided to go forward and collect the contents of the RAM. What do you need to accomplish this task? You have to decide which tool works best in the environment that you will create the memory dump from. One consideration regarding your tool selection will be how big of a footprint the tool will leave on the system.
Preparing the capturing device
To successfully image the RAM, you will need three things:
- A capturing device (such as a USB device)
- Access to the system
- Administrator privileges
Note
Remember that the amount of RAM installed on the system will dictate the size of your external storage device. If the system has 16 GB of RAM, your external storage device will need to be greater than 16 GB. The memory dump will be the same size as the amount of installed RAM.
You will want to prepare your external storage device before responding to the scene. Your device should be formatted as an NTFS partition. This will alleviate any file size issues you might encounter if the device were formatted in FAT 32.
We will now discuss some tools you can use to create a raw forensic image of the RAM.
Exploring RAM capture tools
I am going to briefly discuss some tools that you can use to capture RAM. There are additional commercial and open source tools available. We could write an entire book (and there are some) about some tools that are used for memory forensics. The goal here is to give you an overview and the skills necessary to accomplish a successful memory dump, but be aware that you can go into much greater detail than I will go into in this chapter.
The following tools are all open source and freely available.
Using DumpIt
DumpIt (available at https://www.comae.com) was originally developed by MoonSols. Comae now maintains the project. It is a combination of Win32dd and Win64dd in one executable. No options are asked of the end user. This tool is fast, small, and portable. It leaves the least significant form of footprint on the RAM.
DumpIt is the simplest of all the tools to use. Once you have created your external device and have responded to the scene, you need to follow these steps:
- Insert your thumb drive into the target host.
- Type cmd (as shown in the following screenshot):

Figure 7.2 – Search bar
- Right-click on Command Prompt so that you can run it as an administrator (as shown in the following screenshot):
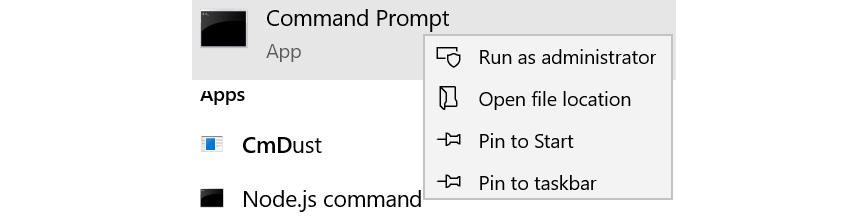
Figure 7.3 – Image administrator
- Once Command Prompt comes up, navigate to the folder on your USB device that contains the executable. You will then type in the cmd command and execute it.
- The system will then present you with a screen showing the amount of physical memory and the amount of space on the device. It will then ask you if you want to continue. Select yes, as shown in the following screenshot:
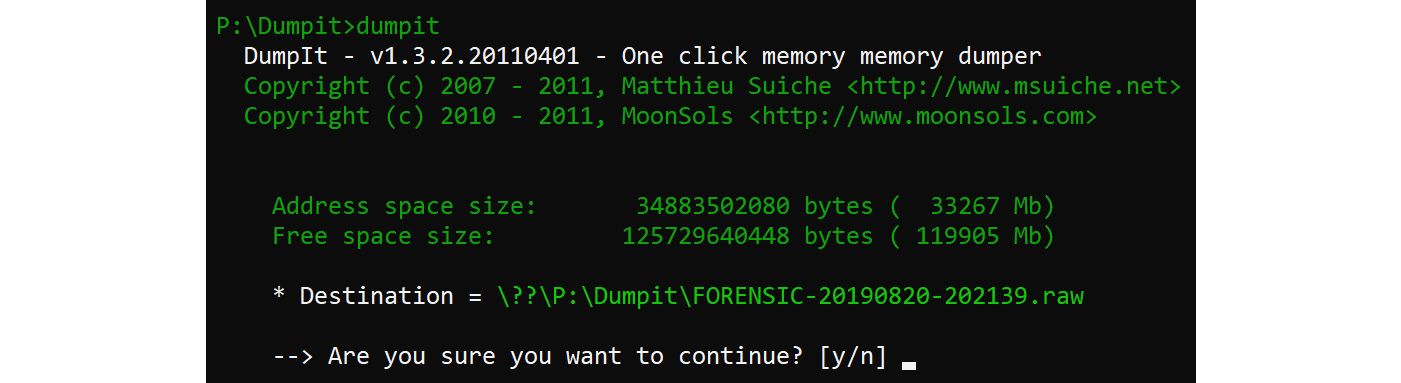
Figure 7.4 – DumpIt screen
- The amount of RAM installed will dictate the amount of time it will take to create the dump of the RAM. Once the process has been completed, the program will notify you that it was successful:

Figure 7.5 – Dumpit successful
DumpIt is not the only tool available. There are additional open source alternatives, such as FTK Imager, which we will discuss next.
Using FTK Imager
FTK Imager Lite (available at http://accessdata.com) is a GUI-based utility that allows a user to dump the memory of a computer system running either a Windows 32-bit or 64-bit operating system. This tool is easy to use and deployable on a thumb drive. This tool also allows us to mount binary dump files for viewing. Since it is GUI-based, it leaves a significant footprint on the RAM.
FTK Imager is also relatively easy to use. Remember that it is GUI-based, so as you launch the executable from your external storage device, it will overwrite more data in memory than a CLI-based tool.
Once you have responded to the scene, you will need to do the following:
- Insert your thumb drive into the target host.
- If File Explorer does not automatically launch, use the Windows + E keyboard shortcut to open it.
- Launch FTK Imager, left-click on File, and select Capture Memory..., as shown in the following screenshot:

Figure 7.6 – FTK Imager menu
- The Memory Capture window will appear as shown in the following screenshot. Here, you can fill in the destination path:
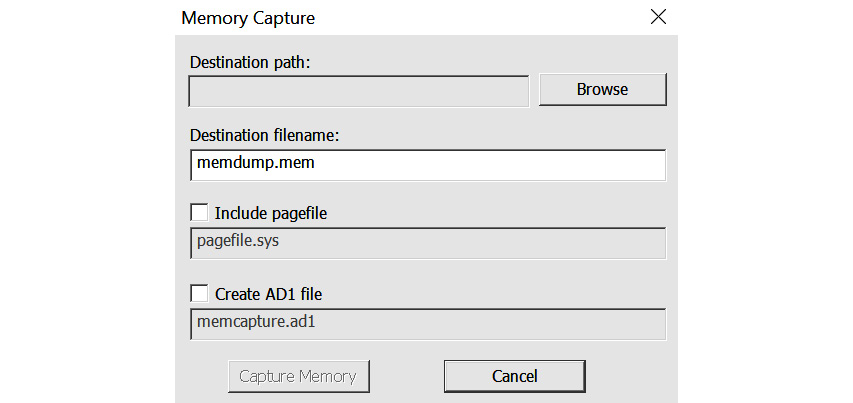
Figure 7.7 – FTK Imager memory capture
However, ensure that you select your external storage device.
- You also have the option to choose the pagefile. There is no reason not to. Check that box and then left-click on Capture Memory.
- Once the tool has finished, you will receive the success notification, as shown in the following screenshot. This will store the memory file on your external storage device:

Figure 7.8 – FTK Image successful
No matter which tool you used to collect the memory, once you have collected it, you need to get a hash value of the file you just created. You do not want to use the suspect system because any commands you issue will change the state of the evidence. You will want to use your forensic laptop or your forensic workstation at your laboratory to generate the hash value.
Now that you have created a memory dump of the RAM, what tools will you use to analyze it? Let's talk about some tools that can be used to analyze RAM.
Exploring RAM analyzing tools
Just like when we analyze forensic images created from traditional storage devices, you have the choice of open source or commercial software. It comes down to the examiner's preferences (and sometimes budget) on what tool they wish to use to analyze the dataset. We will go over some available tools, but this is not an all-inclusive list. Most commercial tools will analyze a memory file; we will discuss some open source options that are available here:
- Bulk Extractor: Bulk Extractor (available at http://digitalcorpora.org/downloads/bulk_extractor) scans the target media (disk image, file, directory) and extracts what it believes to be useful information. It ignores the filesystem structure, which allows it to process different parts of the source dataset in parallel. This makes it very fast compared to traditional forensic tools. As Bulk Extractor finds data it believes to be relevant, it creates a histogram of the artifacts.
- Volatility: Volatility (available at https://www.volatilityfoundation.org) is an open source framework for incident response and malware analysis. Volatility supports a wide variety of memory dumps from multiple operating systems. Volatility is very powerful and has numerous plugins.
- VOLIX II v2: VOLIX II (available at https://www.fh-aachen.de/en/people/schuba/forschung/it-forensik/projekte/volixe) is a GUI frontend for Volatility. It allows you to combine commands to enhance usability and speed. It saves you the effort of working at the CLI and enables you to point and click to achieve the same result.
We will discuss the use of some of these open source options.
Using Bulk Extractor
Bulk Extractor scans the target media (disk image, file, or directory) and extracts what it believes to be useful information. It ignores the filesystem structure, which allows it to process different parts of the source data set in parallel. This makes it very fast compared to traditional forensic tools. As Bulk Extractor finds data it believes to be relevant, it creates a histogram of the artifacts.
Let's take a look at how it works:
- Bulk Extractor's documentation lists the following information about its output:

Figure 7.9 – Bulk Extractor output options
- You will need to left-click on tools and select Run bulk_extractor… to start analyzing your memory dump, as shown in the following screenshot. When you run Bulk Extractor, the viewer will present itself:

Figure 7.10 – Bulk Extractor menu – the run bulk extractor option
It will then present you with the Run bulk_extractor menu.
- Direct the tool to the location of your image file and the output directory you wish to use. As shown in the following screenshot, you can see the numerous scanners that the Bulk Extractor tool is using to look for artifacts within the memory file:

Figure 7.11 – Bulk Extractor menu options to run
You can check or uncheck a given specific artifact search as your needs dictate.
- Once you are satisfied with the setup, left-click on the Submit Run button to start the extraction process. Once the extraction has started, it will present you with the extraction window, as shown in the following screenshot:
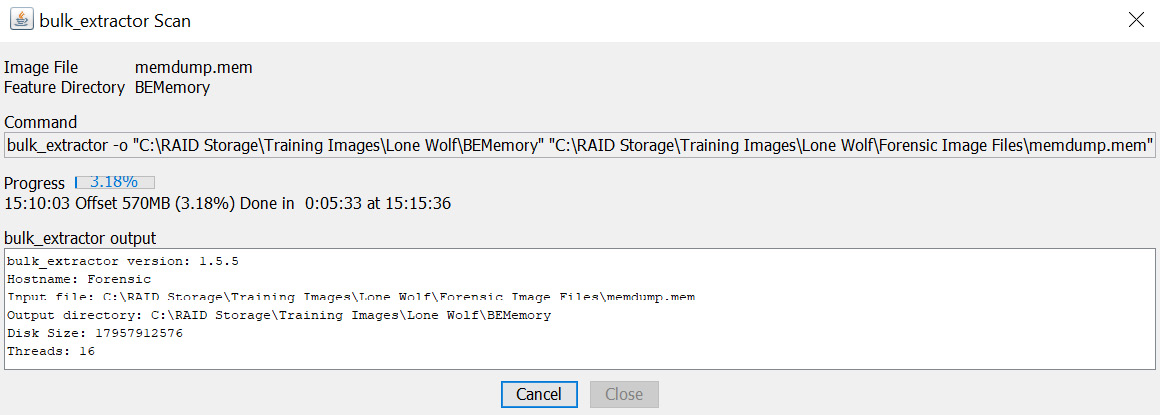
Figure 7.12 – Bulk Extraction extraction window
- Left-click on the Close button to go back to the viewer. The following screenshot shows the Bulk Extractor Viewer:
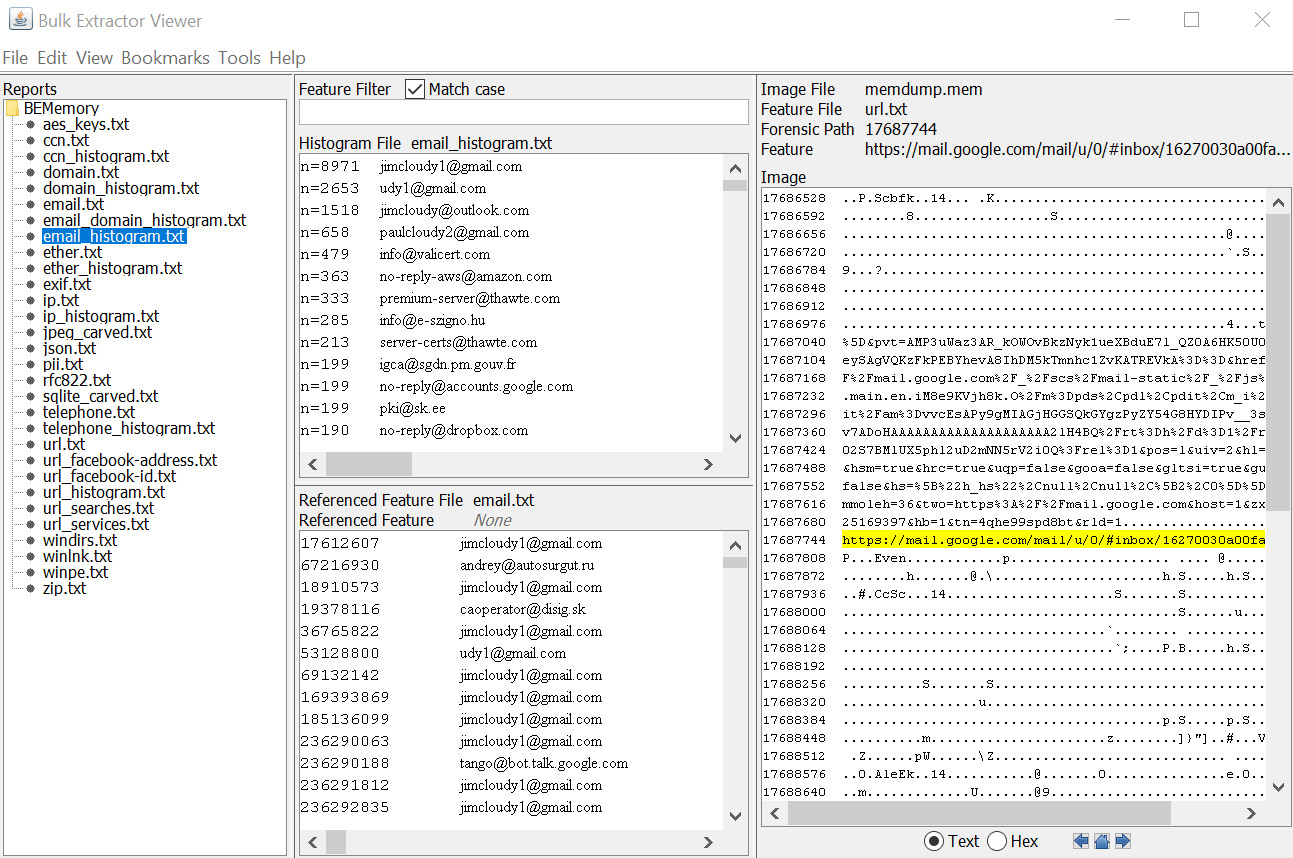
Figure 7.13 – Bulk Extractor Viewer – extracted content
On the left-hand side, we can see the specific artifacts that were recovered by the tool. In the preceding screenshot, I selected the email_histogram.txt file, which gives us a list of times it found a particular email address. By looking at the histogram window, I can see that it found the jcloudy1 email address over 8,000 times. As you go through the email list, you may find emails of evidentiary interest for you to follow up while using traditional media.
Bulk Extractor is a quick and efficient tool that's used to extract data strings that you can use to follow up with your investigation. The next tool we will discuss is Volix II.
Using Volix II
Volix is a GUI frontend for the Volatility framework. It makes it a bit easier for those who are not comfortable using the command-line interface (CLI). Once the program has been downloaded and you have started it for the first time, it will present you with the following screen:

Figure 7.14 – Volix settings
Then, you will be pointed to the location of the Volatility framework. You can use either the standalone executable or the binary files to run the Python scripts. Here, I have already downloaded the standalone executable and have pointed Volix to it.
The other options you can select include the language you wish to use Volix in. If you have a Virus Total API key, you can insert it in on that page. This will compare the data captured from RAM and see if it matches any malware being tracked by Virus Total.
You also have the option of pointing Volix to the John the Ripper executable. If you want to decode/decrypt potential passwords that may be stored in RAM, follow these steps:
- Once you've selected Case, choose New. It will ask you the location of the memory file you wish to analyze, as shown in the following screenshot:

Figure 7.15 – Volix RAM location
- If you click on Reporting, you can specify the path for the report file that Volix will generate.
- Once you select OK, the Volix wizard screen will appear. You now have the option of going through a questionnaire to determine what options you wish to run on the memory file. You can also select one of the pre-created scripts to search for that specific artifact, such as Virus detection or Decrypt SAM Hashes, as shown in the following screenshot:
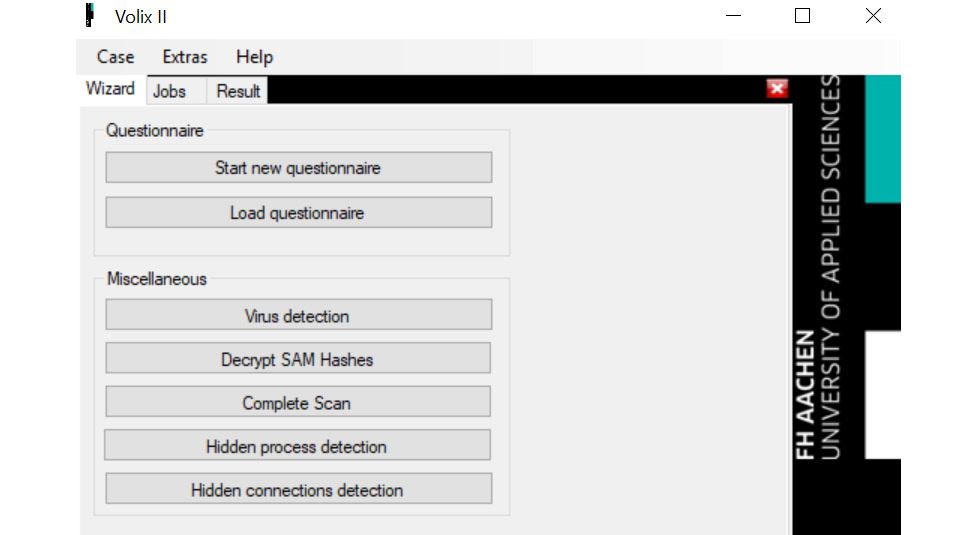
Figure 7.16 – Volix wizard
- I selected the complete scan. You can see the results in the following screenshot:
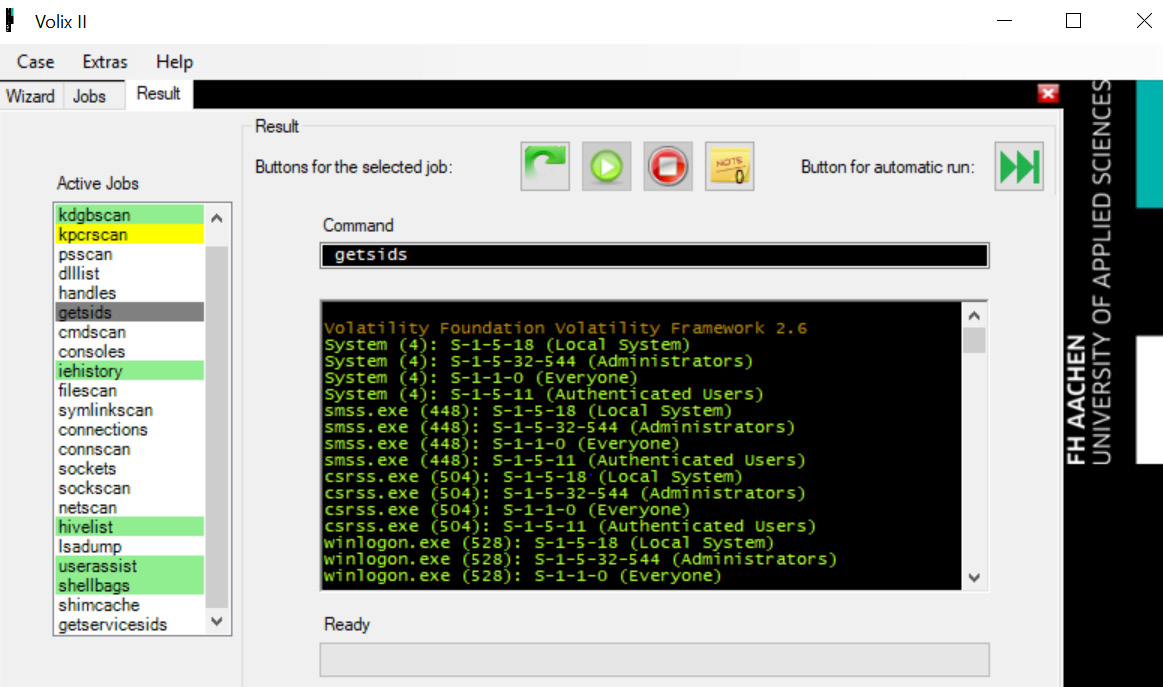
Figure 7.17 – Volix scan results
From the preceding screenshot, you can see I have selected getsids. In the center screen, it has pulled out the SIDs that were in memory at the time of collection.
How many artifacts you ask it to search for at once will dictate the length of time for the application to complete. Overall, it is a relatively quick search compared to other tools.
Summary
In this chapter, you learned about the cornucopia of artifacts you can recover from RAM. You learned about the different tools you can use for the collection process and the tools you can use for analysis. Remember that the tools are always changing with the technology and as new operating systems are released, your primary tool may not collect RAM. Always have a backup plan in case something like that occurs.
You now have the skills to identify and capture RAM in a manner that conforms to best practices. As you analyze the RAM you have captured, you may find artifacts showing the user's activity on the system, such as social media artifacts and recovering passwords or encryption keys.
You may even find information relating to the user's use of email, which will lead us into our next chapter, which is all about email forensics.
Questions
- Which of the following are sources of RAM?
a. Physical memory
b. Pagefile.mem
c. Swap file.page
d. ROM
- Which file is created when the computer goes to sleep?
a. Page file.sys
b. Swap file.sys
c. Hiberfill.sys
d. Hibernation.sys
- When should you capture RAM?
a. Every hour
b. Every week
c. Every digital forensic investigation
d. When you deem it important
- In general, how many items do you need in order to collect RAM?
a. 1
b. 2
c. 3
d. 4
- DumpIt is a GUI tool.
a. True
b. False
- It is acceptable to install DumpIt on the suspect computer.
a. True
b. False
- Which of the following are analysis tools?
a. DumpIt
b. FTK Imager
c. Volatility
d. MD5 hash
Further reading
Ligh, M. H., Case, A., Levy, J., & Walters, A. (2014). The Art of Memory Forensics: Detecting Malware and Threats in Windows, Linu. John Wiley & Sons. (Available at https://www.amazon.com/Art-Memory-Forensics-Detecting-Malware/dp/1118825098.)