
Understanding the Basics of Capacity Dynamics
When you look at your organization from capacity perspective, you begin to see common activities differently and more clearly. This chapter will explain the basic concepts of capacity dynamics and how they affect, or are affected by, everyday activities and your company.
As I suggested in Chapter 12, you buy input capacity in finite amounts. This finite amount will be represented throughout the rest of this book by a rectangle as seen in Exhibit 14.1.

Exhibit 14.1 The rectangle will represent input capacity. It represents what you buy and what you now have access to. It is both a financial representation and an operational representation
The height of the rectangle will represent the amount of capacity you purchase. As seen in Exhibit 14.2, different input capacity scenarios can be represented this way.
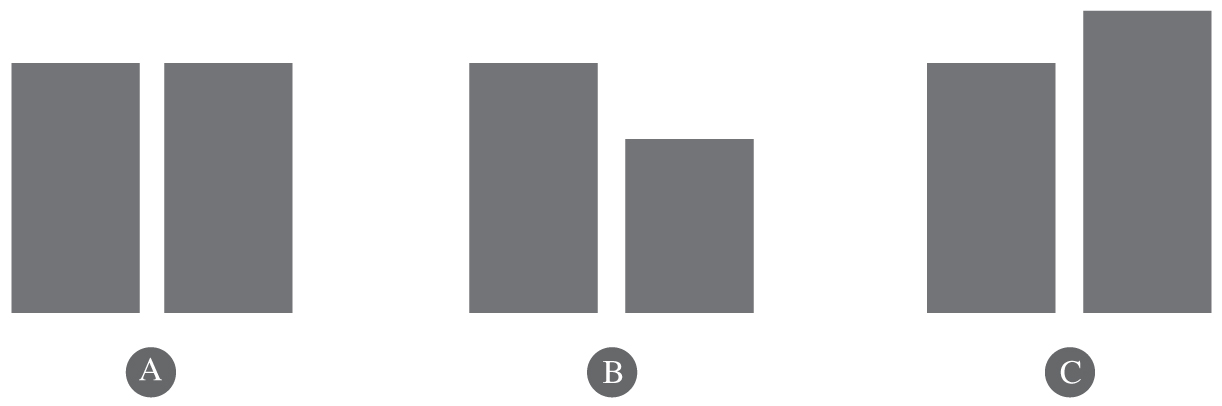
Exhibit 14.2 Since the rectangles can represent both financial values and operational values, it is important to both keep them and consider them in the same context. Financially, A would be capacity that costs the same, with B and C reflecting the rectangle on the right having lower and higher costC, respectively. Operationally, A represents the same amount of capacity with B and C representing situations where there is either less capacity or more capacity
As you begin to consume the capacity by creating output, less of it is available. For instance, if you have someone for eight hours and two hours are spent in meetings, you now have only six hours to use. Once you begin using the 10,000 ft2 of office space that you lease, the used space is no longer available for something else (Exhibit 14.3).

Exhibit 14.3 The lighter colored rectangles represent the consumption or use of capacity. Once the initially available capacity is consumed, less of it is available. Note, when considered in the financial sense, the value of the capacity has not changed when consumed
There are two important issues to consider when trying to understand this relationship. First, note, if you’re considering an analysis period, once the period is complete, the capacity transactions have been defined and the descriptions of what happens during the period are unambiguous. The work you did last month and the efficiency with which you did it can no longer be changed. There’s only one way to describe that analysis period from an activity perspective. Second, when you’re planning, you can think about and often project the input capacity you have and how work will consume this capacity. This positions you to understand the rate at which capacity is being consumed and, therefore, to predict when you have to make investments in more capacity. These investments affect cash flow. Consider the following example.
Assume a company sells space. Every time a sales transaction takes place, a finite amount of the space is used. You calculate a costNC associated with the transaction. Consumption of the space has no financial effect. However, what happens if you are out of capacity and you have another sale? Now you’re obligated to buy more input capacity although the costNC, once the capacity is available, will remain the same. Knowing how much capacity you have and how much is available makes capacity planning and, therefore, cash flow planning much simpler. Accounting would not have predicted the need to spend more money on capacity, therefore affecting cash flow because accounting doesn’t model capacity and capacity utilization.
When you consider the purchase and use of capacity, you will clearly want to understand how efficiently and productively you’re using it. It is your biggest costC category, so managing it becomes critically important. Let’s look at how this works.
When you buy input, there are three states in which it can exist:
1. Productive work—creating output for which there is need or demand
2. Unproductive work—creating output for which there is no need or demand
3. Idle—creating no output
The objective for most operational improvement activities is, or should be, to increase the efficiency of productive capacity, to get more productive output for the same input. Sometimes, however, unproductive capacity gets in the way. Doing unnecessary work may limit your ability to do productive work. If you have a sales person, for example, and you have them spend an inordinate amount of time filling out reports that have limited value or are rarely used, the reports consume available input capacity that could otherwise be used for productive work; selling. If the reports aren’t helping them sell more, and if generating the reports is taking time away from selling, this may be considered unproductive from a sales perspective, and this lost time cannot be recovered.
As mentioned previously, approaches to improving performance and reducing costC and costNC focus on improving the amount of productive capacity and minimizing unproductive capacity. Process improvement, lean, Six Sigma, and information technology all profess to focus on improving productive work. They look to simplify tasks, eliminate unproductive activities, and make it easier to get more from the same or less input. Unproductive work and, in some cases, idle time, are the fat that lean tries to eliminate. However, if the capacity states are not identified explicitly, it is possible to improve the rate of unproductive work. For instance, consider suggestions to overbuild in the name of being efficient. Processes focused on reducing costNC may encourage more work to be done than necessary, which is unproductive. This is covered in more detail in Chapter 15.
I’d like to shift gears and focus on three key aspects of capacity dynamics that will help you see, understand and manage capacity more effectively. These are efficiency, effectiveness, and productivity.
As discussed in Chapter 7, efficiency is the ratio of output to input. In capacity terms, it is the ratio of output capacity to input capacity, or of dynamic capacity to static capacity. As you can see in Exhibit 14.4, increases in efficiency can happen under either or a combination of the two options. It is the same principle at work when considering miles per gallon with your car. You start with a gallon and the question is: How far can you drive with that gallon? More efficient vehicles drive farther on a gallon, of course, than less-efficient vehicles. The other method is to go the same distance using less fuel. Both are improvements in efficiency.
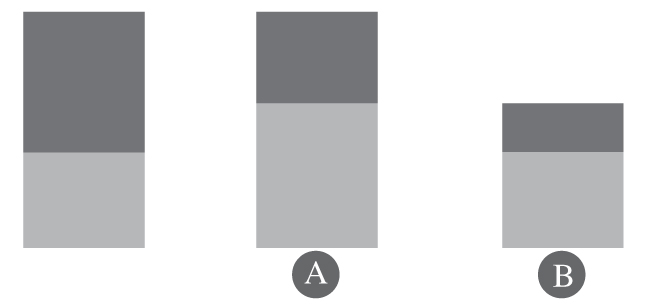
Exhibit 14.4 Increase in efficiency can happen one or both of two ways. With the same level of input, you create more output, as is seen in A. Second, you create the same level of output with less input, shown in B
There is another idea I’d like to share while we’re on this topic. The price you pay for capacity, too, is an input, and so in this context, the amount of gas you buy is the output. This allows you to factor in the cost of the capacity to calculate cost efficiencies. For example, compare buying gas at $4 per gallon versus $3.90. One way to look at it is, you received the same output, one gallon, for a lower price. Another way to consider is, for the same input, $4, you can get more output, gasoline.
Considering this, the efficiency discussion can now be opened up to miles driven at a given costC. Hence, driving 30 miles for $4 is more efficient than driving 15 miles for $4. This frees you to consider multiple options with dissimilar inputs. For instance, which is more efficient, 10 customer service calls for $20 or eight calls for $15? You can now begin considering the cost of capacity along with output to understand cost efficiency.
Effectiveness considers the amount of capacity you should have versus how much you do have. When you buy something, you expect it to be available to you. When it is not, it affects how effective it can be for you. If a new person joins your group but spends half his time wrapping up responsibilities from the previous job, for instance, they are not available to you, so their effectiveness has been decreased.
As seen in Exhibit 14.5, effectiveness may affect your output capacity. In situations where your capacity is involved with creating productive work, a lack of available capacity limits how much productive work you may be able to achieve. In the end, it is as if you bought less input capacity for the same price. This approach is less cost-efficient. See Exhibit 14.6.

Exhibit 14.5 Poor effectiveness can be a capacity killer. Consider space with columns throughout, which limits how much can be used, or a delivery driver whose truck is down for repair. Unproductive meetings, too, can affect effectiveness. Effectiveness is often overlooked, leading to less output being created and, potentially, the need to buy more input

Exhibit 14.6 You purchase the amount of capacity at a given price. However, activities that reduce effectiveness reduce the available amount of what you purchased. The result is seen in the rectangle on the right. Therefore, for the same price, you get what ends up being less input capacity. This leads to a lower cost efficiency
Many look at productivity and consider it to be synonymous with efficiency. I tend to look at them differently. Although productivity can be the ratio of output to input, as is efficiency, I tend to take it one step further. Productivity should be focused on how efficiently I do work for which there is demand. Think about it this way. What does it matter if I am doing work that no one wants or needs? It is waste, no matter how efficiently I created it. This is why I draw the distinction.
Output should be aligned with the demand for it. Otherwise, you are consuming input unnecessarily (Exhibit 14.7). This can sometimes create the false perception that you need more input because the input you currently have is being consumed, although for unproductive work. You should know how much demand there is, whether you can or do meet it doing productive work, and how efficiently you did so. In Appendix B, I have described the math that helps explain the use of productivity and capacity metrics.
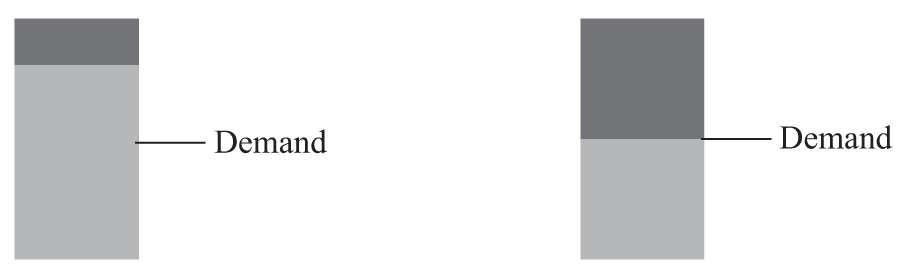
Exhibit 14.7 On the left, you can see a situation where one may be very efficient, but unproductive. This happens when companies overly focus on lowering unit costs without considering how much demand there is for what they’re making. On the right, you see a situation where there is little waste in terms of output, but there is clearly a situation where there is too much input capacity