
Getting Managerial Information from Capacity
As mentioned previously, my guess is that you’re probably thinking this; “I get what you’re telling me, Reginald, but I still need my accounting data. If I don’t have it, how will I replace it?” I’d like to propose that the answer is: Replace it with data from modeling and managing capacity.
Capacity modeling is somewhat of a unifying concept between finance, accounting, and operations. Let me explain. Finance and accounting seek to understand, explain and manage the financial state and performance of your company. In the context of understanding the financial state of your company, cash flow should be pretty easy to model. Most of what you buy and use to do work is capacity. How much and when you buy affects cash and the timing of cash flows. How efficiently you use it affects how much you need to buy. What you create to sell may affect how much money you receive. Since all this happens ahead of accounting processing the data to provide reporting information accounting can only describe all this in hindsight. It cannot model the future effectively, and management is often about planning for the future.
Having spent the last two decades doing cash flow modeling and modeling capacity, I personally feel it is a much more accurate and precise way of looking at, and understanding organizations in a way accounting can never offer, and it’s easier for operations people to understand and manage. There are three reasons why I believe this is the case:
1. Capacity modeling is more precise, accurate, and simpler when modeling cash flow than accounting.
2. It provides necessary operational data and serves as the foundation of information that is used by both accounting and operations.
3. It can explain the accounting results simply, whereas accounting cannot explain capacity data without extreme effort
As mentioned before, when I sought to understand the profit equation, I realized due to accounting rules and procedures, that profit doesn’t represent making money, and costNC, a cost type used to calculate profit, does not represent spending money.
When I began modeling cash, the basic premise was, changes in cash must equal money received minus money spent. I had to model these factors effectively. This meant cash flow cost, costC, had to be accurate when modeling money leaving the company. When does money leave the company? When you pay for something. That’s it. You could be buying capacity, paying for a transaction, or paying an obligation such as taxes and royalties, but in the end, that is when money leaves your company.
When you look at cash flow modeling from a capacity perspective, there is a level of clarity you gain. You know when money comes in and why. You know when money leaves and why. You can understand why you had changes in cash flow and to what extent you had them. Contrast this with cost accounting, where you can become more efficient and claim cost savings and even improvements in profit when no cash was saved!1 Consider, too, things like working capital, where inventory items, sitting on the balance sheet with one of many possible values determined using arbitrary allocation techniques are considered equally with cash, accounts payables, and accounts receivables. Does this make sense to you?
When I speak of capacity cash flow modeling, I compare it to having raw healthy ingredients. I have a tomato, onion, garlic, and perhaps basil. I see these ingredients and I know what I have, I know its value, and they’re easy to understand. Cost accounting, however, creates store bought spaghetti sauce; some good things like tomatoes got mixed in with some bad things like preservatives, chemicals, and who knows what else, and the result is a mixture of stuff we call spaghetti sauce. You may or may not know or understand it and how it was made. In the end, you just know you have spaghetti sauce. Similarly, when you mix raw capacity and cash data, good healthy numbers, with allocations, assignments, and arbitrarily created relationships, you end up with numbers that you may not know or understand where they came from. It’s spaghetti sauce for your business.
Capacity data clarifies matters. Accounting numbers cause companies to do things like sell off products or service lines prematurely because of the perception or belief that it is not making enough money. And what proxy for making money is used? Profit, the concept I argued had nothing to do with making money. It’s spaghetti sauce. This leads to companies selling off divisions that are making money only to have the executives realize that their relative capacity levels are higher after selling off the revenue source without having the revenue to offset it. This leads to poor decision-making in key areas such as outsourcing decisions.
Capacity, on the other hand, looks at the situation differently. The first question is: Is profit the right proxy to use when making this decision? Depending on the allocation approach used, product or service lines can be cash cows and consume little capacity, yet be over taxed on the cost side leading to the belief that it is not as profitable as it should be. The money-making criterion should be how much money the product or service generats given the resources it consumes; efficiency. Accounting does not directly tell you that. The second question to ask is; “If we lose this revenue source, we do not have this cash coming in. What are we going to stop buying to offset this revenue loss” It’s not about allocating costs differently or anything other than what are you buying now, and what are you going to stop buying after you no longer have that money coming in.
I regularly see companies giving groups and divisions the options to buy from external sources when these sources may be competing against internal sources. For example, a college chose to cost the production of copies so this value could be charged to its academic departments. Let’s say this cost was seven cents a copy. So, departments, looking to save money, went outside to buy copies for $0.05 per copy. This transaction increased the college’s costC. Why? Because the college bought and paid for the capacity to make copies. Most of this cost existed regardless of whether the department bought copies from it or not. But now, the department decided to also give money to external providers. The culprit? CostNC, the calculated accounting cost, and not considering the capacity implications of the scenario. This meant more money left the college, putting the college in a worse cash flow situation by increasing costC, than there would have been otherwise, all in the name of the departments trying to reduce what was, to the college, costNC. Someone thought this value meant actual money, so it was charged back to the departments as if it were. This is just one of the many cash flow destroying decisions I see on a regular basis. Capacity modeling focuses on where money is being spent—buying capacity, and raises options in this context.
Models Operations More Effectively
I often cringe when I talk to people and organizations about their operations cost data. When I see a company overly focused on the cost of this or the cost of that, I know at this point, there is likely a true lack of understanding of capacity and, therefore, important operating and financial parameters associated with their company. And remember, capacity is likely their largest costC category. Consider this example. Let’s say gas is $4 and you average 20 miles per gallon. In this situation, you’re looking at a costNC $.20 per mile. By now, you know this doesn’t represent spending money, but those who haven’t read this book may not yet understand the difference. Now consider asking some simple scenarios.
Let’s say all of a sudden the cost per mile goes up to $0.25. What happened? Well, it is unclear. Gas mileage could’ve gone down to 16 miles per gallon. Cost of gas could have gone up to $5. It could be a combination of both. The real answer is not clear, and would require further investigation. Compare this to scenarios in your company. Let’s say you run a variance. Something should cost $3.29 and it ends up costing you $3.42. What happened? What is the source of the variance? In some cases, it might take a significant amount of time to trace the sources and describe what happened. What if you are asked to do the equivalent of reducing the cost to $0.16 per mile? What are your options? Think about how much time, effort, and systems information are required to keep track of this cost and what caused it to change. And all for an artificially calculated value that isn’t even money. You spend lots of money trying to understand and manage numbers that are not money.
Here’s another. Your cost is $0.20 per mile. How much gas do you need to drive 15 miles? The question is really, “How much capacity do I need to go 15 miles?” Again, a fairly simple question that you shouldn’t need to be an accountant to answer. The answer, again, is: It’s not clear. You have too many unknowns to solve this. You don’t know the price of gas and you don’t know fuel efficiency. Now, if you know you are getting 15 miles per gallon, the answer is: I need one gallon. Simple. Clear.
These are examples of issues we may encounter daily. How do I handle changes in efficiency? How much capacity will I need to meet a particular order? When I work with executives, one thing I try to help them see is, operations people should be working with operational data. As an operations person focused on capacity, I will monitor information related to how much capacity I have and how efficiently and productively I’m using it. This is what I can understand and manage intuitively, and the nice aspect is, you have all the capacity cash flow dynamics wrapped up with this information, creating a source for mathematical integrity between operations and operational data and financial data.
It’s like keeping track of how many miles I am able to get from each gallon, and how many gallons I have rather than a cost per mile. I immediately know when I buy more expensive gas or when my gas mileage drops off. I have a sports car that gets 30 miles per gallon on the freeway, but the way I drive it, it gets around 10 miles per gallon or less in the city. I immediately know and can predict the financial impact without even considering cost per mile. I need three times as much gas driving in the city than when on the freeway. If driving 30 miles and gas tank is empty, I know one gallon or $4 may get me there. If driving 30 miles in stop and go traffic, I know $12 will get me there.
If city driving affects cost per mile, so be it, but it isn’t important information. I understand the operating parameters and data, and can manage them to get output and the financial numbers I want (I have $6 in my pocket, can I make it to an ATM?). I can change my driving habits or look for cheaper gas if I need to go farther on less money. Contrast this with someone telling you to lower your cost per mile by $0.05. It is a much more ambiguous and difficult task to manage. If you need that number for some reason such as reporting, fine. However, translating it into operating parameters such as, “you have $40, you currently are getting 15 miles per gallon and to get to your destination without having extra money, you need to average 17 miles per gallon” will help someone understand how to achieve the objective more clearly.
The same applies to managing capacity levels. If I know I need to go a certain distance, or get a certain level of output from my capacity, I will start considering options to help me achieve this objective. For example, if I know I need three-fourths of a gallon to get to my destination, I can ask myself, do I have it? If so, there is no cost to me to drive there. If I don’t have it, I know I will need at least three-fourths of a gallon, so do I buy just three-fourths? Fill up? I can make a decision based on the price of the capacity. If it’s expensive, buy enough to get me to the point when it is cheaper. I can also ask a very important question from a managerial perspective—Can I get there by being more frugal?
When you understand your situation in this way, decisions are simpler, and the effects of the decisions are easier to understand. And the concepts are based on what people understand—what I have and what I need it to do. It is how we think. I have 10 slices of bread, how many sandwiches can I make? Ideally I can make five. Even your kids can solve this problem. We don’t naturally think cost per bread slice. At $5 per loaf, how many loaves do I need? If I need 7 sandwiches, how much do I need to spend on bread? We know its $10. If you calculate a cost per slice of $0.50, does this mean you could spend $7 to make the sandwiches? Not if partial loaves are not available.
In this context, I propose capacity modeling helps people understand their operations more effectively. Capacity focuses on what you buy and how you use it. You know that if you manage your capacity inefficiently, you may have to buy more, and both your costNC and costC can go up. Let me explain.
I have suggested many times that efficiency will not directly improve cash flow. Making you more efficient doesn’t mean you are paid less. However, what if I need many of you? Let’s say you have a customer service agent and you can handle five calls per hour. If seven calls come in, you need two people. Assuming the same efficiency, if 12 calls come in, I will need three people. You can see the pattern in Exhibit 17.1. More demand may make me buy more capacity. This increases costC. Now, let’s increase your efficiency to seven calls per hour. This means we could delay bringing in more capacity as demand increases. The investment is delayed, which aids in cash flow management as seen in Exhibit 17.2.
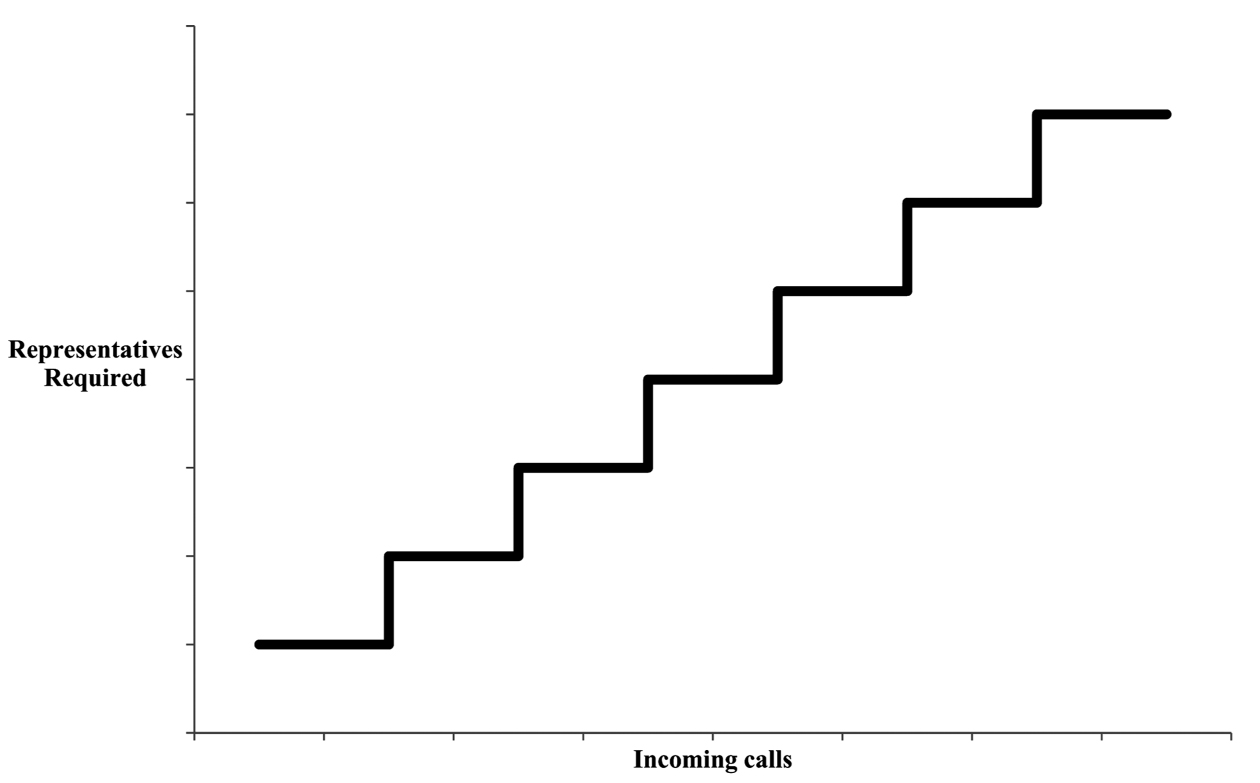
Exhibit 17.1 When your reps can handle five calls per hour, whenever incoming calls exceed a multiple of five, you have to add another rep. Hence, at 6, 11, 16, and so on, you would have to hire another rep
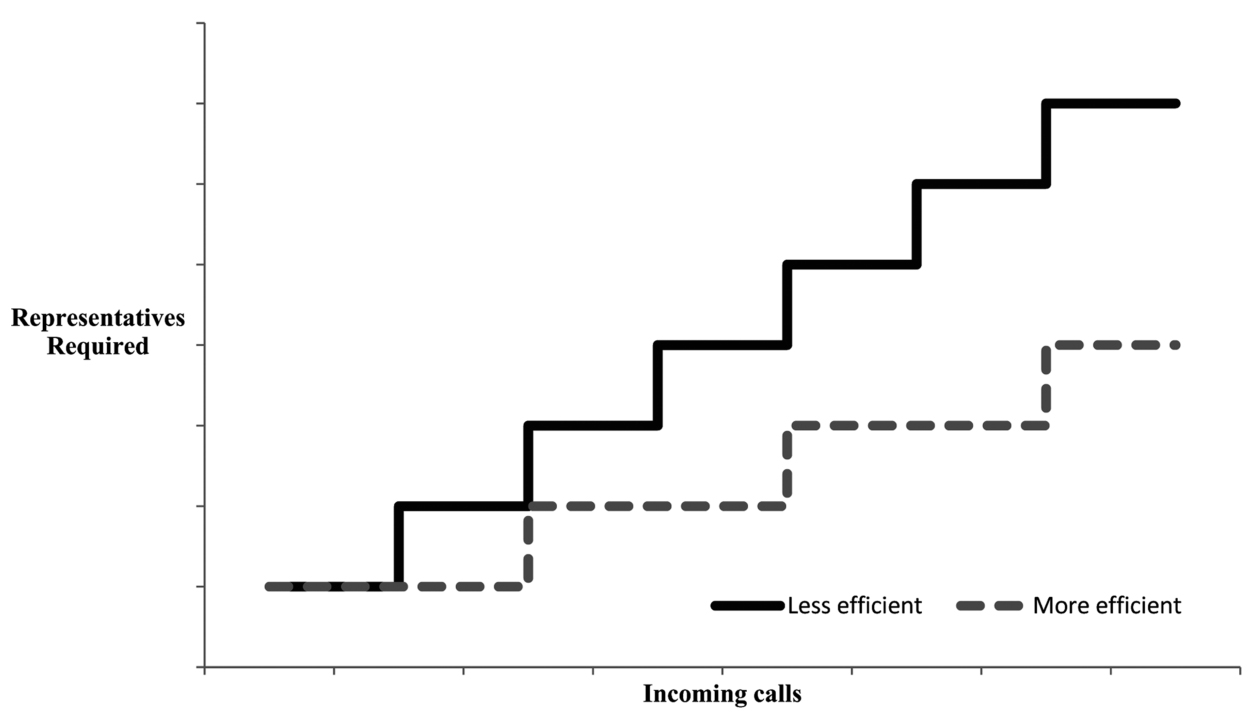
Exhibit 17.2 When you increase the capability to handle calls to seven, you can now delay hiring until you exceed multiples of seven. The result is that you can get more work done with less capacity, which enables your cost curve to increase more slowly
Improvement is manifested as a delay in spending. This suggests that efficiency doesn’t reduce costs, it enables you to increase them more slowly. In times of reduction, efficiency enables you make decisions to reduce costs faster. If demand were 20 calls at an output rate of five calls per person per hour, by increasing from five to seven, you can meet demand with three versus four people. As you reduce size, efficiency can enable you to buy less capacity to meet demand, thereby reducing costC. Notice, the term used is “enable” cost reduction. It does not “cause” cost reduction. You can still choose not to take advantage of opportunities that are available to you.
In the end, there’s not an operating environment you can model with accounting data more effectively than you can by modeling with capacity. This is both from an operational and a financial perspective. Capacity is what you buy and use, so the financial information and the data you get from modeling capacity is accurate because it is the source of the data. Accounting, in contrast, creates relationships that do not exist and it can change the timing of when financial transactions occur. Which seems right to you? It’s like trying to describe you when looking straight at you versus trying to describe you in one of those funhouse mirrors that distorts the perception of you. By modeling the capacity, you have the operating data you need, you have the costC data you need, and you also have all the inputs that accounting should use for reporting purposes.
This is why I call capacity modeling the unifying idea of operations and finance. Dealing with the raw data of what you buy, what you have, and what you do with it is what operations focuses on. What you bought and the financial implications of what you created based on a set of rules set forth by a governing body is the focus of accounting. They all intersect with capacity. In the end, all information you need to manage and make better decisions starts with and is enabled by capacity.
The simplicity when working with capacity lends itself to both operations and accounting. From an operational perspective, I am working in units that operations understands. From a financial perspective, I can take this data and begin to describe what happened operationally using financial language. It becomes much easier to model the financial implications of how you operated in the past or choose to operate in the future, and to project the financial impact of changes you’d like to make to your operations. Additionally, consider what happens when accounting describes a past operating period. Depending on the technique you use, your costs can change. There is no unique description of what happened. Contrast this with capacity modeling, where there is only one description of what happened. Descriptions of capacity and capacity use are unambiguous, and this leads to greater clarity.
Serves as an Intersection between Operations and Accounting
When you model operations from a capacity perspective, money is inherently brought along for the ride. You cannot holistically consider input capacity without considering the costC to have it. When you consider the transaction, you buy input, you enable the creation of output, and from there, you create work products.
When you consider this process objectively, the data and information are very clear. You know how much input you bought. You don’t know exactly how much output you will get, of course, because there are a number of factors that affect output capacity. However, if you consider historical performance, you may gain some insights so you can predict the amount of output capacity generally involved with creating the work products from a planning and budgeting perspective. Once finished, the answers are clearer regarding how much output each work product consumed. The cycle, then, is to consider how much you bought, how you used it, and what you got from it.
A simple example is buying bread to make sandwiches. You spend $5 and you get 20 slices. You should be able to make 10 sandwiches. In the end, you make nine. From the situation, it is clear—you spent $5, got nine sandwiches, and there is either one or two pieces—that were not involved in sandwich production. We can go back and find out pretty easily what happened with the unused bread. They may have been heels, and since people may not like them in sandwiches, we adjust our expected output. One or both could have been damaged. Perhaps, there was demand only for nine, so the two are able to be used in other sandwiches.
Consider cost accounting information. The objective is to determine a cost. How much capacity you brought and the operating details are secondary to the drive toward calculating this non-cash cost if considered at all. So, you might do a number of things. You may use average costing to determine each slice of bread cost you $.25. So each sandwich costs $.50 in bread. In this case, I spent $4.50 on sandwiches and had $.50 in waste. Or, we can allocate this $5 into productive sandwich making and put the unused bread into a waste account or. . . .
The point here is that the capacity approach is clean. When people start creating accounting data, they begin to lose track of the true activities that happened in operations. You buy five dollars’ worth of bread and you used 18 slices to make nine sandwiches. If you want to calculate costNC of a sandwich, you are free to do so. In the end, what does it tell you that is useful operationally or financially?
These reasons cause me to believe that the best way to get your arms around operations and cash flow is to focus on managing capacity. If you focus on capacity, the raw data—the tomatoes, onions, garlic, and basil—you can begin to manage it much more clearly and effectively than when you turn the raw data into spaghetti sauce. The number of a-ha moments clients have had when explaining these ideas has been astounding. Many suggest the ideas were common sense in hindsight, but mind blowing in foresight. Many things make sense in hindsight; hence, the cliché “hindsight is 2020.” However, what may be more important than seeing things in hindsight, is your ability to see them in foresight—20/20 foresight. Wouldn’t it be nice to have 20/20 foresight? Capacity thinking gets you closer to 20/20 foresight than accounting ever will.
_______________
1This is described in some detail in At Issue: Are Cost Savings Mirages? (2014). Business Dynamics & Research. Retrieved from http://bdrco.org/BDR/Publications_files/Are%20Cost%20Savings%20Mirages.pdf