
As mentioned in Chapter 7, efficiency is the math inverse or opposite of the average cost. It is important to understand this relationship because its implications are substantial!
Let’s say you pay a customer service representative $15 to handle calls. The average cost per call curve can be seen in Exhibit A.1. From this curve we start to draw inferences. For example, as she handles more calls, the calculated cost per call goes down. Note, this is costNC because you paid her $15 and that does not change with the number of calls she handles. It creates other curious scenarios as well. For instance, why don’t costs decrease at the same rate throughout the curve? The cost drops significantly between the first and second calls, but not so much between the ninth and 10th calls. What is so special about the second call that its drop is so much more substantial than the 10th?
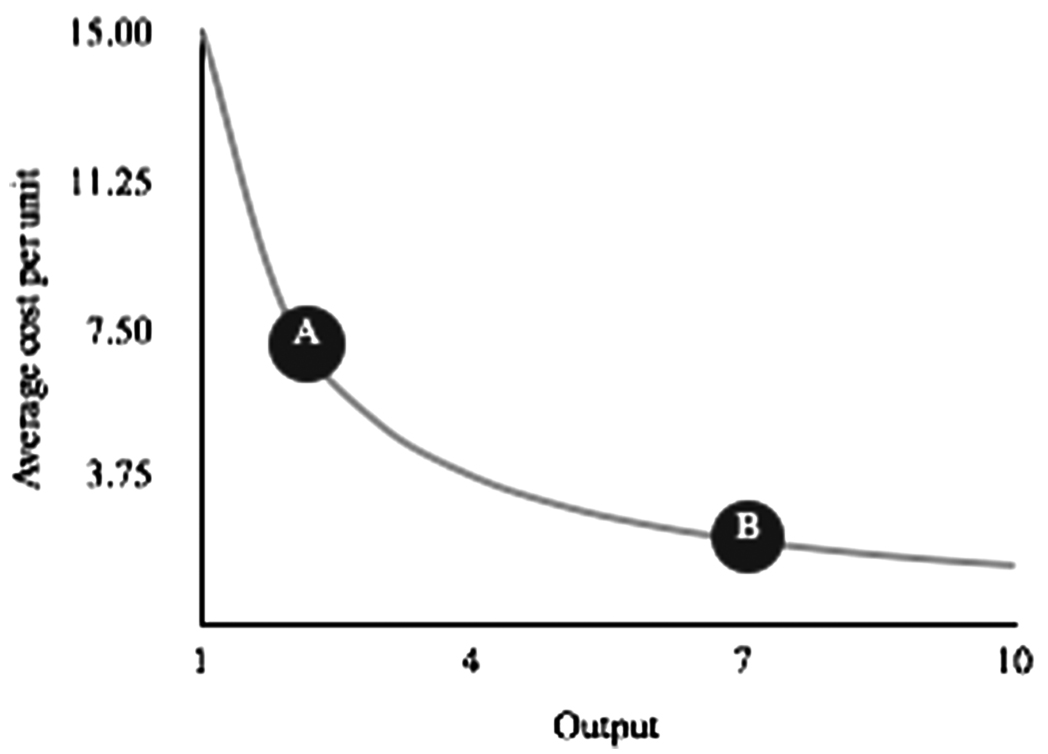
Exhibit A.1 The average cost curve suggests more output at the same input costs reduces the average cost of the output. Hence, going from A to B supposedly leads to a lower cost. The average cost/unit for two units is more than twice that of seven, even though the cash requirement is the same whether there are two or seven units. It is easy to see why people err on the side of doing more
Next, let’s consider different salaries. If someone makes $10 per hour, their cost curve added to the one at $15 per hour creates the curves found in Exhibit A.2. Notice the curves represent one cost, either $10 or $15. Since each curve is the same cost, these are isocost or same-cost curves.

Exhibit A.2 These are the isocost curves for $15 and $10. Assume your output is something like coffee mugs or sales calls. This chart suggests it is cheaper to make seven coffee mugs spending $15 than it is to make two mugs spending less. The same goes for sales calls. However, it is not cheaper to do more. There may be benefit if you sell more with increased output, but that is revenue, not cost. It is easy to see how companies can be enticed by the notion of doing more to “reduce” their costs
There are two key implications here. First, doing more for the same cost has no effect on costC in this and similar cases. The cash is either $10 per hour or $15 per hour. Second, if you want to make a cash-based change, you have to move to entirely different curve. Moving down the same curve only affects costNC, not costC. Only when you make the jump to a different curve will costC be affected.
This is an argument against the cost benefits of economies of scale. Doing more with the same inputs is believed to lower cost. It does lower costNC. All things being the same, and without additional action, costC, the most critical cost, doesn’t go down with economies of scale. Why?
The average cost per unit is determined by taking the cost of the hour $15 and dividing it by what it does, handle calls. Mathematically, this is

Abstractly, this is what you start with, $15, which is input. It’s a start. You then divide it by the output you created, calls. So the formula for the average cost per unit is

Efficiency, on the other hand, is defined as output divided by input, as seen in Equation A.3. This suggests efficiency is just the math inverse or opposite of the average cost per unit. When you begin plotting efficiency of $10 and $15 dollars per hour, you will get the curve found in Exhibit A.3:

The curve in Exhibit A.3 suggests that by getting more output at the same costC, you’re just becoming more efficient. CostC has not gone down. If at $10, your rep processes 10 calls versus eight, they were just more efficient. CostNC goes down, which can lead those who are unaware down the wrong decision-making path.

Exhibit A.3 This picture tells the real story. When you do more with the same, you are more efficient. This chart shows you more efficient at $15 and handling seven than you are at $10 and handling two
I have seen a number of companies get into a significant amount of financial trouble not understanding this relationship. In the name of economies of scale, I’ve seen far too many people create too much output so they can “save money.” When the output exceeds demand, you create waste. Companies have taken themselves to the brink of bankruptcy, if not beyond, believing if they can build more, do more, buy more, it will ultimately be cheaper. They are looking at costNC, not costC. According to the math, these actions may have negative implications for costC.