18 Control Risk
Risk is like fire: If controlled it will help you; if uncontrolled it will rise up and destroy you.
—Theodore Roosevelt
Why do we encounter so many problems while developing software systems? Perhaps because we are not accustomed to thinking ahead or anticipating the worst-case scenario. Hannes Jònsson, a computer science graduate student, wrote a useful example from daily life to illustrate the importance of prevention and early detection in producing high-quality software [Jònsson92]. The example is fire. Every big fire starts as a small one:
Scenario 1: Do nothing. Fires occur occasionally, and there is nothing we can do about it. This will lead to a disaster; there will be losses in both lives and property.
Scenario 2: Rely on fire fighters. Fire fighters will be contacted, but what will happen during the time from when someone called them, until they are on the scene of the fire? As in scenario one, there will be losses in both lives and property.
Scenario 3: Rely on fire extinguishers as a first defense. When a fire is small, it could be put out with a fire extinguisher, and prevented from growing. The property will be saved from further losses. There is one problem with this; it has to be known when the fire starts. If everyone is asleep, no one will report the fire in time; this is now scenario 2.
Scenario 4: Use a fire alarm for early fire detection. If alarmed about the fire in its puberty, it could be put out as in scenario three. There is still one problem; someone has to hear the alarm. The best situation is not to have a fire in the first place.
Scenario 5: Use preventions. By preventing fire there is nothing to worry about. Prevention such as: learning that matches are not a toy, heeding advice from Smokey the Bear, and so on. For example, when the city of Reykjavik changed from heating the houses by burning fuel to heating them with hot spring water, the fire fighters saw a dramatic decrease in house fires. No burning, no fire!
In this chapter, I describe how to plan, track, and resolve the risk in the project plan and remaining work. I discuss how to control risk in a team environment using a creative process. You will need to draw on the process described in Chapters 6 through 8, the risk management plan described in Chapter 15, and the common sense of this chapter to control risk.
This chapter answers the following questions:
![]() What are the activities to control risk?
What are the activities to control risk?
![]() What makes decisions difficult?
What makes decisions difficult?
![]() Will the software industry always need risk management?
Will the software industry always need risk management?
18.1 Develop Risk Resolution Alternatives
The most creative aspect of risk control is determining the possibilities to resolve risk. In order to develop risk resolution alternatives, you need one or more goals and a list of assessed risks. Goals as well as risks should be prioritized. Knowing priorities helps in planning the allocation of resources. When goals or risks share the same priority, you should divide resources equally.
Consider the activities of controlling risk using a team whose goal is to win the ABC proposal. Objectives include addressing technical design risk in the proposal to support a winning proposal strategy. With the help of a facilitator, the team performed a risk assessment to identify and analyze ABC technical design risks. Table 18.1 shows the top ten technical risks associated with the proposed design. Evaluation criteria and a nominal group technique were used to prioritize the top ten technical design risks. The evaluation criteria were cost, schedule, performance, functionality, reliability, flexibility, and expandability. ABC design risks were analyzed to develop a low-risk technical solution to satisfy ABC system requirements. Risk analysis included evaluation of design objectives, constraints, alternatives, and assumptions prior to developing risk resolution alternatives. The risks were assigned to responsible individuals to develop risk resolution alternatives for the proposal team to review.
The design team worked in small groups—often two and sometimes three people—and individually to determine the events and conditions of a scenario for their assigned risk. The risk scenario would describe how the risk might be realized. The team would capture information on the sequence of events that could lead to risk realization and then list the conditions that could perturb the risk situation. They would try to understand the significance of risk occurrence. They would also determine when action would need to be taken to prevent problems. Thinking about how a risk could occur provides clues on what is important to prevent it from occurring.
Table 18.1 Abc Technical Design Risks

As an example, the design team considered the risk of real-time performance. Their uncertainty was that the 3-second update rate may not be feasible under the proposed architecture. The consequence if the risk occurs is to buy more expensive hardware. They stated the risk as a fact: System does not meet real-time performance requirement. If the team’s hierarchical approach adds more overhead than anticipated, a more powerful CPU may be required. Their analysis is based on assumptions for target density and CPU loading and extrapolates based on a few data points. Processing associated with some new data fusion algorithms is also just estimated at this time. The source of risk is the correlation complexity and a lack of validated performance data.
18.2 Select the Risk Resolution Strategy
For the risk scenario that the system did not meet real-time performance requirement, the team discussed potential risk resolution strategies. To prevent the risk from occurring, they could improve their analysis, contain overhead, or buy additional hardware. Not knowing whether this was a complete list of possibilities, the team remembered the seven strategies described in the risk management process. They determined how each strategy might help resolve the risk. For each strategy, the team wrote down a possible approach to resolve the risk. For each strategy and corresponding approach, they discussed the following factors that cause decisions to be difficult [Clemen91]:
![]() Complexity. Are there interrelated issues that cause this strategy to be complex? Are there multiple alternatives that make this decision difficult? Is there a significant economic consideration of selecting this strategy?
Complexity. Are there interrelated issues that cause this strategy to be complex? Are there multiple alternatives that make this decision difficult? Is there a significant economic consideration of selecting this strategy?
![]() Uncertainty. Is this strategy high risk? Do the assumptions for choosing this strategy have a high degree of uncertainty? Is the uncertainty based on perceptions of different people?
Uncertainty. Is this strategy high risk? Do the assumptions for choosing this strategy have a high degree of uncertainty? Is the uncertainty based on perceptions of different people?
![]() Multiple objectives. Are there conflicting goals associated with this strategy? What are the trade-offs in satisfying the objectives? What are the different motivations for or against this strategy?
Multiple objectives. Are there conflicting goals associated with this strategy? What are the trade-offs in satisfying the objectives? What are the different motivations for or against this strategy?
![]() Different perspectives. Are there alternatives or variations of this strategy that we should consider? What are the different choices that we could make? What conclusions could we make?
Different perspectives. Are there alternatives or variations of this strategy that we should consider? What are the different choices that we could make? What conclusions could we make?
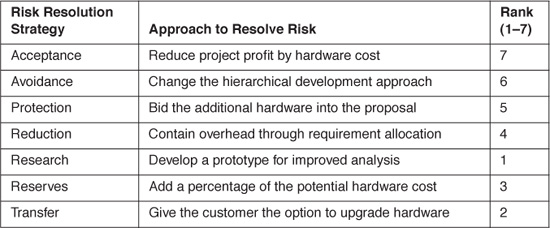
The team scoped the effort for each potential strategy to determine the risk leverage and used the criterion to rank the risk resolution strategies. Table 18.2 shows how the team ranked the strategies from best to worst.
18.3 Develop the Risk Action Plan
The team discussed the top three risk resolution strategies. Selection criteria included minimization of impacts to cost, schedule, performance, and customer satisfaction. They selected the Research alternative based on the need for additional data to support a decision to upgrade the hardware. Improved analysis would assist other aspects of the technical design. The risk action plan they developed included objectives, approach, start date, milestones, due date, responsible person, and resources required. The responsible person documented the risk resolution strategy and the recommended action plan, which would be reviewed by the decision makers. The team believed the managers would agree to the action plan because they calculated significant risk leverage based on the cost of a hardware upgrade. Once approved, there would be a commitment of staff and other resources to support improved analysis. The time frame for action would be dependent on the relative priority of the real-time performance risk.
Table 18.2 Ranking Of Potential Risk Resolution Strategies
18.4 Monitor Risk Status
When the risk action plan was presented at the weekly review meeting, the managers were impressed. One wanted to know if the design team thought about using more than one strategy. Another mentioned a project in another division of the company with expertise in writing system simulations. They nodded in agreement that additional analysis would be required. But they took exception to the risk leverage calculation, saying that when the hardware needed to be purchased, it would probably be reduced from the vendor’s current quote. Besides, they argued, the customer might want the additional capacity that the more expensive hardware would provide. They debated whether the customer had more funding sources than originally thought by the marketing consultant. The discussion degraded over conjecture regarding the size of the customer’s purse. The proposal manager cleared his voice and thanked the design team for their report. He asked for a thumbs-up, -down, or -sideways to indicate management’s agreement to monitor the risk. No thumbs went down, a signal that the risk action plan was approved. A trigger was then established that would activate the risk action plan within the established time frame for action.
18.4.1 Send Notification for Triggers
Two months later, notification of the activated trigger came as an e-mail message from the proposal manager to the design team leader. It was brief but the direction was clear: the real-time performance risk was a hot issue at the last management meeting. The design competition in Phase I is clearly cost constrained and under no circumstances could hardware costs increase. Adding cost might jeopardize the entire Phase II contract. The design team was to proceed with the risk action plan as discussed and report risk status at subsequent management meetings.
Before logging off her computer, the design team leader composed a brief message to the systems analyst who was assigned to the real-time performance risk: “Subject: real-time performance risk. We have approval to execute the next step of the risk action plan. Please document the actions taken and results achieved in your weekly status report.”
18.4.2 Report Measures and Metrics
Both measures and metrics of risk management effectiveness are needed for reporting on risk status. The proposal team did not report measures and metrics for risk management. They were not trained in this area, though, so we should not be surprised about this fact. Table 18.3 lists measures and metrics of the risk management process that a trained team would use to determine progress in resolving risk. Standard measurement practices must be used to obtain consistent and meaningful risk management results.
Risk measures provide objective and subjective data that can be used to indicate the level of project risk. Objective data consist of actual counts of items (e.g., risks identified). These true counts may cause managers to question their subjective understanding and investigate further. Subjective data are based on an individual’s or group’s belief of a condition (e.g., significance of risk). They provide critical information for interpreting and validating objective data. Together, objective and subjective data serve as a system of checks and balances to provide project visibility. Measurements of risk and risk resolution should promote the desired action. For example, proper risk management practices will reward most likely estimates of probability and consequence. Worst-case estimates should not be used because they are not as likely to occur.
Metrics are the quantitative result of a measure taken by use of a measurement process. A measurement process consists of the activities to define, collect, analyze, report, and interpret metrics. Measurement, the use of a measurement process to determine the value of a measure, has limitations that are worth reviewing:
![]() Metrics are only as good as the data behind them.
Metrics are only as good as the data behind them.
![]() Metrics cannot explain or predict anything.
Metrics cannot explain or predict anything.
![]() Metrics cannot make sense of a chaotic process.
Metrics cannot make sense of a chaotic process.
![]() No single metric can provide wisdom.
No single metric can provide wisdom.
![]() Measurement is no substitute for management.
Measurement is no substitute for management.
Table 18.3 Measures and Metrics of the Risk Management Process

Metrics provide a means for monitoring the status of an ongoing project while also providing indications of process improvements for future projects. It is important to have a consistent set of metrics that can be used as status comparisons to previous projects and to reduce confusion on the information represented by the metrics. Reporting risk metrics is effective when the measures are timely, validated, economical, and understandable. Three useful risk metrics are the risk forecast, risk index, and the ROI(RM), which are further described below.
Risk Forecast. The risk forecast is a projection of risk exposure for all risks whose time frames for action are short. Weather is a metaphor used to describe the near-term risk exposure of the project. The risk forecast uses available data to predict the chances that the skies are clear, cloudy, or rainy or that a thunder-storm is approaching. Graphics can quickly communicate the project risk forecast like the change of seasons. An explanation of the risk forecast follows with the events and conditions driving the projection. The definition of short term should be calibrated to a specific project.
Risk Index. The risk index is a measure that “rolls up” the risk being monitored by the project. It is calculated by the summation of risk exposure values as a percentage of project cost. It is important not to “game” the metric by discouraging risk identification or not including all identified risk in the calculation. A risk index will help you to recognize when a more rigorous plan is needed to address risk. When the index reads high during the proposal phase, it is important to explain how your approach will address the inherent risk. For example, your plan may include an experienced team with a key personnel clause, or a software organization with a process maturity assessed at SEI Level 3. Knowing that risk exists and having a plan to resolve it is more sophisticated than pretending it does not exist. Savvy customers will recognize the difference.
Plotting the risk index over the life cycle provides a curve that will have a downward trend as risks are resolved. You should expect the risk index to increase dramatically after a risk assessment. When the index remains the same for months, it is an indication of inactivity in risk management. This metric should be calibrated to a business area or product line. The metric can be calibrated only with trusted historical data. The type of project and acceptable profit margin are factors that can be used to adjust the reading of the risk index as high, moderate, or low.
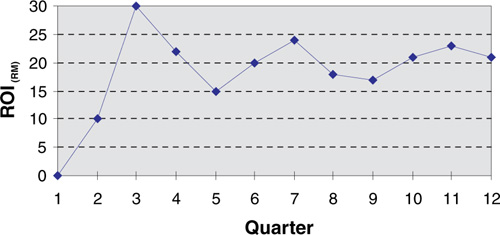
Risk Management ROI. As shown in Figure 18.1, the ROI(RM) metric grows as project risks are resolved. Early variation of the ROI(RM) indicator will occur based on the diversity of opportunities for risk resolution. The indicator will eventually settle into an average ROI(RM) for the project that will be similar to historical project results. The ROI(RM) metric has a number of uses—for example:
![]() Planning benchmark for risk leverage. When planning a risk resolution strategy, ROI(RM) is useful as a benchmark for expected risk leverage. When the expected risk leverage is well below ROI(RM), you may want to spend extra time planning a more effective strategy. When the expected risk leverage is far above ROI(RM), you may want to perform a reality check on your numbers.
Planning benchmark for risk leverage. When planning a risk resolution strategy, ROI(RM) is useful as a benchmark for expected risk leverage. When the expected risk leverage is well below ROI(RM), you may want to spend extra time planning a more effective strategy. When the expected risk leverage is far above ROI(RM), you may want to perform a reality check on your numbers.
Figure 18.1 Roi(RM) trend data. Over time, the cost and savings from risk management yield an Roi(RM) metric that can be used as a standard benchmark.
![]() Planning benchmark for management reserve. An understanding of a typical ROI(RM) can be coupled with good estimates of total project risk exposure to set realistic project management reserve levels.
Planning benchmark for management reserve. An understanding of a typical ROI(RM) can be coupled with good estimates of total project risk exposure to set realistic project management reserve levels.
![]() Project indicator of risk management effectiveness. For a specific project, ROI(RM) is an indicator of risk management effectiveness. When the project ROI(RM) varies significantly from the organization metric, practices should be investigated for either improvement or lessons learned.
Project indicator of risk management effectiveness. For a specific project, ROI(RM) is an indicator of risk management effectiveness. When the project ROI(RM) varies significantly from the organization metric, practices should be investigated for either improvement or lessons learned.
![]() Organizational measure of risk management utility. At the organizational level, ROI(RM) is a measure of the value of the risk management practice.
Organizational measure of risk management utility. At the organizational level, ROI(RM) is a measure of the value of the risk management practice.
18.5 Execute the Risk Action Plan
Six months later, the systems analyst had dusted off the simulation books from his bookshelf, and even found a new one at the local bookstore. The model had grown from a part-time effort to determine response time, to a full-time effort to impress the customer with a demonstration of system capabilities. It would be a competitive advantage to be able to show the customer the increase in performance by simulating the improved hardware. The systems analyst hoped that he could continue refining the simulation, which was more fun than proposal writing.
18.6 Take Corrective Action as Required
When we encounter unexpected outcomes, we can take corrective action as required. Corrective action is different from risk management, because there is no uncertainty. Corrective action is the specific procedure that is needed to solve a known problem; risk management is a general procedure that is needed to resolve a risk. Risk management is the antithesis of corrective action; where one stops, the other begins. Often the answers to questions lead to further questions. The cycle of risk management and corrective action is as constant as night and day.
When you have the ability to manage risk, does that mean that risk will disappear? No, but it does mean that you will have a measure of control over your outcomes. With the ability to manage risk, you can choose to control existing risk, take on additional risk for potentially higher return, or maximize long-term opportunities. Once you have the ability to manage risk, the choice is yours.
The software industry will always need risk management. The form of risk management will become specialized, as in other industries. Studying risk management in other fields provides insight into how to apply risk techniques in software development. The maturity of agriculture, medicine, transportation, and financial markets provides a wealth of risk management instruments used to control risk. The common thread in these fields is that risk can be averted through quantifiable insurance. Perhaps when software development is insurable at a reasonable cost, the instruments of software risk management will be mature.
18.7 Summary
In this chapter, I described how to plan, track, and resolve the risk in the project plan and remaining work. The following checklist can serve as a reminder of the activities to control risk:
1. Develop risk resolution alternatives.
2. Select the risk resolution strategy.
3. Develop the risk action plan.
4. Monitor risk status.
5. Execute the risk action plan.
6. Take corrective action as required.
I discussed several factors that cause decisions to be difficult:
![]() Complexity.
Complexity.
![]() Uncertainty.
Uncertainty.
![]() Multiple objectives.
Multiple objectives.
![]() Different perspectives.
Different perspectives.
The purpose of developing and executing risk action plans and tracking risk status is to manage software risk. With the ability to manage risk, you can choose to control existing risk, take on additional risk for potentially higher return, or maximize long-term opportunities. Once you have the ability to manage risk, the choice is yours.
The software industry will always need risk management. The form of risk management will become specialized, as it has in other industries. Studying risk management in other fields provides insight into how to apply risk techniques in software development. The maturity of agriculture, medicine, transportation, and financial markets provides a wealth of risk management instruments used to control risk. The common thread in these fields is that risk can be averted through quantifiable insurance. Perhaps when software development is insurable at a reasonable cost, the instruments of software risk management will be mature.
18.8 Questions for Discussion
1. Write a progressive five-level scenario that illustrates the importance of prevention in daily life. Use any subject that is a routine experience, such as brushing your teeth, driving a car, or saving for retirement.
2. Explain how a risk scenario removes uncertainty. What do you think happens when you state a risk as though it were a known fact?
3. Explain the factors that cause decisions to be difficult.
4. Do you think it is important to think through all seven risk resolution strategies for a given risk? Discuss why you do or do not think so.
5. When would you use a combination of risk resolution strategies? Explain your answer.
6. What triggers might you use to provide notification to execute a risk action plan?
7. Discuss the importance of training in risk management measures and metrics.
8. Explain the significance of corrective action when you encounter unexpected out-comes.
9. With the ability to manage risk, you can choose to control existing risk, take on additional risk for potentially higher return, or maximize long-term opportunities. Once you have the ability to manage risk, what will you do?
10. Do you think risk is like fire? Discuss why you do or do not think so.
18.9 References
[Clemen91] Clemen R. Making Hard Decisions: An Introduction to Decision Analysis. Belmont, CA: Wadsworth Publishing, 1991.
[Hall95] Hall E. Software Risk Management and Metrics, Arlington, VA: Software Program Managers Network, October, 1995.
[Jònsson92] Jònsson H. Quality Assessment Using Factor Analysis of Survey Data. Masters thesis, Computer Science Department, Florida Institute of Technology, Melbourne, FL August 1992.