7 Track Risk
The greatest potential for control tends to exist at the point where action takes place.
—Louis A. Allen
Monitoring risk may seem like a passive activity, but that is far from the truth. Risk tracking activities include measuring risk and observing project indicators for valuable information regarding when it is time to execute the risk action plan. An indicator implies a value without specifying the quantity directly (e.g., the number of function points is a size measure that indicates software complexity). Groups of indicators provide visibility into project status (e.g., planned versus actual cost). A leading indicator is one that has a predictive capability (e.g., requirements growth may be a leading indicator for software size). Indicators help us to know when to take action to avoid the consequences of risk. Knowing when to take action is key to effective risk control.
In this chapter, I discuss the process definition steps for tracking risk. I describe the risk tracking process, which defines the activities and methods to monitor risk status. I explain techniques and tools to compare risk status with planned thresholds in order to determine when to trigger risk action plan execution.
This chapter answers the following questions:
![]() What are the activities of the risk tracking process?
What are the activities of the risk tracking process?
![]() How can static measures indicate dynamic risks?
How can static measures indicate dynamic risks?
![]() What types of triggers provide notification of unacceptable risk?
What types of triggers provide notification of unacceptable risk?
7.1 Define the Risk Tracking Process
I define risk tracking success criteria in terms of the process goals, the results that we expect to achieve by using the process. We can view the risk tracking process from two perspectives: external and internal. The external view specifies the process controls, inputs, outputs, and mechanisms. The internal view specifies the process activities that transform inputs to outputs using the mechanisms.
7.1.1 Process Goals
The risk tracking process is sufficient when it satisfies these goals:
![]() Monitor the events and conditions of risk scenarios.
Monitor the events and conditions of risk scenarios.
![]() Track risk indicators for early warning.
Track risk indicators for early warning.
![]() Provide notification for triggering mechanisms.
Provide notification for triggering mechanisms.
![]() Capture results of risk resolution efforts.
Capture results of risk resolution efforts.
![]() Report risk measures and metrics regularly.
Report risk measures and metrics regularly.
![]() Provide visibility into risk status.
Provide visibility into risk status.
These goals can be used as a checklist to ensure the process quality.
7.1.2 Process Definition
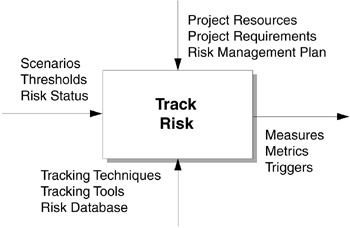
The risk tracking process definition is shown as an IDEF0 diagram in Figure 7.1. IDEF0 is a standard process definition notation used to describe a reusable process component for predictable risk tracking. The diagram describes the top-level process by its controls, inputs, outputs, and mechanisms [AirForce81].
Process Controls. Project resources, project requirements, and the risk management plan regulate the risk tracking process similar to the way they control the risk identification process (see Chapter 4).
Process Inputs. Scenarios, thresholds, and risk status are input to the risk tracking process:
![]() Scenarios monitor the events and conditions that can lead to an unsatisfactory outcome to determine whether the probability of risk occurrence is increasing.
Scenarios monitor the events and conditions that can lead to an unsatisfactory outcome to determine whether the probability of risk occurrence is increasing.
![]() Thresholds define the inception of risk occurrence. Predefined thresholds act as a warning to indicate the need to send notification to execute the action plan.
Thresholds define the inception of risk occurrence. Predefined thresholds act as a warning to indicate the need to send notification to execute the action plan.
![]() Risk status captures the results of implementing the risk action plan in the risk database.
Risk status captures the results of implementing the risk action plan in the risk database.
Process Outputs. Measures, metrics, and triggers are output from the risk tracking process.
Measures determine the dimensions, quantity, or capacity (e.g., lines of code measure the software size). Metrics are a composite measure (e.g., the software productivity metric was 20 lines of code per day) that serves as a guideline or rule of thumb and is useful in planning. Triggers are devices to activate, deactivate, or suspend activity (e.g., the trigger activated the risk action plan).
Process Mechanisms. Mechanisms can be methods, techniques, tools, or other instruments that provide structure to the process activities. Risk tracking techniques, risk tracking tools, and a risk database are mechanisms of the risk tracking process.
Risk tracking techniques are measures and metrics that help to monitor risk status over time. Risk tracking tools automate the tracking process. The risk database contains the measures, metrics, and triggers.
Figure 7.1 Risk tracking process definition. Track Risk encapsulates the activities of the process that transform inputs to outputs. Controls (at the top) regulate the process. Inputs (on the left) enter the process. Outputs (on the right) exit the process. Mechanisms (at the bottom) support the process.
7.1.3 Process Activities
The activities of the risk tracking process are the tasks necessary to monitor risk status and provide notification to trigger risk resolution. The activities of the risk tracking process are as follows:
1. Monitor risk scenarios.
2. Compare thresholds to status.
3. Provide notification for triggers.
4. Report risk measures and metrics.
I discuss the risk tracking process activities as sequential steps, but they can be iterative or parallel in execution.
Monitor Risk Scenarios. The time required to monitor risk scenarios is an investment that we make for high-severity risks. Risk scenarios are like threads that string a risk to a problem. The events and conditions in it are the checkpoints along the road to a problem. Risk scenarios are monitored to determine if the probability of risk occurrence is increasing. When it is difficult to see the big picture, risk scenarios can provide evidence that attention is required because the risk is materializing. Events and conditions of a risk scenario are tracked to decide whether the increase in risk exposure justifies immediate action. Changes in events and conditions can also indicate successful risk resolution. Tracking risk scenarios over time increases the level of confidence that risk probability is decreasing, indicating that progress is being made.
Compare Thresholds to Status. Work activity yields status that is captured in a project tracking tool. When status is input, individual indicators are compared to their planned thresholds. Indicator values outside their accepted norms detect unacceptable conditions and serve as an early-warning system. A trigger is a device to control the implementation of a risk action plan. It can be set through the monitoring of status indicators, planned thresholds, quantitative targets, and the project schedule. The variance between planned thresholds and actual status provides information on when to set a trigger. For risk that is within the planned threshold, triggers can signal the closure of the risk resolution activity.
The anticipated value of a threshold can change at predetermined points in the life cycle. For example, an iterative build strategy can allocate memory requirements such that the threshold is 75 percent capacity at build one completion and 25 percent at build three. For thresholds that change at discrete points throughout the life cycle, triggers can be used to put risk resolution activity on hold.
Provide Notification for Triggers. When a trigger is set, notification is sent to the appropriate personnel through established communication channels. Four types of triggers (described in section 7.4) can provide notification of unacceptable risk:
![]() Periodic event—notification for project-scheduled activities.
Periodic event—notification for project-scheduled activities.
![]() Elapsed time—notification for dates based on a calendar.
Elapsed time—notification for dates based on a calendar.
![]() Relative variance—notification outside a range of acceptable values.
Relative variance—notification outside a range of acceptable values.
![]() Threshold value—notification for values that cross a predetermined threshold.
Threshold value—notification for values that cross a predetermined threshold.
Report Risk Measures and Metrics. A measure is a standard unit of measurement to determine dimensions, quantity, or capacity. For example, the number of logged risks is a measure of identified risk captured in the risk database. A more complex measure is risk exposure, which is a measure of risk magnitude calculated by multiplying risk probability and consequence. A metric uses historical measures to provide guidelines that can help manage the future. It is determined from a composite of measurement data taken over time. For example, the risk management index (RMI), a percentage of total risk exposure to project cost, is a risk metric that provides a rule of thumb for acceptable risk. Through historical data, the RMI can be used to indicate whether a project is high, moderate, or low risk. (Measures and metrics that help determine effectiveness of risk management are defined in section 7.3.)
7.2 Define Risk Tracking Techniques
Project tracking techniques are often driven by the availability of tools. A project’s level of automation depends on the tool set used. Simple spreadsheet applications can be used to chart progress and report trends. A trend is a time series of metrics data (e.g., the trend in productivity is up from last quarter). Sophisticated scheduling tools can be used to track activities and resources over time. Whatever your level of automation, tracking a minimum set of programmatic and technical performance measures is essential to monitoring risk. Technical performance measures (TPM) describe the quantitative targets (i.e., goals) for system performance.
One risk tracking technique uses static measures to indicate dynamic risks. A range of acceptable status is defined; then status is tracked to determine trends. When measures fall below acceptable values, action plans are triggered. The three steps to monitor risk using static measures are as follows:
1. Define warning levels of unacceptable status as thresholds.
2. Monitor status indicators in terms of measures and metrics.
3. Regulate the risk action plan execution using triggers.
In this section, I describe a project control panel used as a tool for project management and the software measures that are used as key project indicators.
7.2.1 Project Control Panel
A project control panel is a visualization of key project indicators that serves as the status display for management and technical metrics. Figure 7.2 depicts the top layer of a project control panel [Brown95]. The control panel is both a communication tool and an operational tool. A project is on course when the gauges of the control panel are kept within accepted ranges. A gauge is a graphic display of a status indicator, a quantitative target, and a threshold warning level. Several commercial companies, including Lockheed Martin and Texas Instruments, have implemented the control panel as an automated project tracking tool. There are several features of an automated control panel:
![]() Monitor project health by a core set of metrics.
Monitor project health by a core set of metrics.
![]() Group metrics into gauge clusters.
Group metrics into gauge clusters.
![]() Convey dissimilar metrics using different formats.
Convey dissimilar metrics using different formats.
![]() Highlight safe operating areas and warning levels.
Highlight safe operating areas and warning levels.
![]() Update display based on real-time work flow.
Update display based on real-time work flow.
![]() Display lower-level and trend data.
Display lower-level and trend data.
Software measures such as earned value are leading risk indicators. By setting thresholds for each indicator, you ensure that you will be alerted to any danger. However, the accumulation of several indicators that are each 10 percent off target will drastically affect your project with no prior warning. To handle this situation, accumulate these indicators in your project cost model throughout the life cycle. (This concept is implemented in the Living Lifecycle Model, described by example in Chapter 22.) Trust your updated cost model, and it will warn you of impending danger, even when others are clueless. Following are key indicators of the project control panel:
![]() Progress. Earned value measures the amount of work remaining by comparing planned and actual milestone completion. Cumulative months measure the schedule remaining by comparing planned and actual time used. Cumulative dollars measure the budget remaining by comparing the estimated completion cost with the actual dollars spent.
Progress. Earned value measures the amount of work remaining by comparing planned and actual milestone completion. Cumulative months measure the schedule remaining by comparing planned and actual time used. Cumulative dollars measure the budget remaining by comparing the estimated completion cost with the actual dollars spent.
![]() Size. Lines of code measure the software size by counting physical or logical source statements.
Size. Lines of code measure the software size by counting physical or logical source statements.
Figure 7.2 Project control panel. Real-time, multidimensional indicators of progress, size, change, quality, risk, and staff are embodied in a project control panel [Brown95].
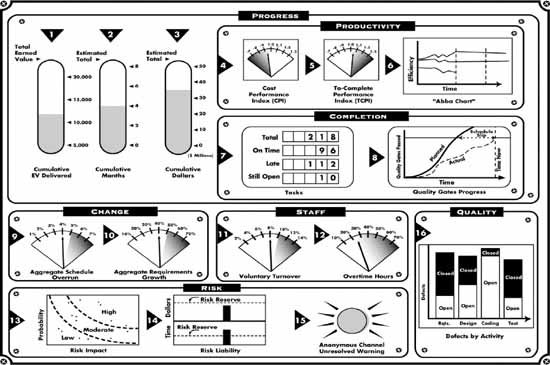
![]() Change. Volatility measures the number of requirements that are added, deleted, or modified. You should expect some requirements growth early in the life cycle. For example, derived requirements account for requirements growth in software requirements analysis. Eventually requirements must stabilize. A high percentage of volatility is a leading indicator of instability and failure.
Change. Volatility measures the number of requirements that are added, deleted, or modified. You should expect some requirements growth early in the life cycle. For example, derived requirements account for requirements growth in software requirements analysis. Eventually requirements must stabilize. A high percentage of volatility is a leading indicator of instability and failure.
![]() Quality. The number of defects closed and open measure the errors found and fixed with the number of errors remaining.
Quality. The number of defects closed and open measure the errors found and fixed with the number of errors remaining.
![]() Risk. Risk exposure measures the level of unresolved risk.
Risk. Risk exposure measures the level of unresolved risk.
![]() Staff. Turnover measures the number of staff who leave the team and cause a productivity drop and schedule disruption. New team members, regardless of skills and experience, require time to become familiar with the project and processes. In addition, a productive team member will usually have to devote time to the new hire. Overtime measures the hours over a standard work week that the staff is working. Staff effectiveness decreases when the overtime percentage approaches 20 percent.
Staff. Turnover measures the number of staff who leave the team and cause a productivity drop and schedule disruption. New team members, regardless of skills and experience, require time to become familiar with the project and processes. In addition, a productive team member will usually have to devote time to the new hire. Overtime measures the hours over a standard work week that the staff is working. Staff effectiveness decreases when the overtime percentage approaches 20 percent.
7.2.2 Software Measures
Software measurement determines how well project, process, and product goals are being met. It is essential for indicating where a project is with respect to its goals. (An unreliable software measurement process is a significant risk.) In the past five years, the measurement community has defined, documented, and distributed guidebooks on proved software measurement techniques. The three that follow are based on the Goal/Question Metric (GQM) paradigm, which helps maintain a focus on the measures appropriate to achieve established goals [Basili84]:
1. Metrics Guidebook for Integrated Systems and Product Development, by the International Council on Systems Engineering (INCOSE), describes a metrics framework for functions commonly represented on product development teams (systems, test, software, hardware, and manufacturing). Management goals are derived through the GQM approach. The guidebook describes the measurement process and how to select appropriate metrics to manage by the data [Wilbur95].
2. Practical Software Measurement (PSM), by the DoD’s Joint Logistics Commanders Joint Group on Systems Engineering, is a guidebook for project managers, written by measurement analysts. It uses measurement indicators to deal with issues (and risks) that cannot be measured directly. PSM recommends using multiple indicators to analyze a software issue [PSM96].
3. Software Measures and the Capability Maturity Model, from SEI, applies the GQM paradigm to the goals of each CMM key process area. Indicators are grouped into categories that provide visibility for status and insight into process effectiveness. Indicators change depending on the maturity level of the organization [Baumert92].
7.3 Define Risk Measures and Metrics
The following measures can be used to determine risk management metrics:
![]() Number of risks—the count of risks currently being managed.
Number of risks—the count of risks currently being managed.
![]() Number of logged risks—the cumulative total of identified issues logged in the risk database.
Number of logged risks—the cumulative total of identified issues logged in the risk database.
![]() Risk category—a count of the number of risks identified in each risk category, an indication of the extent to which risks in a specific category might affect the project.
Risk category—a count of the number of risks identified in each risk category, an indication of the extent to which risks in a specific category might affect the project.
![]() Risk exposure—defined by the relationship [Risk exposure (RE) = P x C], where RE is the risk exposure, P is the probability of an unsatisfactory outcome, and C is the consequence if the outcome is unsatisfactory.
Risk exposure—defined by the relationship [Risk exposure (RE) = P x C], where RE is the risk exposure, P is the probability of an unsatisfactory outcome, and C is the consequence if the outcome is unsatisfactory.
![]() Risk severity—a level of relative risk that includes the dimension of time (e.g., a risk severity category of 1 on a scale of 1 to 9 indicates the highest risk prioritized by risk exposure and time frame for action).
Risk severity—a level of relative risk that includes the dimension of time (e.g., a risk severity category of 1 on a scale of 1 to 9 indicates the highest risk prioritized by risk exposure and time frame for action).
![]() Risk leverage—defined as [(REbefore – REafter)/Risk resolution cost] where REbefore is the RE before initiating the risk resolution effort and REafter is the RE after resolution. Thus, risk leverage is a measure of the relative cost-benefit of performing various candidate risk resolution activities.
Risk leverage—defined as [(REbefore – REafter)/Risk resolution cost] where REbefore is the RE before initiating the risk resolution effort and REafter is the RE after resolution. Thus, risk leverage is a measure of the relative cost-benefit of performing various candidate risk resolution activities.
![]() Risk threshold—determined based on a quantitative goal. Risk threshold is a value that triggers a risk action plan. A notification is sent for variance above the threshold value.
Risk threshold—determined based on a quantitative goal. Risk threshold is a value that triggers a risk action plan. A notification is sent for variance above the threshold value.
![]() Risk indicator—the current value of project, process, and product measures monitored for risk (e.g., cost, schedule, progress, productivity, completion, change, staff turnover, quality, and risk).
Risk indicator—the current value of project, process, and product measures monitored for risk (e.g., cost, schedule, progress, productivity, completion, change, staff turnover, quality, and risk).
![]() Risk management index—a summation of the risk exposure in quantifiable terms for all risks as a percentage of total project cost.
Risk management index—a summation of the risk exposure in quantifiable terms for all risks as a percentage of total project cost.
![]() Return on investment—a summation of the savings for all risks divided by the cost of risk management, which I call ROI(RM).
Return on investment—a summation of the savings for all risks divided by the cost of risk management, which I call ROI(RM).
7.4 Define Triggering Devices
Triggers provide three basic control functions. To activate, triggers provide a wake-up call for revisiting a risk action plan (or the progress made against the plan). To deactivate, triggers can be used to signal the closure of the risk resolution activity. To suspend, triggers can be used to put the execution of risk action plans on hold. Four types of triggers provide notification of unacceptable risk levels:
![]() Periodic event—notification for activities. Project-scheduled events (e.g., monthly management reports, project reviews, and technical design reviews) are the basis for periodic event triggers.
Periodic event—notification for activities. Project-scheduled events (e.g., monthly management reports, project reviews, and technical design reviews) are the basis for periodic event triggers.
![]() Elapsed time—notification for dates. A calendar (e.g., thirty days from today, end of the quarter, and beginning of the fiscal year) is the basis for elapsed-time triggers. You can also use specific dates as time-based triggers.
Elapsed time—notification for dates. A calendar (e.g., thirty days from today, end of the quarter, and beginning of the fiscal year) is the basis for elapsed-time triggers. You can also use specific dates as time-based triggers.
![]() Relative variance—notification outside a range of acceptable values. In Figure 7.3 relative variance is the difference between a predetermined quantitative target and the actual value. A deviation of a specified percentage, either above or below a planned quantitative target, will set a trigger to raise a flag. The relative variance trigger device is useful when monitoring to a requirement window. You may want to know when the actual value is above or below a range of acceptable values relative to your target. A positive variance can indicate a system that is engineered beyond specification. The advantage is that exceeding the specification in this area may leave response time in another area. The disadvantage is that overbuilt systems can be more costly than planned. A negative variance can indicate unmet requirements. In this example, threshold value is the percentage above and below the quantitative target that determines the size of the monitoring window. The more risk averse you are, the larger the monitoring window should be.
Relative variance—notification outside a range of acceptable values. In Figure 7.3 relative variance is the difference between a predetermined quantitative target and the actual value. A deviation of a specified percentage, either above or below a planned quantitative target, will set a trigger to raise a flag. The relative variance trigger device is useful when monitoring to a requirement window. You may want to know when the actual value is above or below a range of acceptable values relative to your target. A positive variance can indicate a system that is engineered beyond specification. The advantage is that exceeding the specification in this area may leave response time in another area. The disadvantage is that overbuilt systems can be more costly than planned. A negative variance can indicate unmet requirements. In this example, threshold value is the percentage above and below the quantitative target that determines the size of the monitoring window. The more risk averse you are, the larger the monitoring window should be.
Figure 7.3 Relative variance. A trigger based on relative variance provides notification outside a range of acceptable values. A threshold is set at 10 percent above and below the quantitative target.
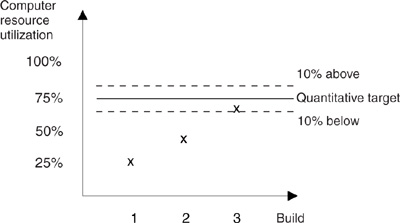
Figure 7.4 Threshold value. A trigger based on threshold value provides notification for values that cross a predetermined threshold.
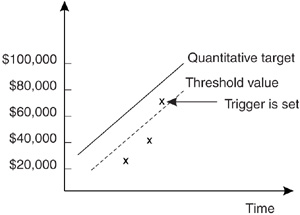
![]() Threshold value—notification for values that cross a predetermined threshold. In Figure 7.4, a comparison of a status indicator to a threshold value is the basis for threshold value triggers. A trigger is set when a status indicator crosses a threshold value. In this example, a study has a not-to-exceed budget of $100,000. A cost indicator of $80,000 will wake up the primary investigator in time to conclude the experiments and report the results within the fixed-cost budget.
Threshold value—notification for values that cross a predetermined threshold. In Figure 7.4, a comparison of a status indicator to a threshold value is the basis for threshold value triggers. A trigger is set when a status indicator crosses a threshold value. In this example, a study has a not-to-exceed budget of $100,000. A cost indicator of $80,000 will wake up the primary investigator in time to conclude the experiments and report the results within the fixed-cost budget.
7.5 Summary
In this chapter, I described the process definition steps for tracking risk:
1. Define the risk tracking process.
2. Define risk tracking techniques.
3. Define risk measures and metrics.
4. Define triggering devices.
I described the risk tracking process, which defines the activities and methods to monitor risk status:
1. Monitor risk scenarios.
2. Compare thresholds to status.
3. Provide notification for triggers.
4. Report risk measures and metrics.
I described how static measures can indicate dynamic risks. A range of acceptable status is defined. Over time, status is tracked to determine trends. When measures fall below acceptable values, action plans are triggered. The three steps to monitor risk using static measures are as follows:
1. Define warning levels of unacceptable status as thresholds.
2. Monitor status indicators in terms of measures and metrics.
3. Regulate the risk action plan execution using triggers.
I described techniques and tools to compare risk status with planned thresholds in order to determine when to trigger action plan execution. A project control panel is a tool that displays the status of key project indicators. A project is on course when the gauges of the control panel are kept within accepted ranges. Gauges are defined for performance measures in the areas of progress, size, change, quality, risk, and staff.
I described four types of triggers that provide notification of unacceptable risk:
![]() Periodic event—notification for activities on the schedule.
Periodic event—notification for activities on the schedule.
![]() Elapsed time—notification for dates based on a calendar.
Elapsed time—notification for dates based on a calendar.
![]() Relative variance—notification for values outside an acceptable range.
Relative variance—notification for values outside an acceptable range.
![]() Threshold value—notification for values that cross a predetermined threshold.
Threshold value—notification for values that cross a predetermined threshold.
7.6 Questions for Discussion
1. Describe the risk tracking process goals. Why is each goal important? Define quantitative success criteria for each goal.
2. Do you think tracking risk scenarios can indicate success or failure of the risk resolution activity? Explain how monitoring risk scenarios increases your certainty over time.
3. Your project tracking tool has been updated to include the latest software modules completed through unit test. The cumulative earned value indicator fell below the planned threshold. Explain how your risk tracking process will react to this event.
4. Explain how triggers can be used to regulate risk action plan execution.
5. List two types of triggers that can be used to provide notification of unacceptable risk. Give an example of how each trigger can activate a risk action plan. Describe who will be notified, and how they will be notified.
6. Discuss the relationship among the key indicators of a software project: progress, size, change, quality, risk, and staff.
7. No single metric can provide wisdom. Describe the minimum set of metrics that you would recommend to ensure project success.
8. Discuss the consequences of reporting risk metrics that are not timely, validated, economical, or understandable.
9. What measures and metrics should be tracked to ensure a cost-effective risk management process?
10. How do you think risk management reserve should be monitored? Explain your answer.
11. Do you agree that the greatest potential for control tends to exist at the point where action takes place? Discuss why you do or do not agree.
7.7 References
[AirForce81] Integrated Computer Aided Manufacturing Architecture, Part II, Vol. IV: Function Modeling Manual (IDEF0). AFWAL-TR-81-4023. Wright-Patterson Air Force Base, OH: Air Force Systems Command, June 1981.
[Basili84] Basili V, Weiss D. A methodology for collecting valid software engineering data. IEEE Transactions on Software Engineering, 10 (6):728–738, 1984.
[Baumert92] Baumert J, McWhinney M. Software measures and the Capability Maturity Model. Technical report CMU/SEI-92-TR-25. Pittsburgh, PA: Software Engineering Institute, Carnegie Mellon University, 1992.
[Brown95] Brown N. The Program Manager’s Guide to Software Acquisition Best Practices. Arlington, VA: Software Program Managers Network, 1995.
[PSM96] Practical Software Measurement: A Guide to Objective Program Insight. Newport, RI: Naval Undersea Warfare Center, 1996.
[Wilbur95] Wilbur A, et al. Metrics Guidebook for Integrated Systems and Product Development. Seattle: International Council on Systems Engineering, 1995.