23 Stage 5: Opportunity
The world would be a better place if we could insure against every future possibility. Then people would be more willing to engage in risk taking, without which economic progress is impossible.
—Kenneth Arrow
In this chapter, I describe the practices that characterize the opportunity stage of risk management evolution. Risk (the chance of a bad outcome) is associated with every opportunity (the chance of a good outcome). When people know how to manage risk, they are prepared to take on more difficult assignments with greater opportunities. But perfect knowledge of risk management cannot guarantee success. Managers give people permission to fail because they know there is no progress without risk. People have a positive belief under conditions of uncertainty when they are not afraid to try. In general, not trying is perceived as the only sure way to fail. Individuals learn from past mistakes—not just their own, but those of other companies, countries, and even other centuries. For example, René Descartes (1596–1650) created a scientific method to achieve certainty by doubting everything except the doubter (Dubito ergo sum. “I doubt; therefore I am.”). By abolishing preconceptions and reducing all problems to mathematical form, Descartes revolutionized science and the material world in which we live.1 Those who understand Descartes’ scientific method realize that you do not know what you do not know. Previously accepted beliefs are questioned in the name of science and progress. The responsibility for managing risk is distributed to everyone, which creates opportunity at all levels of the organization. Management empowers the people to share what they do not know, and risk is resolved because someone else knows. That is what we observe in the opportunity stage project. The project name is covert, but the people, their perceptions, practices, and results are overt.
1 Before Descartes, the focus of the world was spiritual, not material.
This chapter answers the following questions:
![]() What are the practices that characterize the opportunity stage?
What are the practices that characterize the opportunity stage?
![]() What is the primary project activity to achieve the opportunity stage?
What is the primary project activity to achieve the opportunity stage?
![]() What can we observe at the opportunity stage?
What can we observe at the opportunity stage?
23.1 Opportunity Project Overview
The objectives of the project were to build the highest-quality product given the resources and contractual requirements. The ultimate goal was to produce the product within budgeted cost and schedule in a manner that would please the customer and provide the company with profit.
23.1.1 Review the Organization Structure
The organization behind the project is shown in Figure 23.1. Each of the two divisions within the company provided resources to project teams using matrix management. Project management requested human resources from various centers of expertise centralized in sections, and the section managers reviewed available human resources and matched them to requests generated by project management. The project used resources from two divisions and eight sections and hired four independent subcontractors.
23.1.2 Review the Project Structure
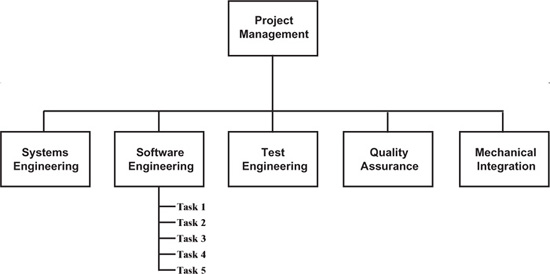
The project had 45 people divided into six functional groups. The project structure is shown in Figure 23.2. Twenty people were assigned to the five major tasks of the software engineering group, with task groups ranging in size from two to four people. Ten people formed the mechanical integration group. The other functional groups consisted of one to three people.
Figure 23.1 Company structure. A complex management hierarchy of divisions, departments, and sections provided the human resources for the project.
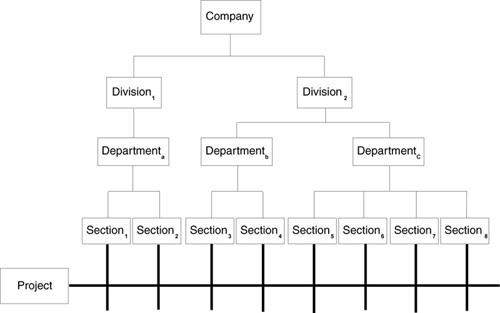
Figure 23.2 Project management structure. The project was divided into six functional groups. Software engineering was further divided into five major task groups.
23.2 Fixed-Price Problems
There were several incentives for the project to perform. The company was awarded the $10 million fixed-price contract as the lowest bidder. (It was rumored that the incumbent company had bid twice that amount in an effort to recoup a loss on the prototype system.) A low-quantity production further reduced the opportunity for profit after system development. This section describes the difficulties that arose from the discovery of the following problems:
![]() The project was severely underbid.
The project was severely underbid.
![]() The customer specification was physically impossible.
The customer specification was physically impossible.
23.2.1 Inherit a Risky Business
After contract award, the project calculated the most probable project cost at $14 million. A $4 million delta meant that the project was severely underbid. Management performed a root cause analysis (the engineers called it a “witch hunt”) to determine how the situation had occurred. They held several meetings with the proposal team and the project team, trying to reconcile the following questions:
![]() What caused the discrepancy between the two estimates?
What caused the discrepancy between the two estimates?
![]() Did the project team change things that were unnecessary?
Did the project team change things that were unnecessary?
![]() Did the proposal team forget things?
Did the proposal team forget things?
![]() Did the proposal team underestimate the cost of some components?
Did the proposal team underestimate the cost of some components?
Eventually people realized that the proposal team just missed the mark on some of the items. Since it was a fixed-price contract, the company (as the contractor) had to deal with the difference. For a business area of that size, $4 million was the expected profit for a whole year. Early on, the customer was made aware of this discrepancy. Since it was a fixed-price contract, the customer was afraid that the team was going to cut corners. From the beginning, the customer relationship was poor. It became apparent that the project had inherited a risky business.
The climate within the company was that management, all the way to the corporate vice presidents, accepted the most probable cost of $14 million and accepted that the company was going to lose $4 million. That atmosphere was probably the most important single item in making the project as successful as it was. If management had refused to accept the most probable cost, the project would have had high turnover. Everyone would have thought that it was impossible; they would give up. But when management said, “It is what it is; do your best,” they inspired everyone to achieve the most probable cost.
It could have gone the other way. Management did not say, “It is $14 million, but we are only going to give you $12 million.” In response, the engineers would devise a schedule based on $12 million and would likely overrun both budget and schedule. It is a different philosophy of management that says, “All right; it is $14 million. Now underrun.” That philosophy enables the team to feel as if they are exceeding their own goal, not meeting an unrealistic goal set by management. Management enabled the team by saying, “The most probable cost is the most probable cost.” It left to the engineering team to figure out if they could do better or not rather than setting out an unrealistic goal.
23.2.2 Discover an Impossible Specification
By the design review, the team showed that some of the requirements were beyond the state of the art—beyond physical possibility. The customer had a difficult time accepting that. It seemed to think that even if the specification was physically impossible, the team was bound by contract to develop the system. The customer did not want to renegotiate any of the specifications because renegotiation on any specification opens the door for cost consideration. As long as the specification remains the same, there is no cost growth to the customer. The relationship between the customer and contractor became hostile. The design review ended prematurely, with the contracting officer threatening to sue the contractor.
23.3 Routine Risk Management
The project used a simple process to discover ways to do better than their plan. Initially, the management team used programwide risk management. One of their biggest areas of cost concern was software. The software team had a large risk of overrun and also potential for cost savings, because the software cost was 50 percent of the total project. A separate team was spawned to work on software possibilities for cost savings. This team implemented software risk management. Other functional groups held risk management meetings and reported results to programwide risk management. These groups used a similar process and met on an as-needed basis. Risk meetings had three major parts:
1. Review status. Review minutes and status from the previous meeting. The minutes included a list of issues, who the volunteers were, and proposed solutions (or resolutions).
2. List risk and opportunity. List roadblocks to the project progress and list opportunities to do better.
3. Brainstorm solutions. Brainstorming solutions usually got the most qualified person to volunteer to take on that solution. For example, if the solution was that the team needed to meet with the antenna designer to help improve the specifications, then the project manager might approve the trip. The project manager was not the right person to go see the antenna designer.
The risk meeting had no leader, only a scribe and a facilitator. The purpose of the weekly risk meeting was to list risks and brainstorm opportunities and solutions. (This is different from the staff meeting, whose purpose was to review progress, status, plans, and problems.) The team had to quantify either negative or positive cost and schedule impacts, as well as the solution cost. Each month, management reviewed the team’s cost savings in terms of cost avoidance and cost reduction.
23.3.1 Quantify Negative Consequences
Cost avoidance is a quantification of the negative outcome of risk. It includes costs that could happen to the project. The major risk previously discussed was that the customer was ready to sue the contractor after hearing that one of the items in the specification was physically impossible. The team could get close to the specification at a significant cost (millions of dollars). If the project was terminated for cause, the contractor would have to refund to the customer any money invested in the project, including procurement costs. If the contractor had invested $3 million into the project, it would lose the entire sum. Actual legalities of such a situation are complex, and the team considered some of that in a calculation of cost avoidance. This was a big risk: the customer was irate and threatening to sue.
In response, the team got the customer involved in order to mitigate the risk. The team always saw the solution as their responsibility, even though it was a customer problem. Because the specification was impossible, they could have said, “There is nothing the team can do. It is an impossible specification.” Instead, they always assumed that they had to do something—in this case, educate the customer on why the specification was impossible.
Most of the core customer team members were not experts in the area of the impossible specification and did not understand that it was impossible. They believed it was possible because they had a previous breadboard system, and it performed to the specification. Nevertheless, the project team knew it was physically impossible and offered to test the breadboard system to see if there was something they could learn from it. During those tests, they were able to observe that the breadboard system operated differently from the specifications. Whoever had written the specification for the production system misinterpreted what the breadboard system was doing. The customer then was willing to change the specification, although it could not permit cost growth because it did not have more money to give the contractor. Eventually the system capability was renegotiated. The customer reduced functionality for all the money the contractor had spent pursuing the impossible specification. Where the risk consequence could have been a big money loser, it ended up a break-even situation.
23.3.2 Quantify Positive Consequences
Cost reduction, a quantification of the positive outcome of opportunity, includes opportunities to exceed metrics. For example, the team believed they could create cost reduction through the use of new technology to increase productivity. The opportunity to improve productivity was presented to management. The engineers said the personal computers (PCs) they were using were inefficient as a development station, because the PC allowed only one window up at a time. The software tools supported multiple windows, but only with an X–Windows terminal. The team brought the issue to management and said, “Productivity could increase if the team had SparcStations or X–terminals to do our coding.” The engineers presented their case quantitatively based on the profit equation, in terms that management understood. If management could spend $300,000 on SparcStations and it reduced their fixed price cost by $500,000 because productivity went up, then they would save $200,000. Since it came out of the same pool of money, it was still profit. Spend $300,000 on SparcStations or $500,000 on project loss: the decision was obvious. Management came up with the money, and the engineers bought SparcStations and had them installed. The improved technology significantly helped software productivity. The engineers eventually quantified the increase in productivity after the SparcStations versus before the SparcStations and used that calculation on the spreadsheet that showed cumulative cost reduction.
23.4 High-Performance Engineering
The engineers had an adage that they said in the hallways: “No complaining.” Obviously the engineers could complain about the project because it was a difficult assignment. Even at $14 million, the project was an aggressive bid. Nevertheless, the engineers said, “No complaining outside the software risk management meeting. If you have a complaint, then bring it to the meeting.” They posted a sign designating the development lab a “Positive Thinking Area.” Despite the difficulty of the project, or perhaps because of it, the engineers took responsibility for managing risk and set a goal to beat the most probable cost estimate by $1 million. In this section, the engineers describe why they volunteered their time to manage risk, how they worked to improve productivity, and how they quantified risk management effectiveness.
23.4.1 Develop a Volunteer Team
Although the programwide risk management meeting had mandatory attendance, the software risk management meeting attendance was voluntary. Because software risk was within their locus of control, the engineers cared about risk management, so attendance at the software risk management meeting needed no enforcement.
A nonautocratic management style that enabled people to voice concerns was a by-product of quality management training, and everyone on the team had quality management training. As a result, engineers who came to the software risk management meeting said whatever they wanted to say. They held the meeting for an hour over lunchtime. In any given week, there were between seven and ten people at the meeting. The meeting held an attraction for the engineers to attend. Like visiting a psychiatrist, the engineers sought help in what was troubling them at work and saw the meeting as an opportunity to improve their work environment.
They shared their concerns and knew they were not alone; there was help at the meeting. Group therapy worked. By not having somebody be held responsible, everyone became responsible for managing risk.
23.4.2 Improve Software Productivity
Each week the team would work on improving productivity. They would come up with subopportunities and sublevel solutions. At any given time, software risk management tracked approximately 30 issues on the status list. Most of the meetings were focused on the following questions:
![]() What could go wrong?
What could go wrong?
![]() How could we do better than the plan?
How could we do better than the plan?
During the coding phase, the team had an objective of increasing productivity by 10 to 20 percent. The team knew that the productivity bid was based on division metrics and wanted to do better than that, so they talked about how to improve productivity every week for an hour. One way the team improved productivity was a midcourse correction of coding standards. They quantified the inefficiency of a coding standard in the following manner: If it is aggravation for 20 people and it slows them down by 10 minutes per day, that is 200 minutes per day, or 867 hours per year.2 At a labor rate of $100 per hour, that adds up to about $87,000. The cost of changing a few lines in the coding standards was zero. Somebody volunteered to do it, and because the coding standards were on-line, it was easily done. The team saved roughly $87,000 by changing a few coding standards.
2 This calculation is based on a nominal 40-hour work week. The coding phase on the project lasted one year.
23.4.3 Quantify Risk Management Effectiveness
The team cumulated their cost savings as well as their cost of performing risk management activities. The process required the estimates for risk probability and consequence to be most likely (not worst-case) estimates. These estimates were updated whenever significant changes occurred in the estimates or when a change in resolution strategy occurred. The project leader reported the return on investment as an indicator of the team’s risk management effectiveness. The calculations show the project ROI(RM) was 22 to 1:
Savings: $8 million ($6 million cost avoidance and $2 million cost reduction)
Cost: $370,000 ($150,000 programwide risk management, $100,000 software risk management, and $120,000 risk resolution cost)
ROI(RM) | = $8 million/$370,000 |
| = 22 to 1. |
23.5 The Power Pyramid
Empowerment is maximizing power and opportunity for success by enabling people. Diane Tracy, author of The Power Pyramid: How to Get Power by Giving It Away, outlines ten principles necessary to achieve empowerment [Tracy90]. The primary premise of The Power Pyramid is that managers can greatly increase their power by enabling all members of the organization to achieve their maximum potential.
A survey was performed to study the teams’ level of empowerment. The survey consists of 63 statements derived from Tracy’s book. The survey statements are subtopics of the ten power principles introduced in the book. The survey maps each of the ten power principles to several statements to determine the level of perceived empowerment. The survey participants were instructed to read the statements and reflect on the experience of their current assignment and project. Allowing 20 minutes, survey participants were to list their response to each statement based on a five-point scale. All information received was confidential, and the participants’ name or other identifying information was not required. Completed surveys were returned by interoffice mail.
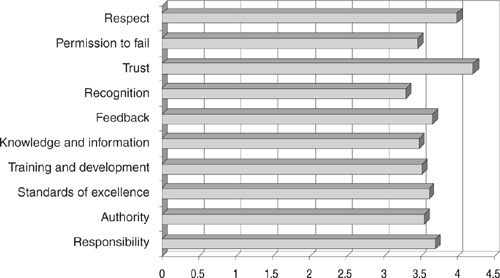
The survey results were used to understand the teams’ perspective of how they were empowered. Figure 23.3 shows the average score for each of the ten empowerment categories. The lessons learned from the survey results were used by the software manager to help improve job satisfaction and team performance. To provide additional insight into the project practices, the software manager and a software engineer summarized their feelings on how they were empowered.
The software manager, responsible for 22 engineers, observed the following actions that management took to empower the team:
![]() Admit weaknesses. “Individuals feel proud when they are given responsibilities above the level they feel they deserve. In order to be successful, we had to rely on each others’ strengths and admit our weaknesses.”
Admit weaknesses. “Individuals feel proud when they are given responsibilities above the level they feel they deserve. In order to be successful, we had to rely on each others’ strengths and admit our weaknesses.”
![]() Eliminate waste. “I encourage my subordinates to produce at levels that exceed current company benchmarks. I ask them to nominate for elimination any process or procedure that does not directly add to improved output. (Improved output includes equal product at reduced cost.)”
Eliminate waste. “I encourage my subordinates to produce at levels that exceed current company benchmarks. I ask them to nominate for elimination any process or procedure that does not directly add to improved output. (Improved output includes equal product at reduced cost.)”
Figure 23.3 Empowerment survey results. An average score above 3.0 is considered better than expected based on previous experiences. Averages below 3.0 indicate less than expected empowerment. The average team score shows a high level of trust and respect.
![]() Discuss failures. “Failure can become a personal experience that impacts productivity when the individual involved believes that others will be judgmental. For example, we have equipment and cabling problems that we must solve during subsystem integration. These problems exist due to an inadequate amount of time spent in testing these items at subsystem levels. The temptation is to lay blame on responsible parties, which is a nonproductive exercise. I promote an attitude of, ‘We will do what it takes to fix whatever needs fixing.’ ”
Discuss failures. “Failure can become a personal experience that impacts productivity when the individual involved believes that others will be judgmental. For example, we have equipment and cabling problems that we must solve during subsystem integration. These problems exist due to an inadequate amount of time spent in testing these items at subsystem levels. The temptation is to lay blame on responsible parties, which is a nonproductive exercise. I promote an attitude of, ‘We will do what it takes to fix whatever needs fixing.’ ”
The software engineer brought team-oriented beliefs from experience gained at a small company. The software engineer observed that management empowered the team members in the following ways:
![]() Expand knowledge. “The company promotes training through a center for training and development. The educational assistance program is another opportunity for employees to expand their knowledge and skills.”
Expand knowledge. “The company promotes training through a center for training and development. The educational assistance program is another opportunity for employees to expand their knowledge and skills.”
![]() Show appreciation. “After working hard for over six months on a technical design, our customer refused to speak with us due to overriding contractual issues. The software engineering team felt unrecognized and unappreciated. Upper management arranged to provide the team with an off-site party. Management gave the team jackets with their names and project logo embroidered on them.”
Show appreciation. “After working hard for over six months on a technical design, our customer refused to speak with us due to overriding contractual issues. The software engineering team felt unrecognized and unappreciated. Upper management arranged to provide the team with an off-site party. Management gave the team jackets with their names and project logo embroidered on them.”
![]() Take chances. “Management allows the team to try things that are less than certain. When we did not succeed, it was treated as a positive experience, and we were encouraged to explore why we did not succeed.”
Take chances. “Management allows the team to try things that are less than certain. When we did not succeed, it was treated as a positive experience, and we were encouraged to explore why we did not succeed.”
23.6 Summary and Conclusions
In this chapter, I described the practices that characterize the opportunity stage of risk management evolution. These practices include positive expectations for success, even under difficult circumstances. Management creates an environment for success, which includes realistic cost estimation, calculated risk taking, and team empowerment. Posters designate the development lab a “Positive Thinking Area.” Because the top ten project manager risk list is different from the top ten software engineer risk list, the team does both programwide risk management and software risk management. The same risk management techniques are used at different project levels. Software risk management provides focus for small risks with big multipliers (e.g., daily 10-minute time wasters for 20 people) to eliminate risks of process inefficiencies that add up. Risks are assessed at a weekly meeting where everyone is responsible because there is no leader, only a facilitator. Risk action plans are developed at the meeting and implemented by volunteers. A survey is used to capture feedback on team empowerment, and the results are used to improve productivity and job satisfaction.
The primary project activity to achieve the opportunity stage is the positive expectation of using risk management to exceed established goals. Placing simple principles for managing opportunity and risk in the hands of the project team empowers them. In the hands of the many, a simple risk management philosophy becomes a powerful weapon. The final software risk management spreadsheet showed $6 million in cost avoidance and $2 million in cost reduction. Quantitative, cumulative, and positive results propagate cost savings to make the team’s goal a reality.
At the opportunity stage, we observed the following:
![]() Management expectations. Management accepted the most probable cost estimate and then challenged the team to underrun. Management expected to hear about opportunities, risks, and problems and to see cost savings quantified on a monthly basis. The practice of quantifying results as abstract as empowerment enabled the team to give back to the organization positive process improvement findings.
Management expectations. Management accepted the most probable cost estimate and then challenged the team to underrun. Management expected to hear about opportunities, risks, and problems and to see cost savings quantified on a monthly basis. The practice of quantifying results as abstract as empowerment enabled the team to give back to the organization positive process improvement findings.
![]() Team empowerment. Sharing concerns at a weekly lunchtime meeting enabled volunteers to choose the risks that they wanted to resolve. The team believed they were empowered through responsibility, authority, standards of excellence, training and development, feedback, and, above all, respect and trust.
Team empowerment. Sharing concerns at a weekly lunchtime meeting enabled volunteers to choose the risks that they wanted to resolve. The team believed they were empowered through responsibility, authority, standards of excellence, training and development, feedback, and, above all, respect and trust.
![]() Positive results. The ultimate test of any philosophy (what you know) or attitude (how you feel about what you know) is objective results. The team’s productivity exceeded the organization metric by 10 percent. The team underran their budget by $2 million. Without their efforts, the project cost at completion could have been $6 million over budget. The project ROI (RM)was 22 to 1. The system worked in the field, and the customer was happy.
Positive results. The ultimate test of any philosophy (what you know) or attitude (how you feel about what you know) is objective results. The team’s productivity exceeded the organization metric by 10 percent. The team underran their budget by $2 million. Without their efforts, the project cost at completion could have been $6 million over budget. The project ROI (RM)was 22 to 1. The system worked in the field, and the customer was happy.
23.7 Questions for Discussion
1. Do you think the ability to manage risk prepares you to take on more difficult assignments? Discuss why you do or do not agree.
2. List three reasons for distributing the responsibility to manage risk. Describe your reasons in terms of their effect on productivity, cost, and risk of system development.
3. Discuss the risk and the opportunity of a fixed-price contract.
4. How does a realistic estimate of the software development effort enable the team to succeed? In your opinion, what are the consequences of an unrealistic estimate?
5. Compare and contrast programwide risk management and software risk management.
6. Explain the difference between cost reduction and cost avoidance. Give examples of cost reduction and cost avoidance from your own experience.
7. Discuss the paradox of getting power by giving it away.
8. What could you do to ensure that feedback was analyzed and used for improvement?
9. Why should results be quantitative, cumulative, and positive? Explain the disadvantages of having each without the other two.
10. Why is economic progress impossible without risk taking? Explain your answer.
23.8 References
[Arrow71] Arrow K. Essays in the Theory of Risk-Bearing. Chicago: Markham, 1971.
[Tracy90] Tracy D. The Power Pyramid: How to Get Power by Giving It Away. New York: Morrow, 1990.